An Extremely Bright Echo Associated With SN 2002hh
Abstract
We present new, very late-time optical photometry and spectroscopy of the interesting Type II-P supernova, SN 2002hh, in NGC 6946. Gemini/GMOS-N has been used to acquire visible spectra at six epochs between 2004 August and 2006 July, following the evolution of the SN from age 661 to 1358 days. Few optical spectra of Type II supernovae with ages greater than one year exist. In addition, images were acquired at all six epochs. The spectral and photometric evolution of SN 2002hh has been very unusual. Measures of the brightness of this SN, both in the R and I bands as well as in the H emission flux, show no significant fading over an interval of nearly two years. The most straightforward explanation for this behavior is that the light being measured comes not only from the SN itself but also from an echo off of nearby dust. Echoes have been detected previously around several SNe but these echoes, at their brightest, were 8 mag below the maximum brightness of the SN. At V21 mag, the putative echo dominates the light of SN 2002hh and is only 4 mag below the outburst’s peak brightness. There is an estimated 6 magnitudes of total extinction in V towards SN 2002hh. The proposed explanation of a differential echo/SN absorption is inconsistent with the observed BVRI colors.
1 Introduction
The condensation of dust in supernova (SN) ejecta is not well constrained by observations since the detection of newly-formed dust in young SNe in nearby galaxies has been extremely rare. Signatures of condensing dust can be observed in nearby Type II SNe approximately 1-2 years after core collapse. There are three strong indications of the formation of dust: 1) a sudden decrease in continuum brightness in the visible due to increased dust extinction, 2) an accompanying development of an infrared excess arising from dust grains absorbing higher-energy photons and re-emitting them in the infrared, and 3) the development of asymmetric, blue-shifted emission-line profiles (e.g., Sugerman et al., 2006). This combination of observable effects can be best explained by dust forming within the expanding ejecta and preferentially extinguishing emission from the far-side (hence red-shifted) gas which also results in a shift of the centroid of the emission line profiles to the blue, optical dimming, and mid-infrared brightening (Lucy et al., 1989, 1991). Asymmetric emission line profiles have been seen in SNe 1987A, 1998S, 1999em, 2003gd and possibly 2004et (e.g., Danziger et al., 1991; Gerardy et al., 2000; Elmhamdi et al., 2003; Pozzo et al., 2004; Sugerman et al., 2006; Sahu et al., 2006). In the sample of seven supernovae with such spectra, dust appears to have formed in the ejecta of at least five. Even within this small sample the dust formation times range from near 300 days to 550 days.
SN 2002hh was discovered in NGC 6946 on 2002 October 31 (Li, 2002). With the subsequent discovery of SN 2004et, there have now been eight SNe discovered in NGC 6946 in less than a century. A spectrum of SN 2002hh, obtained on 2002 November 2, showed a broad but very low contrast H emission and absorption features with a very red, nearly featureless continuum indicating a very young Type II SN (Filippenko et al., 2002). Optical imaging of the region shows extensive dust obscuration in this region of NGC 6946 and Meikle et al. (2002) estimate a total absorption of A6.1 mag toward SN 2002hh of which about 1 mag is Galactic foreground obscuration. This estimate was made by comparing the observed J-Ks color to template IR lightcurves (Mattila & Meikle, 2001) and is supported by the strong interstellar Na I D absorption seen in the spectrum (Filippenko et al., 2002). CO emission was seen in K-band spectra of SN 2002hh in the first 6 months after outburst (Pozzo et al., 2004). The lightcurve of SN 2002hh shows it to be a Type II-P, where the SN remains at or near maximum brightness for 3 months after the explosion (Pozzo et al., 2006).
Thermal emission from dust in or near SN 2002hh was detected at mid-infrared wavelengths from 590 to 994 days by the Spitzer Space Telescope (SST) and confirmed by higher angular resolution Gemini/Michelle observations (Barlow et al., 2005; Meikle et al., 2006). An optically-thick dust shell has been inferred having a mass of 0.04-0.15 M☉ and suggesting a massive M supergiant or luminous blue variable precursor. The inner radius of the shell is estimated to be 1 x 10¹⁷ to 1 x 1018 cm (Barlow et al., 2005; Meikle et al., 2006). The highest velocity gas from the SN 2002hh explosion will not reach this circumstellar dust for approximately 28 yr (Meikle et al., 2006). Barlow et al. (2005) could not rule out the formation of new dust in the ejecta of SN 2002hh, since any mid-infrared emission from new dust would be swamped by emission from the existing circumstellar dust which would occupy a far larger solid angle.
Pozzo et al. (2006) first suggested the existence of an IR echo in the JHK bands around SN 2002hh at early epochs up to 314 days. Meikle et al. (2006) found that the mid-IR flux declined by about 10% from 590 to 994 days. They suggested that most of the mid-IR flux may have come from dust in the star formation region associated with the SN 2002hh precursor. They found no evidence for new dust condensing in the ejecta nor did they attribute the bulk of the emission to heated circumstellar material. The small declining component of the IR flux is attributed to an IR echo. An echo around SN 2002hh has been confirmed in the optical by Sugerman et al. (2007, in preparation), who have found a small but well-resolved circular scattered-light echo in visible light roughly 018 in diameter at the astrometric position of the supernova.
In this paper we present a series of new, late-time optical spectra and photometry of the Type II-P SN 2002hh which were obtained to look for evidence of dust formation in its ejecta.
2 Observations
Spectroscopy was obtained using the Gemini North telescope and the GMOS-N instrument during semesters 2004B, 2005B, and 2006A. Three spectra of duration 900 s each were obtained on 2004 August 20. These were obtained in longslit mode with a slit orientation of 190∘ in order to make use of a bright guide star. A 075 slit width was used for the observations with the B600-G5303 grating in first-order. The central wavelengths of the spectra were 5720, 5700, and 5680 Å, respectively, to ensure that the two gaps between GMOS-N’s three CCD chips could be bridged. A 2x2 binning of the CCD pixels in the low gain setting was employed.
Two additional epochs for SN 2002hh in 2004 were obtained using Director’s Discretionary time. On 2004 October 8, three spectra, each of 720 s duration, were obtained with a setup identical to that described above. The observations had central wavelengths of 5970, 5950, and 5930 Å, respectively. These longer central wavelengths were selected in order that the [Ca II] 7291, 7324 lines would be recorded. A second set of spectra were obtained on 2004 December 11 UT. Each had a duration of 720 s and had central wavelengths of 5970, 5950, and 5930 Å, respectively.
Two epochs of spectra were obtained in 2005. The configuration of GMOS-N was identical to that above. The first epoch was obtained on 2005 August 4. Each exposure had a duration of 900 s to reduce the effect of fading of the SN on the signal-to-noise of the spectra, and had central wavelengths of 5970, 5950, and 5990 Å, respectively. The second epoch was obtained on 2005 October 4 and each spectrum then also had an exposure of 900 s. The central wavelengths were 5970, 5950, and 5990 Å, respectively.
The final epoch of spectra reported in this paper were obtained under an identical GMOS-N configuration on 2006 July 18. Each had a duration of 900 s and had central wavelengths of 5970, 5950, and 5990 Å, respectively.
All spectra had adjacent “GCal” flat exposures taken prior to changes to new central wavelengths. CuAr spectra used to calibrate the pixel-to-wavelength transformation were obtained during daytime. A single set of bias frames were used to reduce all of the spectra. The spectra from each individual night were averaged and normalized.
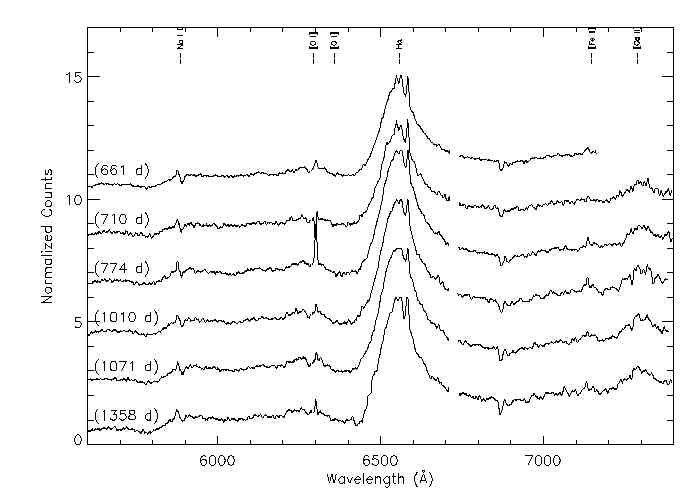
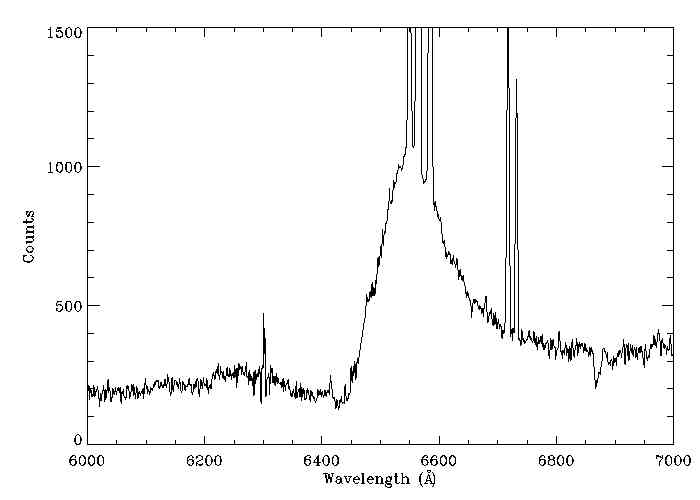
Spectra were reduced using IRAF version 2.12.2a and version 1.8 of the IRAF external package gemini. The usual pattern of reduction tasks gbias, gsflat, gsreduce, gswavelength, gstransform, gsskysub, and gsextract was employed. Sky subtraction regions were identified by eye and usually incorporated about 50 pixels on either side of the SN spectrum itself. Observations were not fluxed due to the lack of photometric conditions on several of the nights and also due to the primary goal of recording line profile variations. The radial velocity of NGC 6946 is 48 km s-1. Emission lines from incompletely-subtracted HII regions in the SN 2002hh spectra allow us to register the supernova to the local standard of rest in the galaxy. The spectra are shown in Figure 1 and are summarized in Table 1. (The spectra in Figure 1 have not been de-reddened.) We adopt 2002 October 29 as the explosion epoch (Pozzo et al., 2006).
The position of the peak of the H emission line is poorly determined due to the contamination of the 6548-6584 [NII] doublet and 6563 H line from the HII region. To gauge the change in line position and symmetry, we instead measured the wavelength at which the ascending and descending portions of the line profile reached 50% of their peak values. Prior to making this measurement, a linear continuum slope correction was applied based on the average intensity levels in the 6240-6260 and 6940-6960 regions of the spectra. The intensity of the H line changes rapidly through the 50% points, ensuring precise estimates for the ascending and descending half-peak wavelengths. In Table 1 we list, from left to right, the UT observation date, the age of the supernova, the wavelength where the ascending portion of the H line reached 50% of its peak value, and the corresponding position on the descending wing. The uncertainty in these wavelengths is 2Å based on the repeatability of the number for each of the three or four spectra obtained on a given observation date.
On each of the six epochs described above, SN 2002hh was also observed in imaging mode with GMOS-N in the ,, and bands. Exposure times were 60 s. The instrumental ,, and magnitudes were converted to standard Johnson-Cousins and magnitudes using the photometric sequence from Table 1 of Pozzo et al. (2006). The standard stars which fell on the central chip of GMOS-N (the chip on which SN 2002hh was imaged) were used for this purpose.
A simultaneous least-squares solution involving common color terms but floating zeropoints for each night was used to transform the instrumental ,, and ALLFRAME magnitudes to the , , and sequence from Pozzo et al. (2006). The uncertainties in the , , and transformations thus derived were 0.033, 0.014, and 0.010 mags, respectively. All transformations were confirmed to be linear with the bulk of the higher uncertainty in the transformation being due to the residuals of two stars of intermediate color, 13 and 14.
The transformations were then inverted to allow the estimation
of the , , and magnitudes from the instrumental ,, and
magnitudes. The derived transformations are,
.
We were not able to provide V magnitudes for SN 2002hh because the supernova light was too confused with other nearby sources of similar brightness in every image taken in the bandpass. On 2006 July 18, SN 2002hh could not be measured accurately in band image for similar reasons, but if it is assumed that the color of the SN was similar to that of the Pozzo standard number 5, then, I = 19.60 mag. (The small coefficient of the r’ magnitude in the transformation to I makes the transformation reasonably robust to reasonable values for the color.) The measured R and I magnitudes of SN 2002hh for the six epochs are listed in Table 1 and plotted in Figure 2.
3 Discussion
3.1 Spectra
Pozzo et al. (2006) observed SN 2002hh in the optical and near-IR from day 3 to 397. Optical spectra, including H and [O I] 6300, 6364, were obtained at seven epochs. Pozzo et al. commented that, in general, the spectra of SN 2002hh resemble those of SN 1987A at similar epochs. In particular, SN 1987A and SN 2002hh both showed P-Cygni profiles in H and Na I D at early times (Phillips & Williams, 1991). The biggest difference between the SN 2002hh and SN 1987A was the strength of the [Ca II] 7291, 7323 and the Ca II near-infrared triplet which was much stronger in SN 1987A (Pozzo et al., 2006). Their last spectrum, obtained on day 397, shows no evidence for a developing asymmetry due to dust forming in the ejecta.
Figure 1 shows the new spectra obtained at an additional six epochs which extend the spectral coverage to day 1358. None of the new spectra reveal an asymmetry in H similar to that which developed in SN 1987A around day 526, and which is believed to have indicated dust formation. (See Figure 7 of Phillips & Williams (1991).) The H profile in SN 2002hh never completely lost its P-Cygni shape, having a broader red wing than a blue wing (Duschinger et al., 1995). Not only is there no development of a blue asymmetry but the FWHM of H has increased in the day 661-1358 spectra compared to the last epoch of Pozzo et al. (2006) at day 397 without any statistically-significant shift in line centroid. No increase in the opacity in the red wing of the line is seen in SN 2002hh. In fact, the red and blue wings both become broader between day 397 and 661. No such broadening of H was seen in SN 1987A (Phillips & Williams, 1991). As seen in Table 1, the half-power points of H show no sensible evolution of either position over the course of the observations reported here.
The fact that the H emission line profile has not developed a blue asymmetry but rather has retained its P-Cygni shape and broadened since day 397 may be due to the presence of an echo around SN 2002hh. It is possible that dust formation in 2002hh is perhaps hidden or its interpretation confounded by scattered light from an echo resulting in a systematic error in the estimated age of the spectral features in the optical (Meikle et al., 2006). However, Pozzo et al. (2006) note that the spectrum of SN 2002hh obtained on day 397 has developed a strong blue continuum indicating that the echo may have been affecting the light from SN 2002hh even at this early epoch.
Since SN 2002hh is a Type II-P, it stayed near maximum brightness for 3 months. Although there is a gap in the photometry of SN 2002hh from day 43 to 166, its lightcurve behavior was consistent with both SN 1987A and SN 1999em (Pozzo et al., 2006). Any SN light echo pulse width will be quite broad since it will contain an integral of the SN light over the first three months. Van Dyk et al. (2006) estimated a pulse width of 43 d in the B band and 138 d in the R band for for the Type II-P SN 2003gd. The pulse width of SN 2002hh is likely to be on the same order of the length of the plateau phase of the lightcurve, 100 d. The echo spectrum seen at late times, would have been an average of the SN spectrum over this period. Pozzo et al. (2006) reported spectra from SN 2002hh at days 4, 8, and 44. At day 44, the lines in the SN spectrum had already taken on the P-Cygni profile shape that was seen all the way out to day 1358.
The late-time Gemini/GMOS spectra do resemble the Pozzo et al. day 44 spectrum of SN 2002hh. The day 44 spectrum and the new late-time (day 661-1358) spectra presented here are all broader than the last Pozzo et al. epoch at day 397. The H emission profiles from the six Gemini/GMOS epochs spanning over 700 days are almost identical and show no significant profile evolution with time as seen in Figure 1. We find that the extrema of the H-alpha wings indicate an expansion velocity between 11,000-13,000 km s-1 for our observed epochs, where the uncertainty is dominated by the assumption of the continuum locations. The FWHM of all six epochs are 5600 km s-1. This is significantly broader than the profiles from days 162 to 397 which have FWHM of 4500 km s-1 (Pozzo et al., 2006). No spectra were taken between days 44 and 162, but the day 44 spectrum was in the middle of the time period of the light pulse which we believe is being scattered toward us in the echo. These late-time H profiles, broader than the previously observed epoch (day 397), support the interpretation that the late-time spectrum is dominated by the echo.
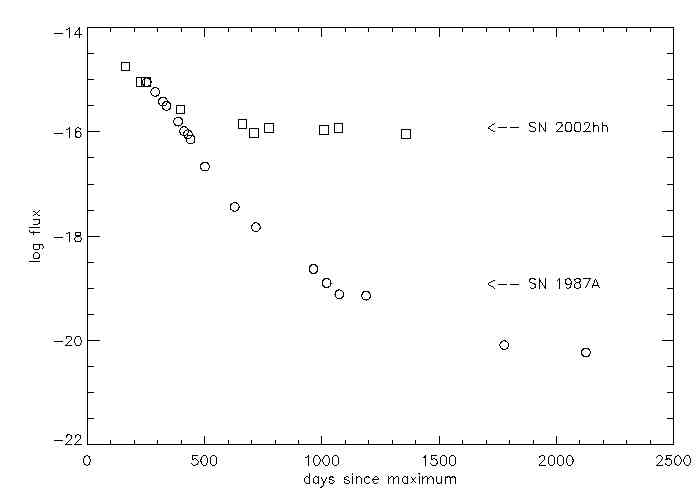
To investigate the contribution from the echo, the counts from SN 2002hh in the H emission line profiles was examined. In Figure 2, the peak counts in H in the Gemini/GMOS spectra from all six epochs, are plotted together, scaled to their exposure times along with the epochs observed by Pozzo et al. (2006). The spectra could not be fluxed since no standards were observed but they were acquired with the same slit with the same setup and at similar airmasses during each observation. The counts should be roughly representative of the relative fluxes taking into account the uncertainties (30%) introduced by differences in seeing and transparency. In particular, the lowest count rates were associated with the worst seeing, which occurred on days 710 and 1358. This comparison in Figure 2 shows that there is no evidence for significant fading of the peak flux in H over the period from day 661 to 1358. We also plot the evolution of SN 1987A’s scaled peak H flux (Caldwell et al., 1993, and the SUSPECT supernova spectrum database) in Figure 2. If SN 2002hh had faded in a manner similar to SN 1987A then from day 397 (Pozzo et al., 2006) to day 1358, H should have faded by a factor of 104. However, SN 2002hh’s H flux only drops by a factor of 2 from 397 to 1358. Since SN 2002hh is a Type II SN, its massive precursor star likely was located in a star formation region with significant H flux. We have decomposed the narrow H II region emission lines and compared their flux to the broad SN H emission. On day 661, the narrow emission lines made up only 16% of the flux. So most of the flux is from the SN, which is distinguished in any case by its very broad H emission up to day 1358. The fact that the broad H emission profile can be seen and measured even at day 1358, means that we are still measuring SN 2002hh without significant contamination from other sources.
3.2 Photometry
The latest published V-band photometry of SN 2002hh, reported by Pozzo et al. (2006), was on day 269 - too early to expect to see evidence of fading due to dust formation in the ejecta and also before the echo became noticeable in the optical. Pozzo et al. (2006) detected a excess that developed in photometry of SN 2002hh between days 200 and 314. This may indicate the presence of an infrared echo, presumably produced by early-time heating of the circumstellar dust by the SN. Meikle et al. (2006) found no evidence for new dust condensing in the ejecta and suggested that most of the mid-infrared flux may have come from dust in the star formation region associated with SN 2002hh’s precursor. They also found that the mid-infrared flux declined by about 10% from day 590 to 994. The small declining component of the infrared flux was attributed to an infrared echo.
The brightness of the echo at optical wavelengths was highly unexpected - the late-time observed brightness of SN 2002hh in the band was only 4 mag fainter than the lightcurve peak of mag (Pozzo et al., 2006, Sugerman et al. 2007, in preparation). The photometry is also consistent with the lack of fading seen in the H emission shown in Figure 2. Typically, one would expect a light echo to appear fainter than the SN maximum by 8 mag or more (Patat, 2005).
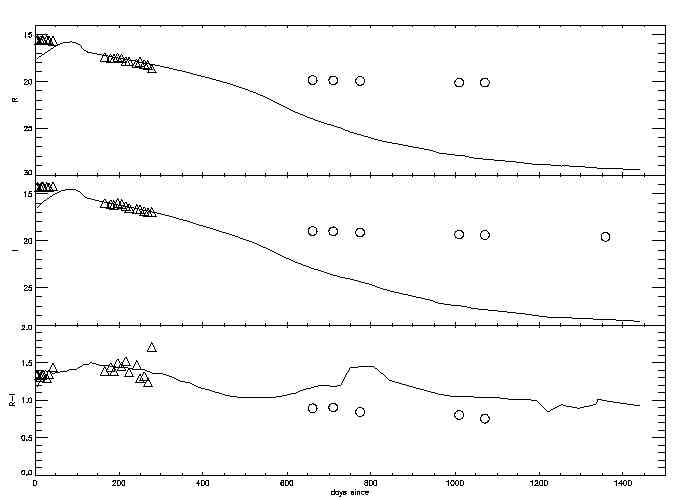
The fading of SN 2002hh, from its maximum brightness of R15.5 mag and I14.3 mag leveled off around R20 mag and I19 mag sometime between day 269, the last Pozzo et al. (2006) data point, and day 661, the first data point obtained here. This behavior is very different from the SN 1987A lightcurve which is scaled and plotted for comparison in Figure 3. If SN 2002hh had behaved like SN 1987A, it would have been about 3-4 mag fainter in the and bands than observed on day 661. SN 2002hh seems to have faded slowly from 19.0 mag to 19.6 mag between days 661 to 1358. By day 1358, SN 2002hh was 9 mag too bright at when compared to SN 1987A.
Observations of SN 2002hh in the optical were made with the High-Resolution Camera (HRC) of the Advanced Camera for Surveys (ACS) aboard HST on 2005 Sep 17, 2006 Apr 23, and 2006 Nov 18, respectively days 1054, 1272, and 1481 after maximum. As will be fully presented in Sugerman et al. (2007, in preparation), these observations reveal a small but well-resolved circular scattered-light echo roughly 018 in diameter at the astrometric position of the supernova. At an estimated distance of 5.9 Mpc, this implies the scattering dust is roughly 12 ly in front of the SN. The integrated fluxes in F435W, F606W, and F814W from the first epoch roughly convert to Johnson-Cousins , , and magnitudes of 24.3, 21.4, and 19.5 mags, respectively (Sirianni et al., 2005). The -band brightness decreased by only a few hundredths of a mag in the subsequent two epochs. These measurements are fully consistent with ours and show that SN 2002hh had still only faded by 4 mag at from its maximum brightness by day 1481.
By day 661, a typical Type II-P SN with no echo will have faded 7.5 mag below its maximum brightness. Normally, an optically-thin dust echo will get brighter as the optical depth of the dust increases (Patat, 2005). Patat’s sheet model (R=200, R=50), assuming dust with =0.03, will produce an echo with a brightness 11.75 mag below the SN maximum, while dust with =2.5 will produce an echo with a brightness only 6.75 mag below the SN maximum. If multiple scattering is taken into account, as it must be when 1, then =2.5 will produce an echo with a brightness 9.25 mag below the SN maximum or three magnitudes fainter than in the single scattering model.
There has been significant discussion in the literature regarding the nature of the dust along the direct line-of-sight to SN 2002hh. Pozzo et al. (2006) reconsidered the extinction for SN 2002hh in some detail and concluded that a line-of-sight “dust pocket” containing atypically small dust grains contributed to a total AV = 5.3 mag as a result of a two-component dust model (AV = 3.3 mag and RV = 3.1 plus AV = 1.7 mag and RV = 1.1). It is, a priori, rather unlikely that there is dust in NGC 6946 with RV = 1.1. Another possible explanation is that there is a mismatch between the intrinsic SED of SN 2002hh and that of SN 1999em which was used as a lightly-reddened template. Wang (2005) alternatively suggested that light scattered from circumstellar dust near the SN will cause apparently small values of RV. It should be noted that in Wang’s model, the inner radius of the shell is at 1016 cm whereas Pozzo et al. (2006) suggest that dust within 1017 cm of the SN would be evaporated. The apparent low value for RV could also be caused by combining dust with two different values of RV (McGough et al., 2005). Nevertheless, the possibility of anomalous dust must be seriously considered when modeling the echo in SN 2002hh.
In one possible scenario, the extreme brightness of the SN 2002hh echo can be explained if the optical depth is much greater (6 mag) along the line of sight to the SN than in other nearby directions (1 mag). The SN light from the echo could skirt the large dust optical depth sitting directly in front of SN 2002hh and be bright by comparison. See Figure 1 of Patat et al. (2006). The observed lightcurve and spectral evolution could be accounted for by the proposed differential total absorption.
Using the time-integrated spectrum of SN 1999em, reddened, as described by Pozzo et al. (2006), to reproduce the expected light pulse from SN 2002hh, the predicted observed colors for the SN 2002hh echo are - = 2.7, -=3.1 and - = 1.3 mag. These are consistent with the colors actually observed for SN 2002hh at early epochs (Pozzo et al., 2006). However, at late epochs (600 days) when the light of SN 2002hh was apparently dominated by the echo light, the colors were, -2.6, -1.8 and -0.8 mags. The and colors are significantly bluer than the observed early-time colors of SN 2002hh, however these colors are reasonably consistent with the reddened supernova light scattering from Galactic-type dust with a modest optical depth (Sugerman, 2003). In this scenario, the echo light passes through the same dust that is reddening the directly transmitted light from SN 2002hh and then passes through and is scattered off of dust lying nearby which also adds a small amount of reddening.
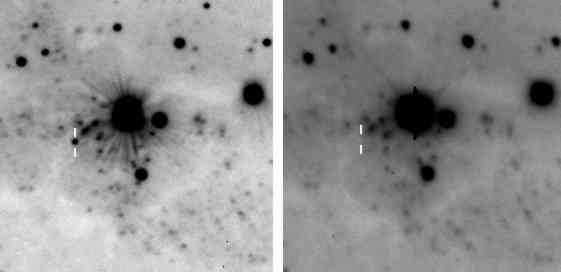
No line-of-sight sources which might contaminate the lightcurve and spectroscopy of SN 2002hh are seen in the shifted and combined sum of three 120 s R-band images (550745o, 550746o, and 550747o) taken on UT 2000 September 27 prior to outburst and shown in Figure 4. The seeing and depth of the combined image is very similar to our Gemini r’ images and allows us to constrain the precursor to be fainter than R=23.0 (or 7.5 magnitudes fainter than maximum light). To further clarify the relative strength of the continuum and H line at late times, the unfluxed but sky-subtracted Gemini/GMOS spectrum for SN 2002hh is shown in Figure 5. The ratio of the peak H to blue side continuum is 5.0 and the ratio of H to red side continuum is 2.9. These numbers are very similar to their day 44 counterparts of 4.75 and 2.7 (Pozzo et al., 2006), respectively, and fully consistent with the light echo explanation for the late-time photometry and spectroscopy.
We note that the appearance of a resolved echo clearly indicates the dominance of the echo light above the local background. In an aperture surrounding the echo in F606W, the sky value is 2.4E-3 (c/s)/pix and in F658N, it is 7.4E-4 (c/s)/pix. This compares to peak values of the echo of 0.73 (c/s)/pix in F606W, and 9.2E-2 in F658N. In other words, the peak surface brightness of the echo is 300 times brighter than the background in F606W, and 125 times brighter in F658N.
While the bluer - and - colors are consistent with the scenario where the echo light is significantly less reddened than the direct SN light, the - color measured by Sugerman et al. (2007, in preparation) is much too red. SN 2002hh is quite faint in the band and this measurement has a large uncertainty (0.5 mag) so the - color could be bluer than reported here. If the these colors are based solely on a less reddened path, then the - and - colors imply that the echo light passes through dust with an AV that is 2-2.5 mag less than the direct light from the SN. This scenario would serve to explain at least some of the excess late-time brightness of the SN 2002hh echo. For the time being, SN 2002hh is unique - it appears to have the brightest echo yet observed around a SN, by a wide margin.
Appendix A Tertiary Standards for NGC 6946
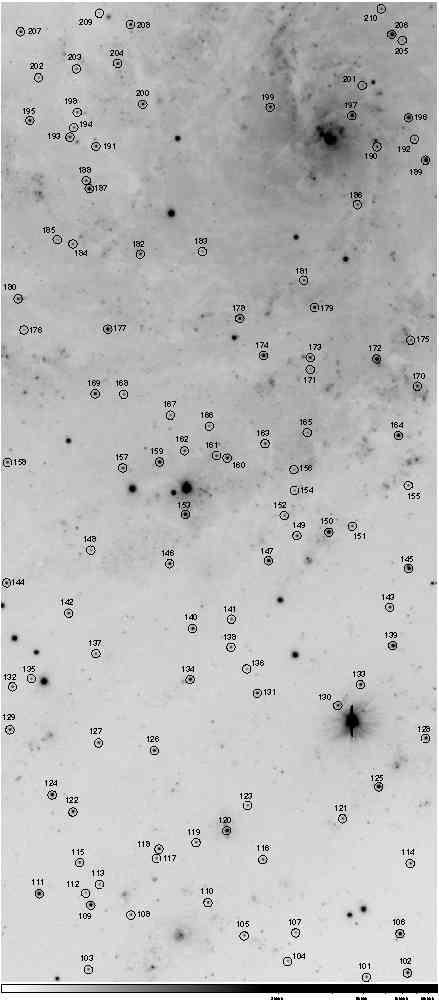
The frequency with which supernovae have appeared in NGC 6946 during the last century suggests that the definition of a local set of faint tertiary standards, suitable for use on large telescopes, would be a worthwhile undertaking. In Section 2, we described the determination of the transformations to the , , and system of local photometric standards list by Pozzo et al. (2006) in their Table 1. We defined a set of fainter standards in the following way. Stars selected were present in our output photometry lists in all three filters (, , and ), at all 6 epochs, and for which the photometric instrumental uncertainties were all less than or equal to 0.03 mag. There were 110 such stars. These are labelled 101-210 so that there is no confusion with the Pozzo et al. numbering scheme.
The instrumental , , and magnitudes were transformed to the system determined by Pozzo et al. (2006) and the unweighted mean and standard deviation of the six points for each star are listed Table 2. The uncertainties don’t formally include the uncertainties in the transformation - they are the standard deviations for the set of six transformed magnitudes in each filter. The locations of the standard stars are plotted in Figure 6 which is an image with an exposure of 60.0 s obtained with GMOS-N on 2004 August 20. North is 10∘CCW from vertical and east is 90 ∘CW from north. The image scale is 01454 per pixel and the height and width of the image are 149 and 335 arcsec, respectively.
References
- Barlow et al. (2005) Barlow et al., M. J. 2005, ApJ, 627, L113
- Caldwell et al. (1993) Caldwell et al., J. A. R. 1993, MNRAS, 262, 313
- Danziger et al. (1991) Danziger, I. J., Lucy, L. B., Bouchet, P., & Gouiffes, C. 1991, in Supernovae. The Tenth Santa Cruz Workshop in Astronomy and Astrophysics, (Springer-Verlag, New York), ed. S. E. Woosley, p. 69
- Duschinger et al. (1995) Duschinger, M., Puls, J., Branch, D., Hoeflich, P., & Gabler, A. 1995, A&A, 297, 802
- Elmhamdi et al. (2003) Elmhamdi et al., A. 2003, MNRAS, 338, 939
- Filippenko et al. (2002) Filippenko, A. V., Foley, R. J., & Swift, B. 2002, IAU Circ., 8007, 2
- Gerardy et al. (2000) Gerardy, C. L., Fesen, R. A., Höflich, P., & Wheeler, J. C. 2000, AJ, 119, 2968
- Hamuy & Suntzeff (1990) Hamuy, M. & Suntzeff, N. B. 1990, AJ, 99, 1146
- Li (2002) Li, W. 2002, IAU Circ., 8005, 1
- Lucy et al. (1989) Lucy, L. B., Danziger, I. J., Gouiffes, C., & Bouchet, P. 1989, Structure and Dynamics of the Interstellar Medium, IAU Colloq. 120:, 350, 164
- Lucy et al. (1991) Lucy, L. B., Danziger, I. J., Gouiffes, C., & Bouchet, P. 1991, in Supernovae. The Tenth Santa Cruz Workshop in Astronomy and Astrophysics, (Springer-Verlag, New York), ed. S. E. Woosley, 82
- Mattila & Meikle (2001) Mattila, S. & Meikle, W. P. S. 2001, MNRAS, 324, 325
- McGough et al. (2005) McGough, C., Clayton, G. C., Gordon, K. D., & Wolff, M. J. 2005, ApJ, 624, 118
- Meikle et al. (2002) Meikle, P., Mattila, S., Smartt, S., MacDonald, E., Clewley, L., & Dalton, G. 2002, IAU Circ., 8024, 1
- Meikle et al. (2006) Meikle, W. P. S., Mattila, S., Gerardy, C. L., Kotak, R., Pozzo, M., van Dyk, S. D., Farrah, D., Fesen, R. A., Filippenko, A. V., Fransson, C., Lundqvist, P., Sollerman, J., & Wheeler, J. C. 2006, ApJ, 649, 332
- Patat (2005) Patat, F. 2005, MNRAS, 357, 1161
- Patat et al. (2006) Patat, F., Benetti, S., Cappellaro, E., & Turatto, M. 2006, MNRAS, 369, 1949
- Phillips & Williams (1991) Phillips, M. M. & Williams, R. E. 1991, in Supernovae. The Tenth Santa Cruz Workshop in Astronomy and Astrophysics, (Springer-Verlag, New York), ed. S. E. Woosley, p. 36
- Pozzo et al. (2004) Pozzo, M., Meikle, W. P. S., Fassia, A., Geballe, T., Lundqvist, P., Chugai, N. N., & Sollerman, J. 2004, MNRAS, 352, 457
- Pozzo et al. (2006) Pozzo et al., M. 2006, MNRAS, 368, 1169
- Sahu et al. (2006) Sahu, D. K., Anupama, G. C., Srividya, S., & Muneer, S. 2006, astro-ph/0608432
- Sirianni et al. (2005) Sirianni, M., Jee, M. J., Benítez, N., Blakeslee, J. P., Martel, A. R., Meurer, G., Clampin, M., De Marchi, G., Ford, H. C., Gilliland, R., Hartig, G. F., Illingworth, G. D., Mack, J., & McCann, W. J. 2005, PASP, 117, 1049
- Sugerman (2003) Sugerman, B. E. K. 2003, AJ, 126, 1939
- Sugerman et al. (2006) Sugerman et al., B. E. K. 2006, Science, 313, 196
- Van Dyk et al. (2006) Van Dyk, S. D., Li, W., & Filippenko, A. V. 2006, PASP, 118, 351
- Walker & Suntzeff (1991) Walker, A. R. & Suntzeff, N. B. 1991, PASP, 103, 958
- Wang (2005) Wang, L. 2005, ApJ, 635, L33
| Obs Date | Age | 50% H | 50% H | Ra | Ia |
|---|---|---|---|---|---|
| (UT) | (days) | (Å) | (Å) | (mag) | (mag) |
| 2004 August 20 | 661 | 6499.9 | 6618.8 | 19.87 | 18.98 |
| 2004 October 8 | 710 | 6497.2 | 6620.8 | 19.91 | 19.01 |
| 2004 December 11 | 774 | 6499.6 | 6625.5 | 19.97 | 19.13 |
| 2005 August 4 | 1010 | 6498.9 | 6619.6 | 20.15 | 19.35 |
| 2005 October 4 | 1071 | 6500.2 | 6623.2 | 20.15 | 19.40 |
| 2006 July 18 | 1358 | 6497.9 | 6621.1 | 19.60 |
| Star Nbr. | V | R | I | |||
|---|---|---|---|---|---|---|
| (mag) | (mag) | (mag) | (mag) | (mag) | (mag) | |
| 101 | 20.31 | 0.03 | 19.35 | 0.04 | 18.42 | 0.05 |
| 102 | 18.71 | 0.02 | 18.07 | 0.02 | 17.46 | 0.03 |
| 103 | 20.14 | 0.01 | 19.23 | 0.02 | 17.71 | 0.02 |
| 104 | 20.89 | 0.03 | 20.30 | 0.07 | 19.65 | 0.10 |
| 105 | 19.95 | 0.02 | 19.41 | 0.02 | 18.84 | 0.04 |
| 106 | 17.82 | 0.01 | 17.37 | 0.01 | 16.88 | 0.02 |
| 107 | 20.54 | 0.03 | 20.02 | 0.05 | 19.46 | 0.08 |
| 108 | 20.11 | 0.02 | 19.56 | 0.01 | 19.03 | 0.04 |
| 109 | 18.15 | 0.01 | 17.42 | 0.01 | 16.80 | 0.01 |
| 110 | 19.80 | 0.01 | 19.07 | 0.00 | 18.40 | 0.01 |
| 111 | 17.38 | 0.01 | 16.92 | 0.01 | 16.43 | 0.01 |
| 112 | 20.74 | 0.02 | 20.39 | 0.02 | 20.02 | 0.03 |
| 113 | 20.53 | 0.01 | 19.77 | 0.01 | 19.10 | 0.02 |
| 114 | 19.86 | 0.01 | 19.09 | 0.02 | 18.40 | 0.02 |
| 115 | 19.86 | 0.01 | 18.83 | 0.01 | 17.76 | 0.01 |
| 116 | 20.29 | 0.00 | 19.22 | 0.01 | 18.09 | 0.01 |
| 117 | 20.53 | 0.02 | 19.59 | 0.01 | 18.78 | 0.02 |
| 118 | 19.15 | 0.01 | 18.63 | 0.01 | 18.10 | 0.01 |
| 119 | 20.29 | 0.01 | 19.63 | 0.01 | 19.06 | 0.03 |
| 120 | 17.43 | 0.01 | 16.92 | 0.01 | 16.41 | 0.01 |
| 121 | 19.86 | 0.01 | 19.14 | 0.00 | 18.51 | 0.01 |
| 122 | 18.69 | 0.01 | 18.01 | 0.01 | 17.40 | 0.01 |
| 123 | 20.48 | 0.01 | 19.80 | 0.00 | 19.19 | 0.01 |
| 124 | 18.44 | 0.01 | 17.48 | 0.01 | 16.58 | 0.01 |
| 125 | 17.57 | 0.01 | 17.01 | 0.01 | 16.47 | 0.01 |
| 126 | 19.00 | 0.01 | 18.30 | 0.01 | 17.69 | 0.01 |
| 127 | 19.43 | 0.01 | 18.69 | 0.00 | 18.03 | 0.01 |
| 128 | 18.67 | 0.01 | 18.02 | 0.01 | 17.43 | 0.01 |
| 129 | 19.50 | 0.01 | 18.62 | 0.01 | 17.87 | 0.01 |
| 130 | 18.96 | 0.04 | 18.41 | 0.04 | 17.87 | 0.02 |
| 131 | 19.01 | 0.01 | 18.40 | 0.01 | 17.85 | 0.01 |
| 132 | 20.31 | 0.02 | 19.27 | 0.01 | 17.87 | 0.01 |
| 133 | 18.71 | 0.01 | 18.23 | 0.01 | 17.76 | 0.01 |
| 134 | 18.65 | 0.01 | 17.97 | 0.00 | 17.35 | 0.01 |
| 135 | 20.77 | 0.04 | 19.93 | 0.03 | 19.22 | 0.03 |
| 136 | 20.98 | 0.01 | 20.33 | 0.01 | 19.72 | 0.02 |
| 137 | 20.10 | 0.01 | 19.38 | 0.01 | 18.77 | 0.02 |
| 138 | 19.75 | 0.01 | 19.20 | 0.01 | 18.65 | 0.01 |
| 139 | 17.71 | 0.01 | 17.15 | 0.01 | 16.62 | 0.01 |
| 140 | 18.68 | 0.01 | 18.19 | 0.00 | 17.70 | 0.01 |
| 141 | 20.21 | 0.02 | 19.18 | 0.01 | 18.19 | 0.01 |
| 142 | 19.39 | 0.00 | 18.76 | 0.01 | 18.20 | 0.00 |
| 143 | 19.25 | 0.01 | 18.67 | 0.01 | 18.09 | 0.01 |
| 144 | 19.17 | 0.01 | 18.62 | 0.00 | 18.10 | 0.01 |
| 145 | 17.67 | 0.01 | 17.16 | 0.01 | 16.67 | 0.01 |
| 146 | 18.89 | 0.01 | 18.31 | 0.01 | 17.75 | 0.01 |
| 147 | 18.31 | 0.01 | 17.51 | 0.01 | 16.83 | 0.01 |
| 148 | 20.66 | 0.01 | 20.08 | 0.01 | 19.53 | 0.01 |
| 149 | 19.48 | 0.00 | 18.80 | 0.00 | 18.19 | 0.00 |
| 150 | 17.53 | 0.00 | 16.92 | 0.01 | 16.35 | 0.01 |
| 151 | 19.87 | 0.01 | 19.25 | 0.01 | 18.69 | 0.00 |
| 152 | 20.62 | 0.04 | 19.70 | 0.02 | 18.84 | 0.02 |
| 153 | 17.44 | 0.01 | 16.77 | 0.00 | 16.12 | 0.01 |
| 154 | 20.94 | 0.03 | 20.08 | 0.04 | 19.29 | 0.05 |
| 155 | 20.70 | 0.01 | 19.59 | 0.01 | 18.54 | 0.01 |
| 156 | 21.03 | 0.01 | 20.43 | 0.03 | 20.32 | 0.03 |
| 157 | 19.66 | 0.02 | 18.77 | 0.01 | 18.01 | 0.01 |
| 158 | 19.54 | 0.02 | 18.66 | 0.00 | 16.87 | 0.01 |
| 159 | 18.07 | 0.01 | 17.43 | 0.00 | 16.85 | 0.00 |
| 160 | 18.46 | 0.01 | 17.89 | 0.01 | 17.33 | 0.01 |
| 161 | 19.98 | 0.01 | 19.27 | 0.01 | 18.64 | 0.01 |
| 162 | 19.81 | 0.01 | 18.74 | 0.01 | 17.38 | 0.00 |
| 163 | 19.60 | 0.02 | 18.88 | 0.01 | 18.21 | 0.01 |
| 164 | 17.87 | 0.01 | 17.14 | 0.01 | 16.49 | 0.01 |
| 165 | 20.83 | 0.01 | 20.18 | 0.02 | 19.58 | 0.02 |
| 166 | 20.54 | 0.01 | 19.84 | 0.00 | 19.20 | 0.01 |
| 167 | 20.69 | 0.02 | 19.72 | 0.01 | 18.80 | 0.01 |
| 168 | 20.67 | 0.03 | 19.59 | 0.01 | 18.63 | 0.01 |
| 169 | 18.61 | 0.00 | 18.08 | 0.00 | 17.54 | 0.01 |
| 170 | 19.11 | 0.01 | 18.48 | 0.01 | 17.86 | 0.01 |
| 171 | 20.67 | 0.02 | 20.30 | 0.02 | 19.82 | 0.03 |
| 172 | 17.18 | 0.01 | 16.43 | 0.01 | 15.80 | 0.01 |
| 173 | 18.76 | 0.01 | 18.10 | 0.01 | 17.47 | 0.01 |
| 174 | 17.71 | 0.01 | 17.02 | 0.00 | 16.34 | 0.01 |
| 175 | 20.37 | 0.03 | 19.51 | 0.01 | 18.76 | 0.03 |
| 176 | 21.36 | 0.03 | 20.57 | 0.01 | 19.88 | 0.02 |
| 177 | 17.81 | 0.01 | 17.29 | 0.00 | 16.76 | 0.00 |
| 178 | 18.46 | 0.01 | 17.83 | 0.01 | 17.23 | 0.01 |
| 179 | 18.84 | 0.01 | 18.16 | 0.01 | 17.52 | 0.01 |
| 180 | 19.65 | 0.01 | 18.87 | 0.02 | 18.25 | 0.01 |
| 181 | 19.62 | 0.01 | 18.99 | 0.01 | 18.39 | 0.02 |
| 182 | 18.96 | 0.01 | 18.48 | 0.01 | 17.97 | 0.01 |
| 183 | 21.13 | 0.03 | 20.32 | 0.02 | 19.64 | 0.01 |
| 184 | 20.54 | 0.04 | 19.61 | 0.03 | 18.81 | 0.02 |
| 185 | 20.66 | 0.02 | 20.30 | 0.03 | 19.81 | 0.04 |
| 186 | 20.29 | 0.02 | 19.31 | 0.02 | 17.78 | 0.02 |
| 187 | 17.98 | 0.01 | 17.09 | 0.01 | 16.30 | 0.01 |
| 188 | 19.80 | 0.02 | 18.76 | 0.01 | 17.54 | 0.01 |
| 189 | 16.91 | 0.01 | 16.34 | 0.01 | 15.76 | 0.01 |
| 190 | 19.94 | 0.02 | 18.85 | 0.01 | 17.75 | 0.02 |
| 191 | 19.49 | 0.01 | 18.75 | 0.01 | 18.10 | 0.01 |
| 192 | 20.58 | 0.03 | 19.59 | 0.02 | 18.29 | 0.02 |
| 193 | 19.49 | 0.01 | 18.84 | 0.01 | 18.22 | 0.01 |
| 194 | 20.24 | 0.02 | 19.48 | 0.01 | 18.78 | 0.02 |
| 195 | 19.05 | 0.01 | 18.31 | 0.00 | 17.63 | 0.01 |
| 196 | 17.56 | 0.01 | 16.89 | 0.01 | 16.28 | 0.02 |
| 197 | 17.99 | 0.01 | 17.41 | 0.01 | 16.89 | 0.02 |
| 198 | 20.17 | 0.01 | 19.53 | 0.00 | 18.92 | 0.02 |
| 199 | 19.11 | 0.01 | 18.29 | 0.01 | 17.57 | 0.02 |
| 200 | 18.80 | 0.01 | 18.27 | 0.01 | 17.71 | 0.02 |
| 201 | 20.68 | 0.02 | 20.08 | 0.02 | 19.47 | 0.06 |
| 202 | 20.70 | 0.02 | 20.18 | 0.01 | 19.64 | 0.02 |
| 203 | 20.20 | 0.01 | 19.40 | 0.01 | 18.70 | 0.02 |
| 204 | 19.40 | 0.01 | 18.50 | 0.01 | 17.70 | 0.02 |
| 205 | 21.05 | 0.05 | 20.44 | 0.05 | 20.03 | 0.04 |
| 206 | 16.98 | 0.01 | 16.46 | 0.01 | 15.94 | 0.01 |
| 207 | 19.05 | 0.01 | 18.40 | 0.01 | 17.77 | 0.02 |
| 208 | 18.91 | 0.01 | 18.34 | 0.01 | 17.76 | 0.01 |
| 209 | 21.21 | 0.04 | 20.52 | 0.03 | 19.86 | 0.02 |
| 210 | 20.32 | 0.09 | 19.36 | 0.07 | 18.59 | 0.06 |