Changeover from Glassy ferromagnetism of the orbital domain state to long range ferromagnetic ordering in La0.9Sr0.1MnO3
Abstract
An attempt is made to resolve the controversy related to the low temperature phase (ground state) of the low-doped ferromagnetic (FM)- insulator(I) manganite through bulk magnetic measurements on La0.9Sr0.1MnO3 sample. It is shown that the FM phase, formed out of well defined transition in the low-doped system, becomes inhomogeneous with decrease in temperature. This inhomogeniety is considered to be an outcome of the formation of orbital domain state of eg-electrons having hole rich (metallic) walls separating the hole deficient (insulating) regions. The resulting complexity brings in metastability and glassy behaviour within the FM phase at low temperature, however, with no resemblance to spin glass, cluster glass or reentrant phases. It shows ageing effect without memory but magnetic relaxation shows signatures of inter-cluster interaction. The energy landscape picture of this glassy phase is described in terms of hierarchical model. Further, it is shown that this inhomogeneity disappear in La0.9Sr0.1MnO3.08 where, the orbital domain state is destroyed by self doping resulting in reduction of Mn3+ and hence eg-electrons. The ferromagnetic phase of the non-stoichiometric sample, does not show glassy behaviour. It neither follows ’hierarchical model’ nor ’droplet model’ generally used to explain glassy or inhomogeneous systems. Its magnetic response can be explained simply from the domain wall dynamics of otherwise homogeneous ferromagnet.
pacs:
75.47.Lx, 75.60.Ch, 76.60.EsI Introduction
The physics controlling the properties of low-doped manganites is a subject of intense research currently, due to the fact that magnetic ground state of these compounds continues to be a subject of controversykaw (1, 2, 3, 4, 5, 6, 7, 8, 9, 10). The physical properties exhibited by these compounds are likely to be proximate to those of other low doped transition metal oxides, like cuprates and nickelates. Lightly doped manganites show ferromagnetic insulating behaviour inspite of finite amount of hole doping indicating that these transition metal oxides (TMO) belong to a class of strongly correlated electron system and the effect of correlation among the electrons prevents the ground state from being metallic. Introduction of holes in these systems results in inhomogeneity, which divides the system into different regions having varying hole densities. Generally in these systems the kinetic and potential energies are of the same energy scale and incorporation of coulomb interaction in these regimes leads to various self organised structures, with clusters of one phase embedded in the other, a phenomenon referred as electronic phase separation (EPS).mor (11) Recent theoritical studies also highlight the role of coulomb interaction in studying the electronic inhomogeneity in manganites.vij (12) EPS either results in formation of regions having competing magnetic interactions or in self-generated clusters, interaction among which results in blockingsuni (13) or freezing mechanism (observed generally in TMO) at certain temperatures. Studies on cuprateszan (14, 15) and nickelatestra (16) have revealed a microscopic segregation of doped holes in antiferromagnetic phase into walls leading to an ordering consisting of charged domain walls that forms antiphase boundaries between antiferromagnetic domains. Studies by Tranquada et.al on La1.48Nd0.4Sr0.4CuO4 tran (17) and La1.69Sr0.31NiO4tranq (18) have revealed stripe phase order of hole and spins. La0.9Sr0.1MnO3 with x = 0.1 to 0.17 belong to the class of compound known as ferromagnetic insulator (FI). The self-organised regime observed in nickelates and cuprates is also expected in FI phase of manganite. Recent theoriesmiz (19) and experimentschoi (10) have provided evidences that orbital ordering (OO) plays an important role along with spin and charge in the insulating state of low doped manganites by controlling the eg electron mobility. Experimental results on La0.88Sr0.12MnO3end (4) indicates the transition between two ferromagnetic phases, one metallic another insulating driven by orbital ordering. It has been proposed that the OO phase might contain ferromagnetic insulating domains separated by ferromagnetic metallic wallspap (7), which raises question of stripes formation in the ferromagnetic insulating phasehot (20)
Temperature dependence of ac susceptibility and low field magnetisation of low doped LaMnO3 shows interesting magnetic behaviour. Urushibara et al.uru (21) showed that La0.9Sr0.1MnO3 is orthorhombic and undergoes a paramagnetic to ferromagnetic transition followed by a transition at low temperature accompanied with insulating behaviour. Susceptibility of ferromagnets generally varies as the inverse of demagnetisation factor and is expected to be constant at low temperature in absence of any further magnetic transition. Studies of the critical regimes in La0.875Sr0.125MnO3 revealed that the paramagnetic to ferromagnetic phase transition is accompanied by consistent critical exponents belonging to 3D Heisenberg universility class.sunil (22) However, the low temperature transition which received considerable attention in the last decade remains undetermined. The nature of this low temperature phase previously has been interpreted in terms of canted antiferromagnetic phasekaw (1). Successive structural phase transition from a high temperature pseudocubic phase to intermediate Jahn-Teller distorted orthorhombic phase and to low temperature pseudocubic phase reported in this low doped regimeark (23, 24) might be a cause of the observed behaviour. The nature of low temperature state is also reported in terms of charge localization, which is accompanied by ordering of polaronsyam (2). A field induced phase transition from a ferromagnetic metallic phase to a ferromagnetic insulating phase as reported in La0.875Sr0.125MnO3nij (3) might be responsible for the observed low temperature phenomenom. The low temperature fall in magnetisation in La0.9Ca0.1MnO3 is intrepreted in terms of domain wall pinning effect by Joy et al.joy (5). The two successive transitions with the lowering of temperature can be due to re-entrant spin glass transition.sat (25) Recent studies from neutron diffraction, small angle neutron scattering and nuclear magnetic resonance shows that the ground state of La0.9Ca0.1MnO3 consists of disordered double exchange metallic clusters that co-exists with long range superexchange based ferromagnetic insulating regions.alg (6) Hence the above reports show a wide variety of possibilities of the low temperature phase and ground state of such low doped FI manganites.
In manganites the ratio of Mn3+/Mn4+ and their distribution in the lattice plays an important role in tuning the physical properties of these systems. Generally, the amount of Mn4+ is tuned by divalent cation doping on A-site of perovskite structure but its amount can also be increased by oxidation of the stoichiometric sample resulting in a change of physical properties of the compound arising out of non-stoichiometry. The excess oxygen is accounted by an equal number of vacancies at A and B sites of ABO3 perovskites while the oxygen network in believed to be undefected.roo (26) As said earlier, investigations of low-doped manganites have revealed the formation of orbital domain state in the ferromagnetic insulating regimes.choi (10, 7) Increasing non stoichiometry, increases the Mn4+ content resulting in suppression of the OO phase with the clusters becoming more populous eventually coalescing leading to the establishment of homogeneous ferromagnetic order. Hence the metamagnetic behaviour of the OO phase is expected to decrease with the increasing nonstoichiometry. Such stoichiometry dependent behaviour is also observed in other transition metal oxides like cupratescho (15) and cobaltatessen (27) and more recently in bilayered manganite.qin (28)
In this paper, through bulk magnetization we investigate the magnetic ground state of stoichiometric La0.9Sr0.1MnO3, as its true nature is in the centre of debate. A detailed investigation of the effect of both AC and DC magnetic field on the physical properties of this compound indicates that the observed low temperature behaviour is not because of magnetic transition but due to development of an inhomogeneous phase with the reduction in temperature. The resulting self-organized regimes are of the form of orbital domains, dictated by OO, which plays an important role in defining the ground states of the compound. Increase of disorder (in form of self doping) suppresses the orbital domain state and a homogeneous ferromagnetic ordering is observed. The magnetic behaviour of the resulting non stoichiometric compound is ascribed to domain wall dynamics in a ferromagnetic matrix whereas, the orbital domains of the stoichiometric sample show glassy ferromagnetic behaviour with the glassiness arising solely due to intercluster interaction. The results are also compared with the hierarchical model.
II Sample preparation and characterization
Two polycrystalline sample La0.9Sr0.1MnO3 (S1) and La0.9Sr0.1MnO3.08 (S2) has been prepared by standard solid-state ceramic route with starting materials having purity (). Stoichiometric proportions of the starting materials La2O3, Sr2CO3 and MnO3 were mixed and heated in air at 9500C for 24hrs twice. After grinding, the powder, pellets were made and given a heat treatment of 12500C. For sample S1 the final sintering temperature is given at 14000C. Then it is annealed under nitrogen atmosphere for 36 hours. The sample S2 is annealed under oxygen atmosphere for 24 hours after the final sintering temperature of 12500C. X-Ray diffraction (XRD) was carried out using Rigaku Rotaflex RTC 300 RC diffractometer with CuKa radiation. The collected XRD pattern is analysed by the Rietveld profile refinement, using the profile refinement program by Young et al.you (29). Estimation of Mn3+/Mn4+ is done by iodometric redox titration using sodium thiosulphate and potassium iodide. AC susceptibility and dc magnetisation is done using a homemade ac susceptometerash (30) and a vibrating sample magnetometer (VSM)krs (31).
The samples S1 and S2 crystallize in orthorhombic (Pbnm) and rhombohedral structure(Rc) respectively. The samples are seen to be single phase with the goodness of fit around 1.2 for both cases. For S1 the percentage of Mn3+ and Mn4+ is respectively about 89% and 11% while that for S2 is 74% and 26% respectively.
III Results and discussions
III.1 Realization of orbital domain state in stoichiometric (S1) sample
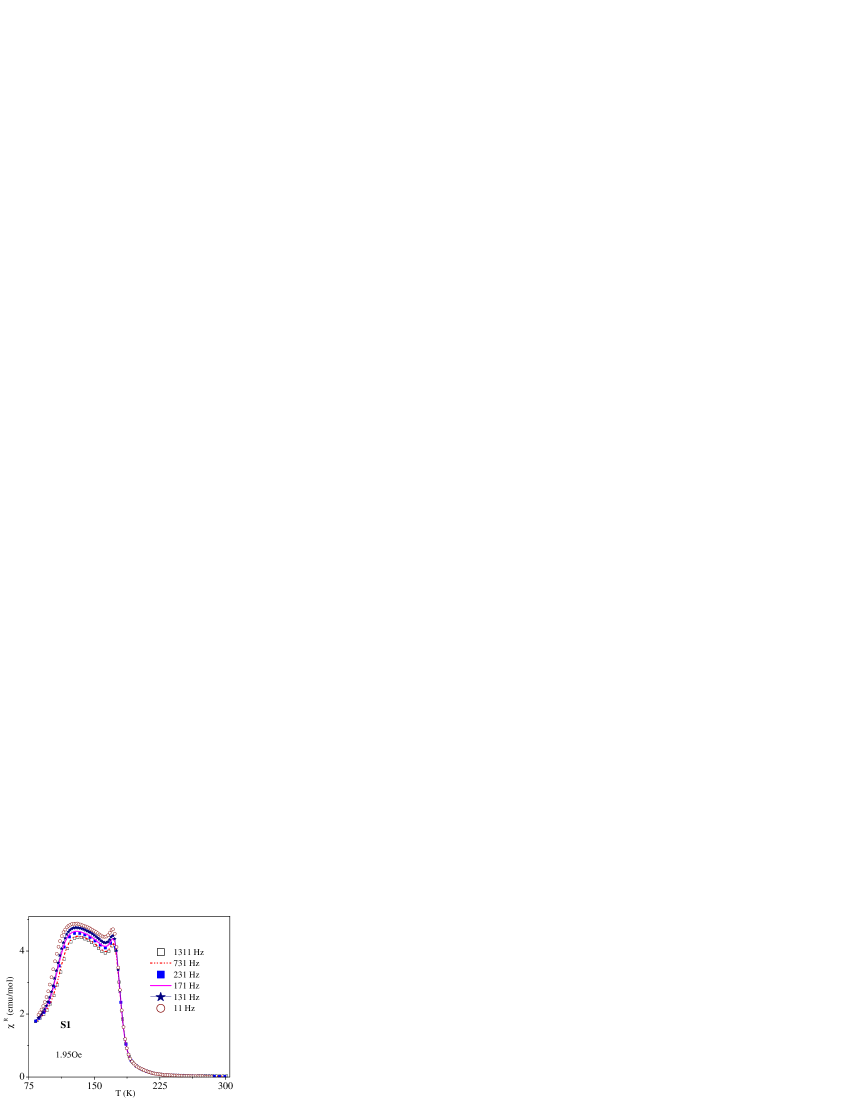
Fig.1 shows the frequency dependence of real part (R) of ac susceptibility. The fall in susceptibility at lower temperature is also observed when measurement are done on a single crystals of La0.9Sr0.1MnO3 and La0.875Sr0.125MnO3sunil (22). The temperature variation of R shows paramagnetic to ferromagnetic transition around 175K followed by a hump and the imaginary part (I) also shows a peak and a fall at lower temperature. AC- is seen to be frequency dependent below Tc with R decreasing as frequency is increased, normally observed in metastable system like spin glasses, cluster glasses, superparamagnets, re-entrant systems etc. However, there is no shift in temperatures of the peaks with frequency for R and I. A frequency dependent peak, which shifts toward higher temperatures with increasing frequency is a characteristic features of the dynamics of spin glass system and is also observed in other manganite samples which shows cluster glass like behaviourfre (32). This observation rules out any spin glass like dynamics, superparamagnetic or cluster glass type behaviour in the low temperature region.
Reports in literatureark (23) shows the presence of a low temperature structural transition in this compound. This results in changed occupancy of orbitals by eg electron due to change of lattice constant leading to reformation of domains with larger number of domain walls. Sr2+ substitution results in inhomogeneous distribution of Mn3+ and Mn4+ with Mn4+ concentration around the divalent ionshi (33), resulting in formation of clusters. These clusters break into smaller pieces due to low temperature structural transition leading to segregation of charge, making the low temperature phase inhomogeneous. The reformation of domains taking place leads to enhance wall number, which are pinned to the new structure. Hence the dynamic response of the spin decreases with decreasing temperature, as the low field is not sufficient to activate the pinned walls resulting in the observed fall in susceptibility. Hence, the resulting self-organized regimes in the form of clusters of various sizes makes the low temperature region of the sample metastable.
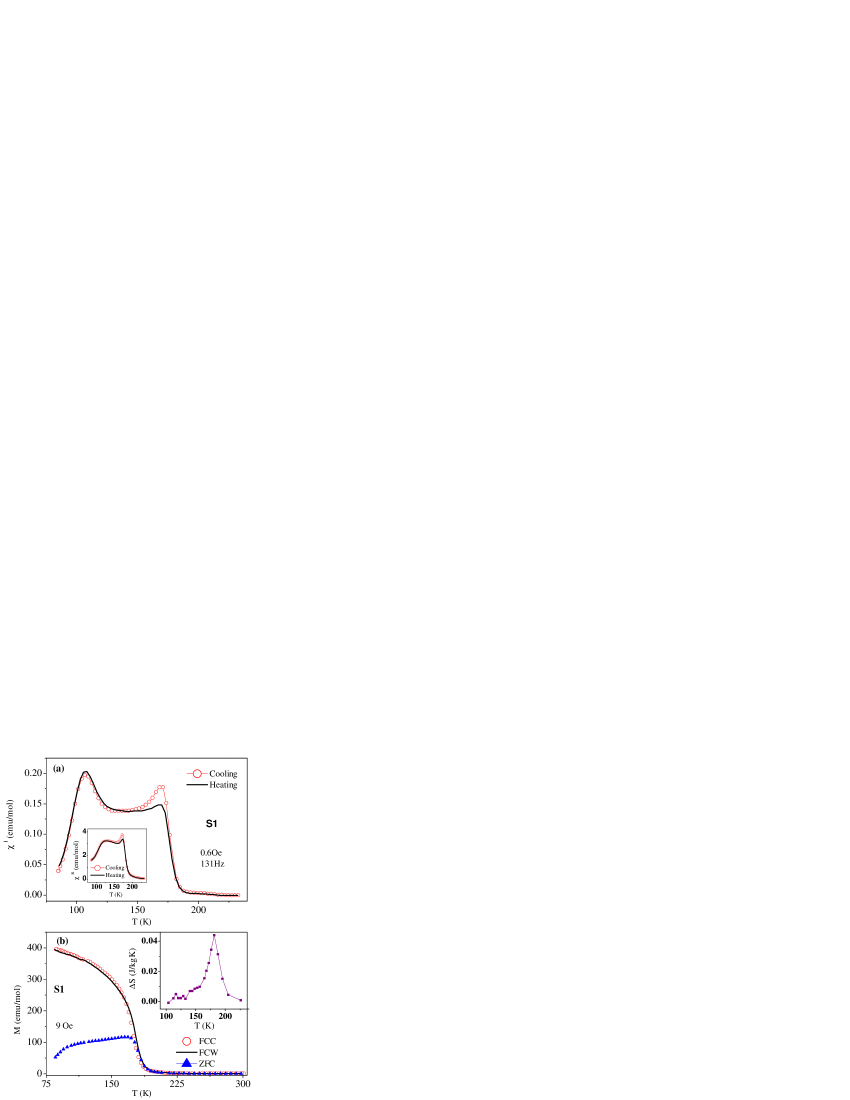
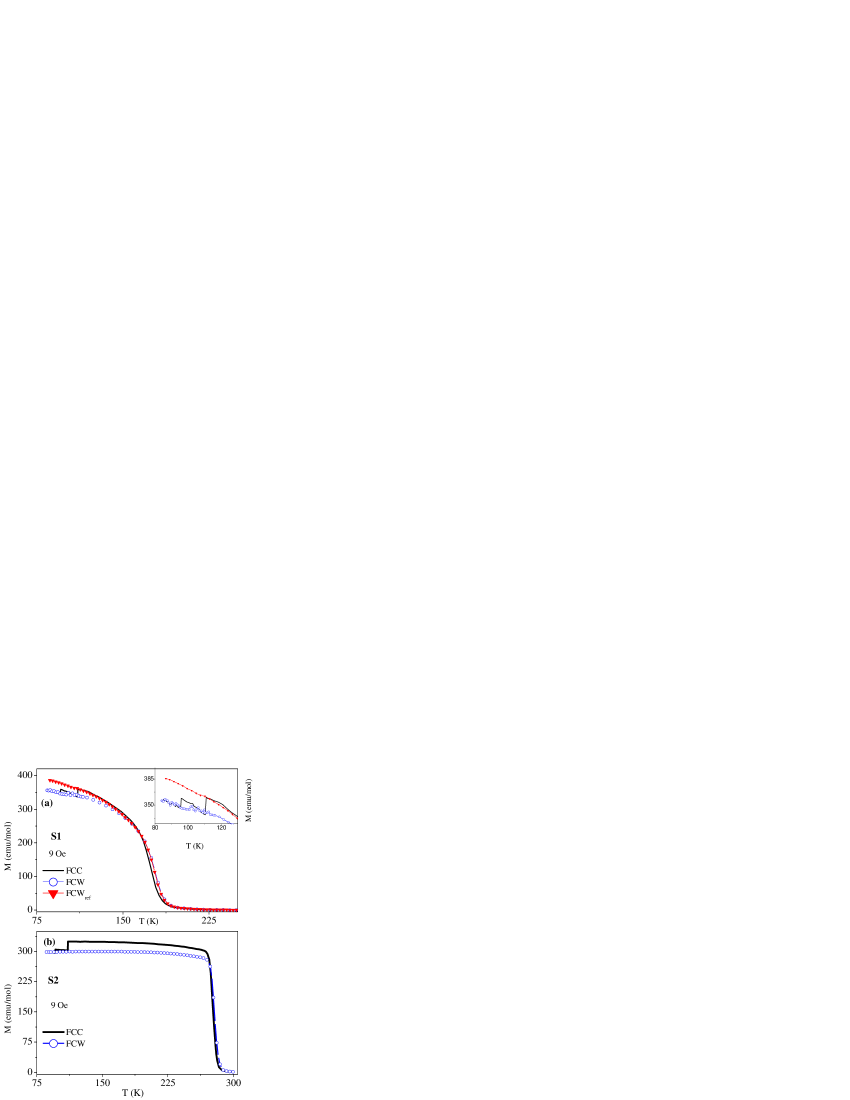
To further emphasize the fact that magnetic transition is absent in the low temperature region thermal cycling in both ac and dc magnetisation is done. The presence of thermal hysteresis is a general phenomenon associated with first order phase transition (FOPT). The susceptibility curve both (R and I) doesn’t show thermal hysteresis around the region where the fall in observed(Fig 2a and its inset). Fig 2b show Field Cooled Cooling (FCC) and Field Cooled Warming (FCW) cycles of DC Magnetisation (DCM). Unlike the Zero Field Cooled Magnetisation (ZFCM) case, the field cooled magnetisation rises continuously with decreasing temperature. The graph also shows absence of thermal hysteresis throughout the temperature range between FCC and FCW. These observations rule out any ferromagnetic to antiferromagnetic FOPT in the low temperature region of the compound. To substantiate the above fact Magneto-Caloric Effect (MCE) measurement is done on the sample (shown in inset of Fig 2b). The entropy change, calculated from MH isotherm at different temperature shows a peak around Tc with absence of any significant peak a lower temperature region. This also indicates absense of FM-AFM transition at lower temperature as a peak in MCE is expected around the transition. Hence the low temperature phase, as seen from thermal hysteresis in magnetisation and MCE measurement is different from the metastable state arising from standard first order transition between competing ferromagnetic and antiferromagnetic phases where near the transition a short-range correlation of one of the two phases start building up at the cost of other.
Hence the above measurements indicate absence of antiferromagnetic transition, spin glass dynamics or cluster glass like behaviour in the low temperature region, and brings out the novel role of orbitals for explaining the observed features of the sample. The presence of low temperature structural transition in this compound leads to orbital rearrangement, resulting in orbital degree of freedom of eg playing the central role in defining the ground state properties. So, absence of antiferromagnetic state along with insulating behaviour of the transport which shows a slope change around Tcuru (21) (due to decrease in the value of resistivity), indicates the coexistence of ferromagnetic metallic and ferromagnetic insulating phase at low temperatures. The insulating behaviour of the ferromagnetic phase is explained in terms of antiferro (AF)-type orbital ordering, which leads to elongation and compression of the neighboring MnO6 octahedrons resulting in unequal Mn-O bond distances. According to Goodenough’s theory of semicovalencegoo (34) the magnetic coupling will be ferromagnetic when the Mn-O bonds are semi covalent leading to ferromagnetic super exchange interaction. Such type of magnetic coupling in similar compounds is also reported in literature nij (3, 4, 35). Hence the low temperature phase is an electronically and hence magnetically inhomogeneous state consisting of hole poor and hole rich regions. So, an orbital domain state with ferromagnetic insulating domain separated by ferromagnetic metallic wall as observed from NMR measurements in La0.8Ca0.2MnO3 pap (7) is also realised in our case.
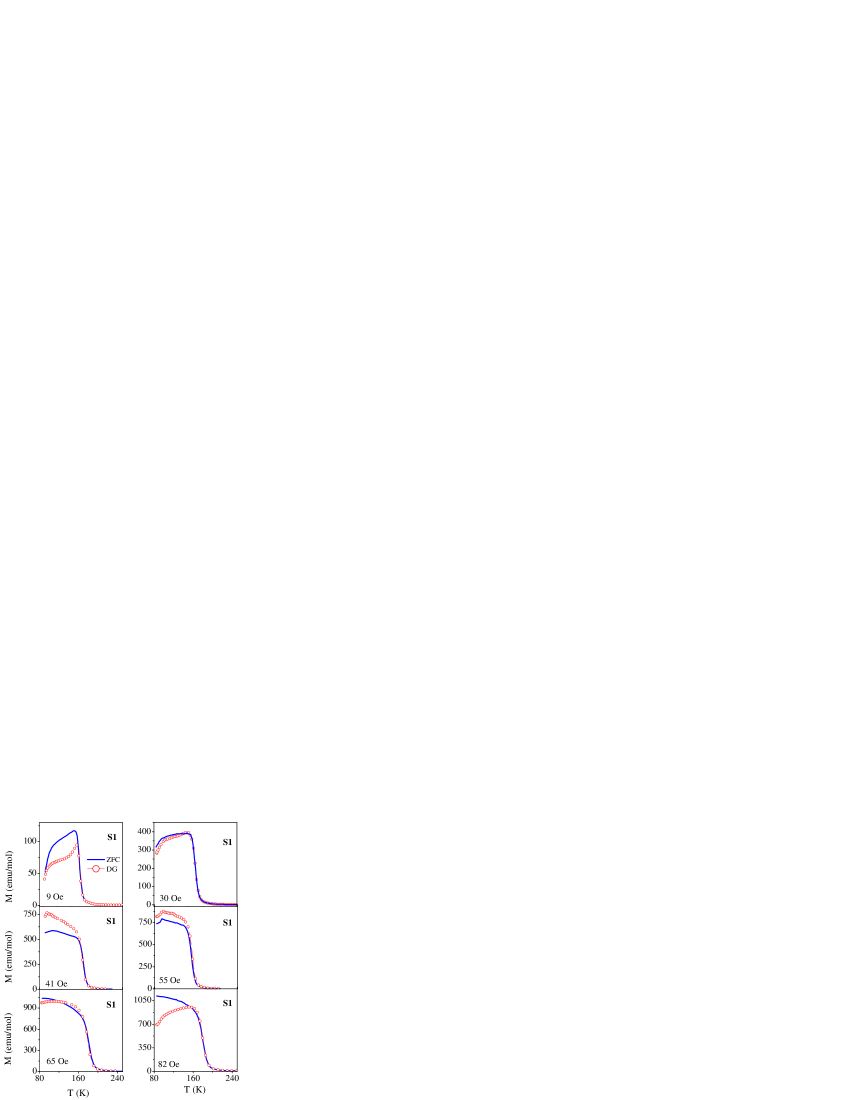
Orbital domains realized in the sample make the low temperature region metastable resulting in a non-equilibrium state where reformation of domains takes place. To probe the energy landscape in this regions degaussing (DG) experimentjoy (5) is done at different DC fields. Such demagnetisation based studies is considered to give a systematically better approximation of the ground state of disordered systems as reported in Refzar (36). In DG measurements, after ZFC to 85K, 1000Oe field is applied and then it is reduced to zero. Application of the field disturbs the ground state spin arrangement and results in some remanent magnetization. The remanent magnetization is reduced to zero by repeated field cycling with reducing amplitude (degaussing). Then the measuring field is applied at 85K and temperature response of magnetization is noted while warming. Fig. 3 shows the M-T curves in different measuring fields for degaussed, as well as the corresponding ZFC states. At 9Oe the degaussed curve obtained below the normal ZFC curve while for 30Oe the bifurcation between the curves reduces. At 41Oe the DG curve is above the normal ZFC curve. Again, the seperation between the curves decreases at 55Oe and there is a crossover at 65Oe.At 82Oe the degaussed curve is well below normal ZFC curve. The observed behaviour arise due to the fact that the normal ZFC and degaussed state are different in terms arrangement and size of domains even though the net dipole moment is zero in zero field (before the measuring field is applied). At 85K when a high field is applied it results in formation of large domains, which are broken into smaller pieces by external perturbation (degaussing). Hence the resultant domain size and arrangement are different from that obtained for normal ZFC at 85K. So when measuring field is applied after ZFC and DG, it lead to different domain size for each case resulting in the observed difference in temperature response of magnetization between them. This behaviour vividly demonstrate inhomogeneous nature of magnetic state, which is not in equilibrium due to reformation of domains. Many metastable configurations are present within which the wall can make thermally activated hops. When the sample is degaussed after a high field was applied, it results in formation of the subvalleys with the moments being locked in certain regions and directions. So measurement at different DC field after degaussing shows different behaviour for each field when compared with normal ZFC measurements indicating a hierarchical organization of energy landscapelef (37) which is discussed in details later.
III.2 Suppression of orbital domains and establishment of ferromagnetic long-range order by non stoichiometry in S2 sample
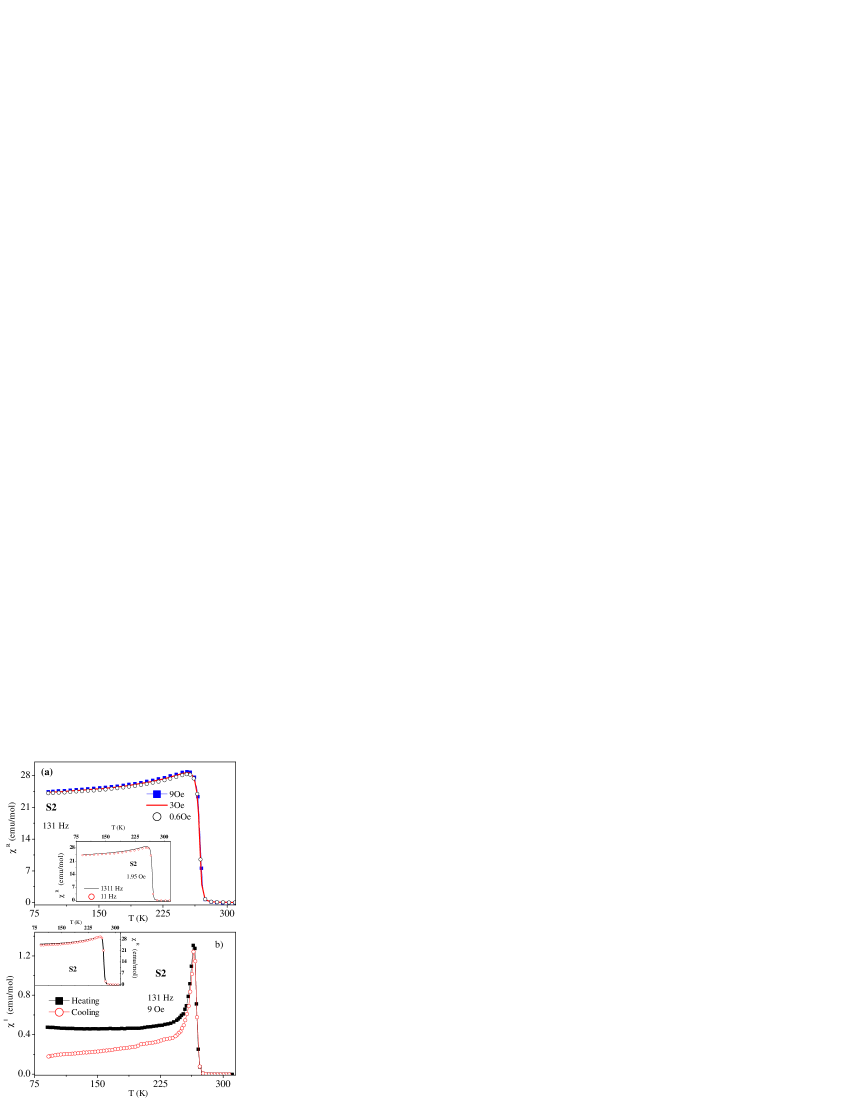
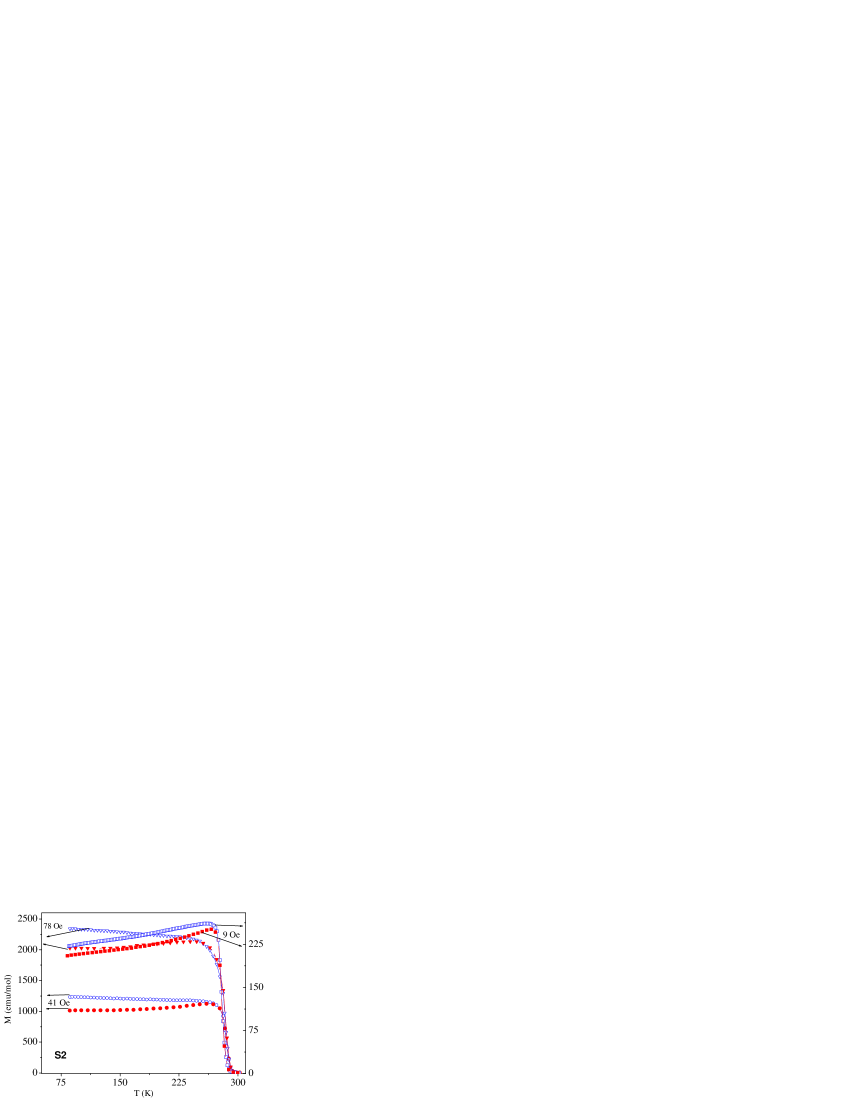
Fig 4a, shows the temperature dependence of R in different fields of S2 sample. It clearly shows paramagnetic (PM) to ferromagnetic transition (FM) with the absence of any further transition at low temperature. Absence of strong field dependence indicates the presence of long range ferromagnetic ordering where domain wall dynamics in an infinite ferromagnetic matrix plays a significant role in defining physical properties of the compound. More vivid manifestation of the role of the walls is emphasized in the inset of Fig. 4a, which shows the frequency dependence of R. Increase in R with the increasing frequency, an intriguing aspect because it is expected R to decrease with the increasing frequency, as observed for metastable systems. In general, the wall distributions for these types of samples is not in equilibrium and are located in position corresponding to the local potential minima around pinning centers and oscillate around these metastable position in response to small AC field. Time dependence measurement of susceptibility performed on LaMnO3.075 shows that R decreases with time faster for lower frequencies than at higher frequencies below Tc.mur (38) This implies walls in a given time stabilize more for a lower frequency than for higher frequency. Moreover the energy of excitation by the of AC field is proportional to the square of its frequency. So higher frequency might provide extra perturbation to the pinned walls for depinning, resulting in larger response of spins with increasing frequency. Hence, the observed field and frequency dependence are quite in contrast to that of S1 where systematic frequency and strong field dependence is observed which is ascribed to the distribution of cluster size with the whole clusters being affected by field and frequency change.
To further highlight the role of the domain wall in S2, thermal hysteresis (TH) in AC- is performed.The PM to FM transition is second order in nature and hence it is expected that TH to be absent. TH is not observed in R (inset of Fig 4b) as it is dominated by the volume response of the domains and is much less sensitive than imaginary part (I) to the domain wall dynamics. However, a clear difference is seen in the heating and cooling cycle of I (Fig 4b) which arises out of domain wall motion in the low field regime. The difference in temperature cycle of I (which corresponds to the magnetic losses) indicates thermally irreversible domain wall dynamics due to low field irreversible domain wall pinning in the sample. The TH in I disappears (not shown) in presence of superimposed DC field as the superimposed field is expected to suppress the wall dynamics, emphasizing the above fact that the observed hysteresis is due domain wall motion.
Degaussing (DG) measurements performed on the S2 sample shows no change in nature of temperature response of magnetization at different DC fields between the normal curve and the curve noted after degaussing (Fig 5), with the DG curve always lying below the normal curve. The difference between the curves (Fig 3 vs. Fig 5) substantiates the fact that the observed features of S2 is only due to the wall dynamics unlike S1 where the domains as a whole is affected by the above protocol.
Hence, even though both the samples show ferromagnetic behaviour, there is a changeover from an orientationly random cluster arrangement of the S1 sample into a homogeneous ferromagnetic ordering for the S2 sample. Hence it may be considered that S1 sample is constituted of magnetic clusters which are in a metastable state. The interaction among the clusters results in a glassy state which is responsible for non equilibrium nature of the low temperature region. The S2 sample consists strongly coupled regions of equilibrated domains whose once developed correlation are hard to destroy when the temperature is changed. Such behaviour is similar to that of low-doped cuprates where there is a competition between the striped and superconducting phase with the change in oxygen stoichiometry.cho (15)
III.3 Observation of glassy ferromagnetism in S1 sample and stable ferromagnetism in S2 sample
As stated earlier, the orbital domain state realized in S1 sample results in segregation of charge making the low temperature region inhomogeneous. To further substantiate the inhomogeneous nature and also to get a better insight about the underlying nature of low temperature magnetic ground state of the compound, time dependent magnetization studies under various heating and cooling protocols have been performed. Fig. 6a shows one such protocol under field cooled cooling and warming condition. Here the temperature response of magnetisation is noted during field cooled cooling (FCC) from room temperature in 9Oe magnetic field with temporary stops at 110K and 95K for a waiting time 7200sec. During the waiting time the field is switched off. After each stop at wait temperatures the field is re-applied and cooling is restarted. Field cooled warming (FCW) curve is noted immediately after the cooling cycle. Decay in magnetization (ageing affect) is observed at the wait temperatures in FCC mode. Instead of memory of aging, significant fluctuation in magnetization obtained in the warming cycle upto 115K. To crosscheck the fluctuation, immediately after the warming cycle the sample is again cooled in 9Oe from room temperature to 85K without any stop and a field cooled warming (FCW) measurement is done. In this case the FCW curve (FCWref in Fig. 6a) is smooth with absence of any fluctuation indicating that the fluctuation is intrinsic to the sample and is not because of the measuring instrument. It may be noted that in ferromagnetic phase, memory effect is absent during re-heating as it is erased by growth of ferromagnetic domains whereas for a spin glass phase memory of aging can be observed during heatingvin (39). Hence absence of memory in our case rules out coexistence of spin glass behaviour with ferromagnetic state (i.e. re-entrant spin glass phase) at lower temperature. In FCC measurement with stopping it is seen that ageing makes the system stiffer with time resulting in lesser response of the spins with field. Fluctuation obtained in the field cooled warming run indicates that domain wall jumps, as the temperature is sweptmur (38). Actually the material being inhomogeneous randomly distributed pinning centres prevent the domain wall from establishing the equilibrium position. Hence the above measurements give definite evidence that the low temperature region of the compound is inhomogeneous and is not in a state of global minimum.
The above ageing measurement performed on S2 sample is shown in Fig 6b. Ageing effect is observed at the wait temperatures 110K and 95K with the effect being more prominent at the higher temperature.This indicates waiting at 110K lead to stabilization of dynamics of the domain walls resulting in lesser prominence of the effect at 95K. During the warming cycle no memory effect of the wait temperatures is observed, as expected in a ferromagnetic phase. Also, absence of magnetic fluctuation in warming cycle indicates the stable nature of the low temperature phase of this sample as compared to that of S1.
To further investigate the effect of ageing, wait time (tw) dependence of ZFC TRM of both the samples is studied. Fig 7a. shows M vs. t measured with different tw =1800s, 7200s, 10800s before the application of magnetic field at 95K. As observed, magnetization clearly depends upon the wait time with M value decreasing with the increasing tw for S1 sample. The behaviour is obvious, as with increasing tw the system becomes stiffer as if the system sinks in deeper and deeper energy valley as time elapses resulting in lower value of the measured M. In contrasts, even though ageing is observed for the S2 sample M vs. t behaviour is independent of tw (inset of 7a) as this sample is more ordered than S1.
For gaining further insight about the underlying nature of the magnetic phase of the samples low field thermoremanent magnetisation measurements are performed. Fig 7b shows the time dependence of magnetisation (TRM) of the S1 sample at different temperature under field cooled (FC) conditions. For each case the sample is cooled from 250K in 9Oe to the measurement temperature where after waiting for 2min the field is switched off and magnetisation decay is noted. Among the various functional form that have been proposed to describe the change of magnetisation with time, the one proposed by Ulrich et al.ulr (40)
M0t-γ….(1)
gave good results of fits, while the other functional form yielded unphysical value of constants with large error bars. In the equation M0 is related to intrinsic ferromagnetic component and exponent depends on strength of magnetic interaction. The values of the parameters for S1 are complied in Table 1. As expected the value of M0 increases with the decreasing temperature as field cooled magnetisation value increases with decreasing temperature but decreases upto 114K and then increases again.
| T(K) | M(emu/mol) | (10-3) |
|---|---|---|
| 85 | 368.40.15 | 8.90.06 |
| 95 | 322.50.1 | 4.00.05 |
| 105 | 299.80.1 | 3.50.07 |
| 114 | 287.60.07 | 3.40.04 |
| 125 | 280.20.17 | 7.70.01 |
| 141 | 245.30.15 | 8.00.04 |
Generally for glassy systems the exponent () lies between 0 and 1 and also, in our case the value of lying between the mentioned limits indicating a weak intercluster interaction. For spin glasses or a system of interacting particles with fixed size and concentration is expected to be constant with temperature. The variation in the value of as observed is ascribed to the variation of cluster size with temperature indicating the cluster size is very fragile to temperature change. This indicates a distribution of potential barrier over which the cluster magnetization tends to relax.The value of being lower around 105K-114K is also another signature of the occurrence of orbital rearrangements in the sample.
For S2 sample, ZFC TRM measurements are done where the field is turned on at the measuring temperature after cooling it from room temperature (Fig 7c). After the field is switched on magnetization shows a sudden increase in value followed by a very slow increase over the measurement time. TRM (normalized with respect to M value at t=0) at different temperature almost superimposes on each other indicating that the relaxation at different temperature is almost the same. Good results are not obtained when the curves are fitted by the available functional form that have been proposed to describe the change of magnetization with time indicating the growth is neither exponential nor logarithmic.
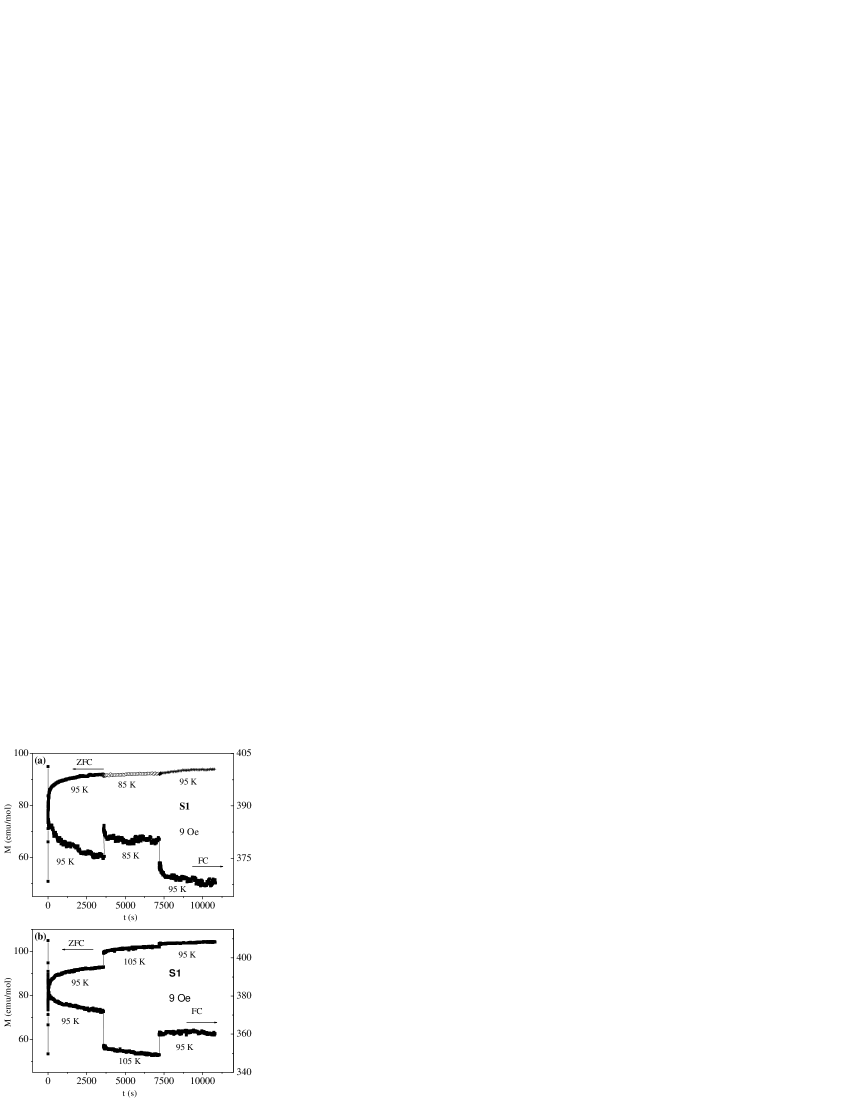
The nature of the phase in regions where non equilibrium glassy behaviour is observed is generally described either in terms of droplet modelfish (41) or in terms of hierarchical model. The droplet model introduce the concept of overlap length (LΔT), which determine the maximum length scale at which the spin correlation at two different temperatures (the temperatures being less than spin glass transition temperature) are the same. This characteristic length for the group of spins only at distances larger than LΔT is sensitive to small temperature changes. Thus restart of domain growth is observed from the size LΔT not only after cooling but also after heating implying a symmetrical behaviour with respect to positive/negative temperature cycle. In this model it is believed that, at any given temperature below spin glass transition, there is only one phase (and its spin reversed counterpart) to be considered. Hence it can be said, that the energy landscape in this case is dominated by one large valley unlike for hierarchical model, where a multi valley structure is hierarchically organized on the free energy surface. Here the free energy landscape consists of many local minima corresponding to metastable configuration, which splits into new state when temperature decreases and merges back when the temperature is raised. Hence hierarchical picture predicts that relaxation is fully initialized on heating implying a non symmetrical behaviour with respect to heating and cooling unlike the droplet model. Hence a series of TRM measurement with temperature change as proposed by Sun et al.sun (42) is performed to associate the energy distribution at low temperature phase of the samples with one of the above defined model. The relaxation measurement for sample S1 is shown in Fig 8a. The sample is cooled from 240K to 95K in 0Oe/9Oe field. At 95K after waiting for 120sec the field was switched on/off and magnetisation is noted for time t1 = 1hour. The sample was then cooled in constant/ zero field to 85K and TRM is measure for time t2 = 1hour. Then the sample was heated back to 95K in constant/zero field and TRM was measured for time t3 = 1hour. For the ZFC case, during t1 the curve shows an immediate rise followed by steady growth after the field is switched on. During temporary cooling the relaxation is weak. Again when the temperature is raised to 95K the magnetisation start from the value it reached at the end of t2 indicating absence of reinitialization after the cooling cycle. For the FC case, magnetisation shows an immediate fall followed by steady decay after the field is switched off. During temporary cooling magnetisation start from a higher value but the relaxation is weak. During t3 the relaxation curve starts from a level which is near to the value reached at the end of t1. Fig 8b shows the above protocol in the heating cycle where the relaxation curves are noted at 95K, 105K and 95K for time t1, t2 and t3 (one hour each) respectively. Every time the starting value of magnetisation is different from the value it reached at the end of previous TRM measurement. Hence, a clear reinitialization in the relaxation is observed during temporary heating in both ZFC and FC cases. Therefore it can be said that there is an antisymmetric response with respect to positive and negative temperature change in TRM measurement in both ZFC and FC process which favours a hierarchical picture of energy landscape in the low temperature region which have also been suggested in the earlier section. Interestingly, such picture of energy landscape has also been proposed for many compound like interacting magnetic nanoparticle systemsun (42), re-entrant systemsvin (39) etc. The collective interactions of the self-generated assembly of clusters in the low temperature ferromagnetically inhomogeneous phase in our case may give rise to a glassy magnetic behaviour which constitute a new class of glass different from conventional spin glass as also reported in Ref riv (43).
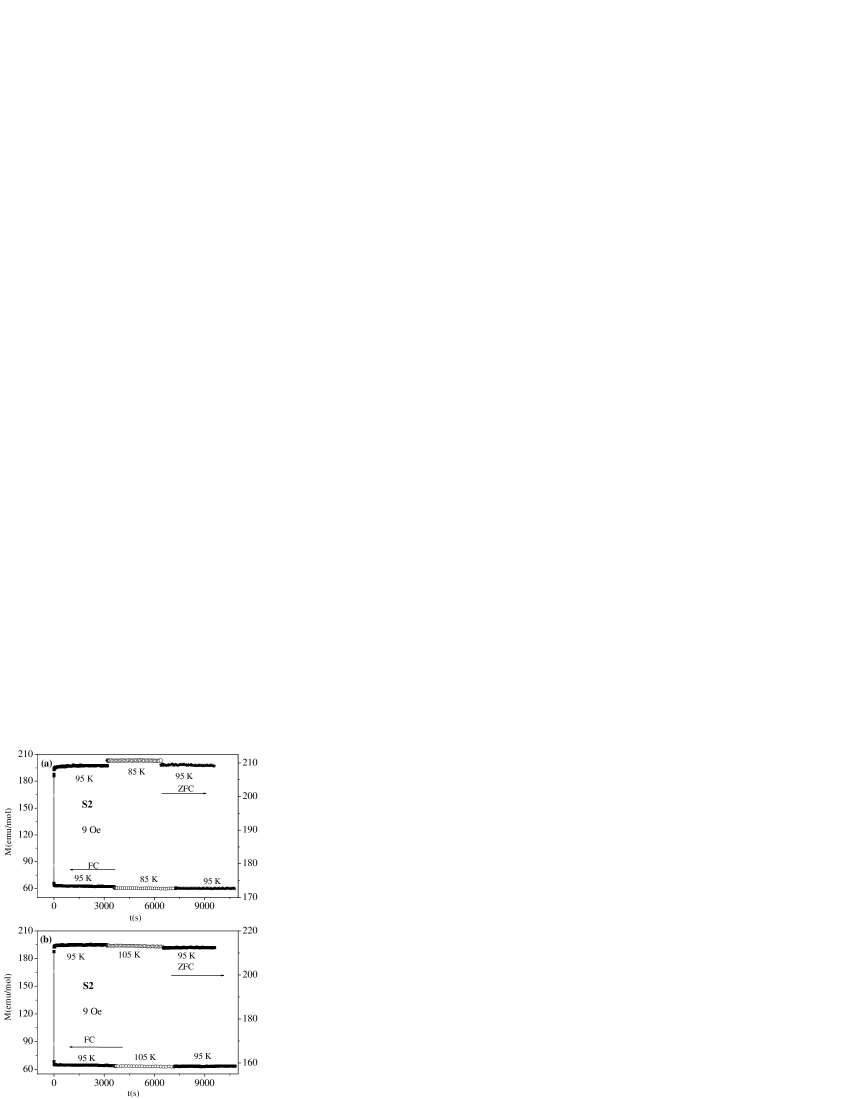
The above procedure is performed for sample S2 by cooling it from room temperature as shown in Fig 9a and 9b. In this case the change of magnetisation with time is very small and the observed minor change in relaxation behaviour during t2, t3 is only due to change in magnetisation value with temperature change. So the energy landscape of magnetic phase of S2 cannot be ascribed to any of the above models.
IV Conclusion
In summary, we have tried to solve the controversy related to the magnetic ground state of in low doped manganite systems through bulk magnetic measurements on La0.9Sr0.1MnO3. Such systems show a well defined paramagnetic-ferromagnetic transition with the decrease in temperature which falls into the isotropic 3D Heisenberg universality class. However, with further decrease in temperature there is a sharp change in magnetic susceptibility which is attributed to inhomogeneous ferromagnetism. This inhomogeneity is considered to be arising from the formation of orbital domain state (comprising of ferromagnetic insulating domains separated by ferromagnetic metallic walls) resulting from a discontineous change of lattice parameters at low temperature. This self organised regimes show metastability which is different from that arising from broad first order phase transitions. It is clearly shown that the low temperature phase shows glassy behaviour which is different from conventional spin glass, cluster glass or dynamics observed in reentrant systems. This glassy phase shows ageing affect but no memory and the energy landscape of the degenerate ground state follows the picture of hierarchical model.
To conclusively assert the fact that the orbital degrees of freedom of the eg-electrons plays an important role in defining the ground state of the system, non-stoichiometry is introduced. Disorder in form of self doping reduces the Mn3+ and hence eg-electrons by 17% in the La0.9Sr0.1MnO3.08 sample. This leads to complete destruction of orbital domain state of the stoichiometric sample resulting in homogeneous ferromagnetic ordering. The ferromagnetic phase of this non-stoichiometric sample does not show glassy behaviour and the energy landscape picture of the sample is neither in accordance with hierarchical model or droplet model. Further studies on stoichiometric sample in terms of coupling of spin, orbitals with lattice degrees of freedom and their dynamics will be useful in understanding the observed unusual glassy behaviour of the system. These studies will be important in establishing analogy between self-organised regimes of low doped manganites with that of cuprates and nickalates.
V Acknowledgement
We are grateful to Dr. P. Chaddah for many fruitful discussions. We are thankful to Mr. K. Kumar and Mr. A. K. Pramanik for help rendered during the course of measurement. KM acknowledges CSIR, India for financial support.
References
- (1) H. Kawano, R. Kajimoto, M. Kubota and H. Yoshizawa Phys. Rev. B 53, 2202 (1996).
- (2) Y. Yamada, O. Hino, S. Nohdo, R. Kanao, T. Inami and S. Katano Phys. Rev. Lett. 77, 904 (1996)
- (3) H. Nojiri, K. Kaneko, M. Motokawa, K. Hirota, Y. Endoh and K. Takahashi Phys. Rev. B 60, 4142 (1999)
- (4) Y. Endoh, K. Hirota, S. Ishihara, S. Okamoto, Y. Murakami, A. Nishizawa, T. Fukuda, H. Kimura1, H. Nojiri, K. Kaneko, and S. Maekawa Phys. Rev. Lett. 82, 4328 (1999).
- (5) P. A. Joy and S. K. Date, J. Magn. Magn. Matter. 512, 196 (2000)
- (6) P. A. Algarabel, J. M. De Teresa, J. Blasco, M. R. Ibarra, Cz. Kapusta, M. Sikora, D. Zajac, P.C. Riedi and C. Ritter Phys. Rev. B 67, 134402 (2003)
- (7) G. Papavassiliou, M. Pissas, M. Belesi, M. Fardis, J. Dolinsek, C. Dimitropoulos, and J. P. Ansermet Phys. Rev. Lett. 91, 147205 (2003).
- (8) R. Kajimoto, H. Mochizuki, H. Yoshizawa, S. Okamoto, and S. Ishihara Phys. Rev. B 69, 054433 (2004)
- (9) J. Geck, P. Wochner, S. Kiele, R. Klingeler, P. Reutler, A. Revcolevschi, and B. Buchner Phys. Rev. Lett. 95, 236401 (2005).
- (10) K.-Y. Choi, Yu. G. Pashkevich, V. P. Gnezdilov, G. G ntherodt, A. V. Yeremenko, D. A. Nabok,V. I. Kamenev, S. N. Barilo, S. V. Shiryaev, A. G. Soldatov and P. Lemmens Phys. Rev. B 74, (2006) 064406.
- (11) Adriana Moreo, Seiji Yunoki, and Elbio Dagotto Science. 283, 2034 (1999)
- (12) Vijay B. Shenoy, Tribikram Gupta, H. R. Krishnamurthy and T. V. Ramakrishnan Phys. Rev. Lett. 98, 097201 (2007)
- (13) Sunil Nair and A. Banerjee Phys. Rev. Lett. 93, 117204 (2004).
- (14) Jan Zaanen and Olle Gunnarsson Phys. Rev. B 40, 7391 (1989).
- (15) J. H. Cho, F. C. Chou, and D. C. Johnston Phys. Rev. Lett. 70, 222 (1993).
- (16) J. M. Tranquada, D. J. Buttrey, V. Sachan, and J. E. Lorenzo Phys. Rev. Lett. 73, 1003 (1994).
- (17) J. M. Tranquada, J. D. Axe, N. Ichikawa, Y. Nakamura, S. Uchida and B. Nachumi Phys. Rev. B 54, 1003 (1996)
- (18) J. M. Tranquada, K. Nakajima, M. Braden, L. Pintschovius and R. J. McQueeney Phys. Rev. Lett 88, 075505 (2002).
- (19) T. Mizokawa, D. I. Khomskii and G. A. Sawatzky Phys. Rev. B 61, R3776 (2000)
- (20) T. Hotta, Adrian Feiguin and Elbio Dagotto Phys. Rev. Lett. 86, 4922 (2001) .
- (21) A. Urushibara, Y. Moritomo, T. Arima, A. Asamitsu, G. Kido and Y. Tokura, Phys. Rev. B 51, 14103 (1995)
- (22) Sunil Nair and A. Banerjee Phys. Rev. B 68, 132404 (2003)
- (23) V. E. Arkhipov, V. S. Gaviko, A. V. Korolyov, V. E. Naish, V. V. Marchenkov, Ya. M. Mukovskii, S. G. Karabashev, D. A. Shulyatev and A. A. Arsenov J. Magn. Magn. Matter.196, 539 (1999).
- (24) H. Kawano R. Kajimoto, M. Kubota and H. Yoshizawa, Phys. Rev. B 53, 14709 (1996)
- (25) T. Sato, T. Ando, T. Ogawa, S. Morimoto and A. Ito Phys. Rev. B 64, 184432 (2001)
- (26) A. M. Van Roosmalen, E. H. P. Cordfunke, R. B. Helmholdt and H. W. Zandbergenet al. J.Solid State Chem. 110,100 (1994)
- (27) M. A. Senaris- Rodriguez and J. B. Goodenough J. Solid State Chem. 118,323 (1995)
- (28) Qing An Li, K. E. Gray, H. Zheng, H. Claus, S. Rosenkranz, S. Nyborg Ancona, R. Osborn, J. F. Mitchell, Y. Chen, and J. W. Lynn Phys. Rev. Lett.98, 167201 (2007)
- (29) R. A. Young, A. Sakthivel, T.S. Moss, C.O. Paiva-Santos, User Guide To Program DBWS-9411, Georgia Institute of technology,Atlanta, (1994)
- (30) A. Bajpai and A. Banerjee, Rev. Sci. Instrum. 68,4075 (1997)
- (31) R. V. Krishnan and A. Banerjee, Rev. Sci. Instrum. 70, 85 (1999)
- (32) R.S. Freitas, L. Ghivelder, F. Damay, F. Dias and L. F. Cohen Phys. Rev. B 64, 144404 (2001) and ref therein
- (33) T. Shibata, Bruce Bunker, J. F. Mitchell and Peter Schiffer Phys. Rev. Lett.88, 207205 (2002)
- (34) J. B. Goodenough Phys. Rev. B 100, 564 (1955)
- (35) R. V. Krishnan and A. Banerjee J.Phys.: Condens. Matter 12, 3835 (2000)
- (36) G. Zarand, F. Pazmandi, K. F. Pal, and G. T. Zimanyi Phys. Rev. Lett.89, 150201 (2002)
- (37) F. Lefloch, J. Hammann, M. Ocio and E.Vincent, Europhys. Lett. 18, 647 (1992), E. Vincent, J.P. Bouchaud, J. Hammann and F. Lefloch,Philos. Mag. B 71, 489 (1995)
- (38) M. Muroi, R. Street, J.W. Cochrane and G.J. Russell, Phys. Rev. B 64, 024423 (2001)
- (39) E. Vincent, V. Dupuis, M. Alba, J.Hammann and J.P. Bouchaud, Europhys.Letts 50, 674 (2000)
- (40) M. Ulrich, Jesus Garc a-Otero, Jos Rivas, and Armin Bundeet Phys. Rev. B. 67, 024416 (2003)
- (41) Daniel S. Fisher and David A. Huse Phys. Rev. B. 38, 373 (1988);ibid 38, 386 (1988)
- (42) Young Sun, M.B. Salamon, K. Garnier and R.S. Averback, Phys. Rev. Lett. 91, 167206 (2003)
- (43) F. Rivadulla,M. A. L pez-Quintela, and J. Rivas Phys. Rev. Lett. 93, 167206 (2004)