2 University of Cologne, I. Physikalisches Institut, Cologne, Germany
3 Spitzer Science Center, Caltech, Pasadena, USA
4 Tuorla Observatory, University of Turku, Piikkiö, Finland
5 Max-Planck-Institut für Astronomie, Heidelberg, Germany
6 University of Toronto, Astronomy Department, Toronto, Canada
7 University of Leiden, Department of Astronomy, Leiden, The Netherlands
8 European Southern Observatory, Santiago, Chile
Nuclear starburst-driven evolution of the central region
in NGC 6764
Abstract
Aims. We study the CO and the radiocontinuum emission in an active galaxy to analyze the interplay between the central activity and the molecular gas.
Methods. We present new high-resolution observations of the 12CO(1–0) and 12CO(2–1) emission lines, and 3.5 cm and 20 cm radio continuum emission in the central region of the LINER/starburst galaxy NGC 6764.
Results. The galaxy has an outflow morphology in radio continuum, spatially coincident with the CO and H emission, and centered slightly off the radio continuum peak at the LINER nucleus. The total molecular gas mass in the center is about 7 , using a CO luminosity to total molecular gas conversion factor that is three times lower than the standard one. 12CO(1–0) emission is found near the boundaries of the radio continuum emission cone. The outflow has a projected expansion velocity of 25 km s-1relative to the systemic velocity of NGC 6764. About of molecular gas is detected in the outflow. The approximate location ( 1 kpc) of the dynamical inner Lindblad resonance has been derived from the rotation curve. The peak of the CO emission is slightly ( pc) offset from the peak of the radio continuum.
Conclusions. The molecular gas has most likely been ejected by the stellar winds from the recent starburst, but the CO line ratios show indication of an interaction with the AGN. The energy released by the nuclear starburst is sufficient to explain the observed outflow, even if the data cannot exclude the AGN from being the major energy source. Comparison of the outflow with hydrodynamical simulations suggests that the nuclear starburst is 3–7 Myr old and the bubble-like outflow is still confined and not freely expanding.
Key Words.:
ISM: jets and outflows — Galaxies: active — Galaxies: ISM — Galaxies Individual: NGC 6764 — Galaxies: starburst — Radio continuum: galaxies1 Introduction
The nuclear region surrounding active galactic nuclei (AGN) often has the highest level of molecular gas concentration and star formation in galaxies. The processes that drive the excitation and kinematics of the circumnuclear gas, namely, the abundant star formation and the jets and photoionisation associated with the AGN, influence the circumnuclear gas in several ways. The onset and shutdown of the starburst are driven by the properties of the molecular gas, including its density and velocity dispersion, by gravitational instabilities (e.g., Combes 2001), and by processes that tend to prevent star formation, such as the local tidal field (Launhardt, Zylka & Mezger 2002), starburst feedback (e.g., Dopita 1985, Scalo & Chapell 1999), gas consumption (e.g., Franceschini et al. 1998), and tidal shear (e.g., Kenney et al. 1993). Fueling of starbursts is facilitated by nonaxisymmetric components such as bars, and by tidal torques from interactions and mergers (e.g. Combes & Gerin 1985, Athanassoula 1992, Mihos & Hernquist 1994, Laine et al. 2002)
The formation of powerful gas and plasma outflows from the center of disk galaxies provides the basis for the metal enrichment of galaxy halos (e.g., Kunth et al. 2002). Several mechanisms have been proposed to explain these outflows. The first possibility is a thermal wind from a circumnuclear starburst (e.g., Colina, Arribas & Borne 1999). The second possibility is a thermal wind from an AGN, as suggested by, e.g., Krolik & Bergelman (1986). Finally, it is possible that ram-pressure along the radio jet is driving the outflow (e.g., Taylor, Dyson & Axon 1992). Large-scale radio halos outside the galaxy disk, which most likely result from plasma and magnetic fields that have been blown off the disk by one of the above-mentioned mechanisms, have been known for more than two decades (e.g., Hummel, van Gorkom & Kotanyi 1983, Hummel, Beck & Dettmar 1991).
The nuclear starburst leads to the formation of OB associations or super star clusters, from which the massive stars, through strong supersonic stellar winds, inject both energy and mass into the surrounding interstellar medium. The formation of an expanding starburst “superbubble” will be accompanied by extended X-ray emission from hot gas, and optical H line emission from the cooler shell. The superbubble that has a larger internal ISM pressure than its surroundings expands into the low-pressure halo ISM until the onset of Rayleigh-Taylor instabilities, which disrupt the superbubble and allow the hot gas to escape in the form of a galactic wind, as is seen, e.g., in M82 (Strickland, Ponman & Stevens 1997). The cold molecular gas is expected to be compressed around the superbubble into an expanding cocoon.
Molecular gas in outflows has been detected in a few galaxies. M82 has an outflow bubble expanding at 45 km s-1(Weiß et al. 1999), with a molecular outflow gas mass of . NGC 2782 harbors an outflow with about of molecular gas (Jogee et al. 1998). The outflow in NGC 2782 appears to be in the early stages (its age is years), so that it is seen before the onset of Rayleigh-Taylor instabilities. In NGC 3079 four expanding CO shells have been identified (Irwin & Sofue 1996). These appear to have originated from a single starburst that took place a few Myrs ago.
The behavior of the molecular gas in such energetic outflows is still poorly understood. The kinematic and potential energies of the molecular gas are part of the total energy budget of the outflow, and one can use the observed properties of the gas (its location, mass and velocity) to constrain the origin of the outflow. Recently Sakamoto et al. (2006) observed molecular gas shells with the Submillimeter Array (SMA) in the circumnuclear disk of NGC 253. Further constraints on the nature and location of the energy source can be provided by the current gas phase, as in NGC 2782 (Jogee et al. 1998), or an unusual geometry of the outflow, such as the off-center outflow in NGC 5775 (Lee et al. 2001). Since gas is fuel for star formation, when it falls back onto the galaxy disk it may induce new episodes of star formation (e.g., Norman & Ikeuchi 1989).
NGC 6764 is a barred spiral with an optically classified low-ionisation nuclear emission-line region (LINER) nucleus (Osterbrock & Cohen 1982). This nearby active galaxy (D=32 Mpc; 1″ = 160 pc) hosts a very young nuclear starburst as shown by its Wolf–Rayet (W-R) feature at 0.47 m (HeII; Schinnerer et al. 2000). Eckart et al. (1991, 1996) and Schinnerer et al. (2000) analyzed the central starburst, traced by the W–R emission, in great detail. The millimetre observations have revealed a central concentration of molecular gas which also emits near-infrared line emission. The 2.12 m H2 line has features that are also seen in radio continuum. A population synthesis model based on NIR spectral lines suggests that NGC 6764 has undergone two recent starbursts. One of them took place 3–5 Myr ago, producing W–R features, and another 15–50 Myr ago. ROSAT X-ray data trace mainly the central AGN which varies by a factor of two over seven days (Schinnerer et al. 2000). By studying HCN and CO emission in the center of NGC 6764, Kohno et al. (2001) classified this galaxy as a combined AGN/starburst, based on the high HCN/CO line ratio () in the nucleus which suggests the presence of nuclear activity. Recently Hota & Saikia (2006, hereafter HS06) presented GMRT+VLA radiocontinuum and HI observations together with H data of the galaxy NGC 6764 where they found bipolar radio bubbles along the minor axis together with a compact core. Their HI observations reveal two peaks of emission at the ends of the bar and a depletion in the center together an HI absorption towards the radio core. The coexistence of an AGN and a starburst nucleus in NGC 6764 makes this galaxy an ideal target for studying the influence of both processes.
We present new high spatial resolution observations of the 12CO(1–0) and 12CO(2–1) lines made with the IRAM Plateau de Bure Interferometer (PdBI111Based on observations carried out with the IRAM Plateau de Bure Interferometer. IRAM is operated by CNRS (France), the MPG (Germany) and the IGN (Spain). ). We also present high resolution VLA222The VLA is a research facility of the National Radio Astronomy Observatory (NRAO), which is operated by Associated Universities Inc., under contract with the National Science Foundation. radio continuum maps at 3.5 cm and 20 cm (Laine et al. 2006). We describe our observations in §2. In §3 we discuss the thermal and synchrotron emission associated with the hot ISM, and their connection to the nuclear star formation. The distribution, kinematics, physical properties, and mass of the molecular gas in the outflow in NGC 6764 are described in §4. The energies involved in the outflow as determined by the molecular gas and radio continuum observations of the outflow are addressed in §5. We discuss our results in §6 and summarize them in §7. Throughout this paper, we use the following cosmological parameters: , and
| Property | Value | References |
|---|---|---|
| Hubble type | SB(s)bc | NED |
| Distance (Mpc) | 32 | H km s-1 Mpc-1 |
| Inclination | 61.5∘ | LEDA |
| Major Axis P.A. | 62∘ | LEDA |
| Bar P.A. | 74.6∘ | LEDA |
| S (Jy) | 0.36 | NED |
| S (Jy) | 1.29 | NED |
| S (Jy) | 6.33 | NED |
| S (Jy) | 11.56 | NED |
| L (1010 L⊙) | 1.1 | |
| L (1040 erg s-1) | 23 | |
| M (109) | 7.0 | NED |
| S90cm (mJy) | 309 | WENSS |
| S80cm (mJy) | 244 | Douglas et al. (1996) |
| S20cm (mJy) | 133 | White & Becker (1992) |
| S6cm (mJy) | 34 | Becker, White & Edwards (1991) |
| S3.5cm (mJy) | 31 | This paper |
2 Observations and data reduction
2.1 Radio continuum data
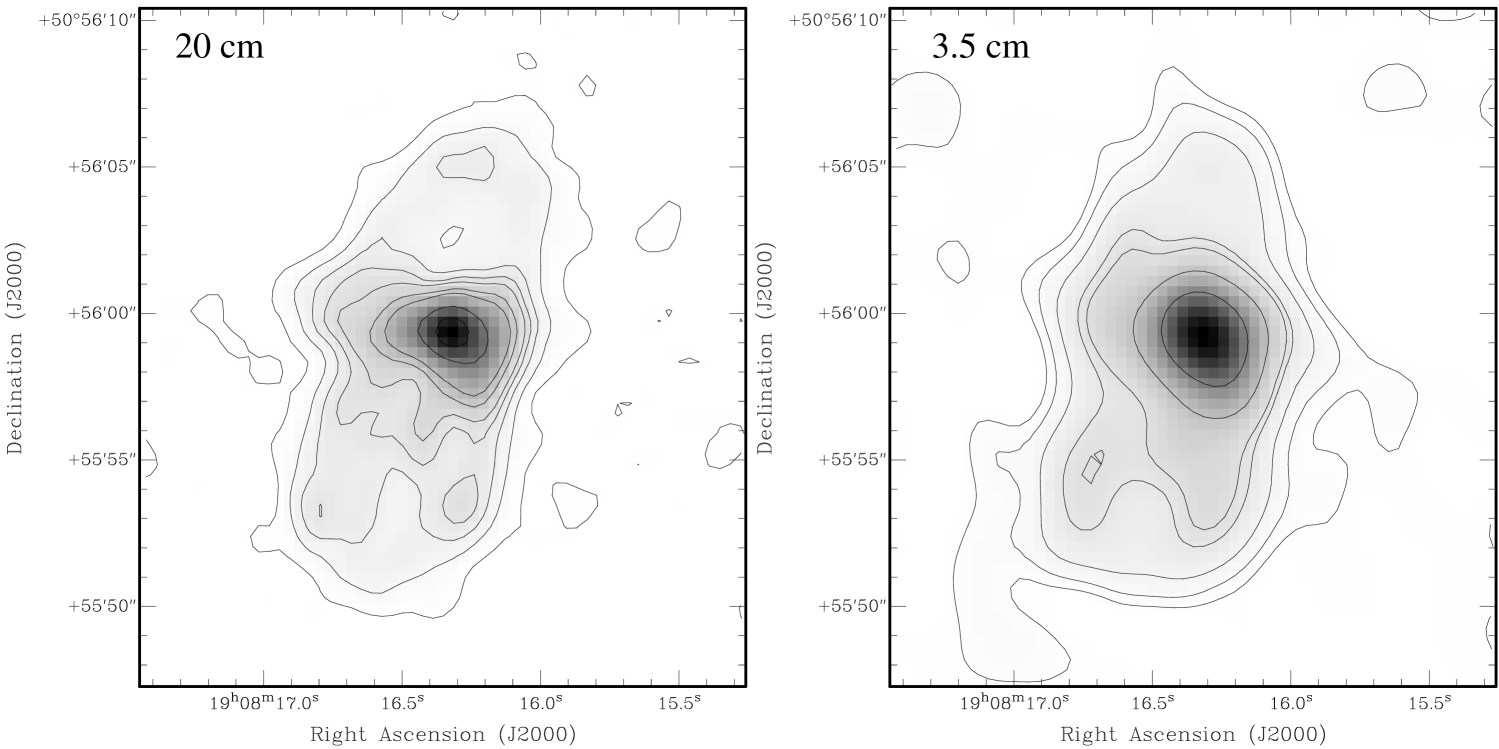
The radio continuum data were obtained with the Very Large Array (VLA) at 3.5 and 20 cm in C and A configurations (see Figure 1), respectively. We obtained a comparable spatial resolution at the two observed wavelengths, (P.A.=∘) at 20 cm and (P.A.=15.5∘) at 3.5 cm. For further details about the radio continuum observations, see Laine et al. (2006). The peak position of the 20 cm emission, = 19:08:16.316, = 50:55:59.37, was determined to an accuracy better than 01, by filtering out large spatial frequencies, using a wavelet transformation (e.g., Leon et al. 2000), and fitting a Gaussian to the remaining emission.
2.2 CO data
The 12CO(1–0) and 12CO(2–1) lines were observed with the IRAM interferometer (see Table 2), located on the Plateau de Bure (France), in the B and C configurations of the array, in 1998. We calibrated the visibilities using the radio galaxy 3C 380 as an amplitude calibrator and 1823+568 and 3C 380 as phase references. The Plateau de Bure Interferometer (PdBI) was phase-centered at =19:08:16.370 and =+50:55:59.58. The velocity resolution was set at 10 km s-1 for the two CO transitions, and the CLEANed maps have been restored with a synthesized beam of [P.A.=7∘; 12CO(1–0) ], and [P.A.=0∘; 12CO(2–1) ]. The rms noise for the channel maps is 2 mJy beam-1 [58 mK; 12CO(1–0) ], and 5.5 mJy beam-1 [82.5 mK; 12CO(2–1) ]. Hereafter the velocity reference is fixed to 2400 km s-1, giving a redshifted frequency of 114.3489 GHz for the 12CO(1–0) observations, and 228.6932 GHz for the 12CO(2–1) observations.
The total integrated 12CO(1–0) flux is 225 Jy km s-1in the 55″ beam of the NRAO 12-m telescope (Sanders & Mirabel 1985). Our PdBI 12CO(1–0) observations detected a total flux of 112 Jy km s-1, i.e., filtering out about 50% of the total flux, assuming all the emission is concentrated in the 45″ primary beam of the PdBI. This implies that a large fraction of the molecular gas must be in an extended smooth component to which the interferometer is insensitive. From Eckart et al. (1991) we estimate with IRAM-30m observations the 12CO(2–1) integrated intensity to be Jy km s-1in the center of NGC 6764, which implies a filtering of about 65% of the 12CO(2–1) flux by the PdBI observations.
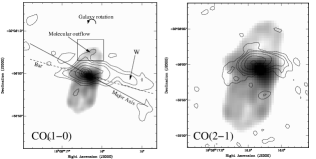
The integrated intensity maps for the 12CO(1–0) and 12CO(2–1) emission lines are shown in Figure 2. The position of the CO emission peak 19:08:16.402, 50:56:0.29 has been estimated using the higher spatial resolution of the 12CO(2–1) transition. Assuming that the spiral arms are trailing, and noting that the receding velocities in the disk are on the eastern side of NGC 6764, the northern side of the galaxy disk is closer to us.
| Parameter | 12CO(1–0) | 12CO(2–1) |
|---|---|---|
| Field of View | 45″(6.9 kpc) | 22″(3.4 kpc) |
| Bandwidth | 270 MHz | 473 MHz |
| Velocity resolution | 10 km s-1 | 10 km s-1 |
| Synthesized beam size | , P.A. 7∘ | |
| rms noise (per channel) | 2 mJy beam-1 | 6 mJy beam-1 |
3 Thermal and synchrotron emission
3.1 Radio continuum
The total integrated 20 cm flux density from the VLA observations is 90 mJy, which compared to the single dish flux density of 133 mJy (White & Becker 1992), implies that 70% of the total flux density is recovered by the VLA observations. The total 3.5 cm flux density is 31 mJy. Both VLA maps at 20 and 3.5 cm present the same features with a better spatial resolution at 20 cm (see Fig. 1). A bright peak is observed towards the nucleus of NGC 6764. Two 5″ spurs emerge from the unresolved nucleus, towards the south and the south-east. The emission near the nucleus is not consistent with a just a nuclear point source but hints at the presence of a nuclear radio jet, as proposed by HS06. The most remarkable feature is the shell-like emission, at both wavelengths, centered on the central peak with its major axis perpendicular to the major axis of NGC 6764 and extending about 1 kpc above and below the disk plane of the highly inclined galaxy NGC 6764. The clumpy shell emission is brighter towards south than towards north. These radio bubbles were previously reported by Baum et al. (1993), HS06 and Laine et al. (2006).
3.2 H emission
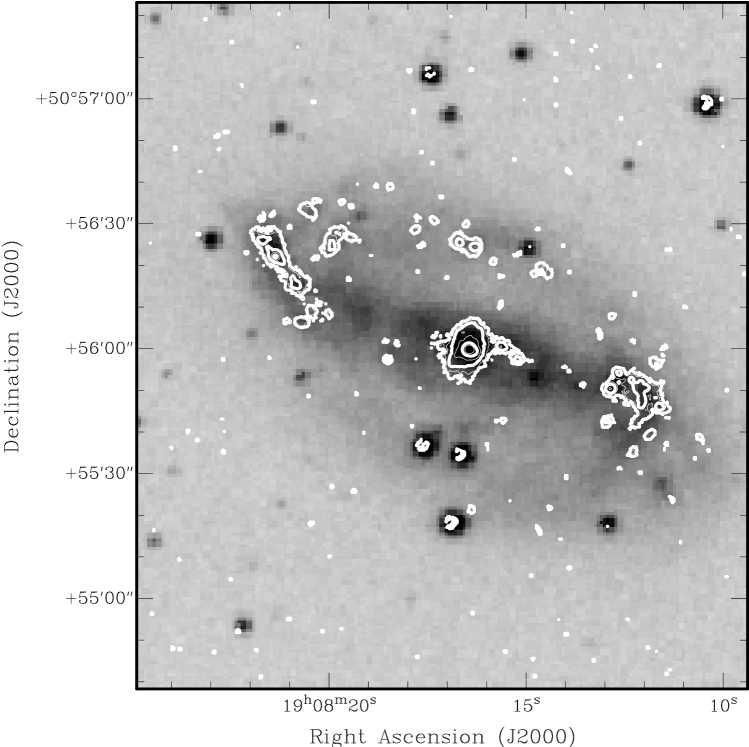
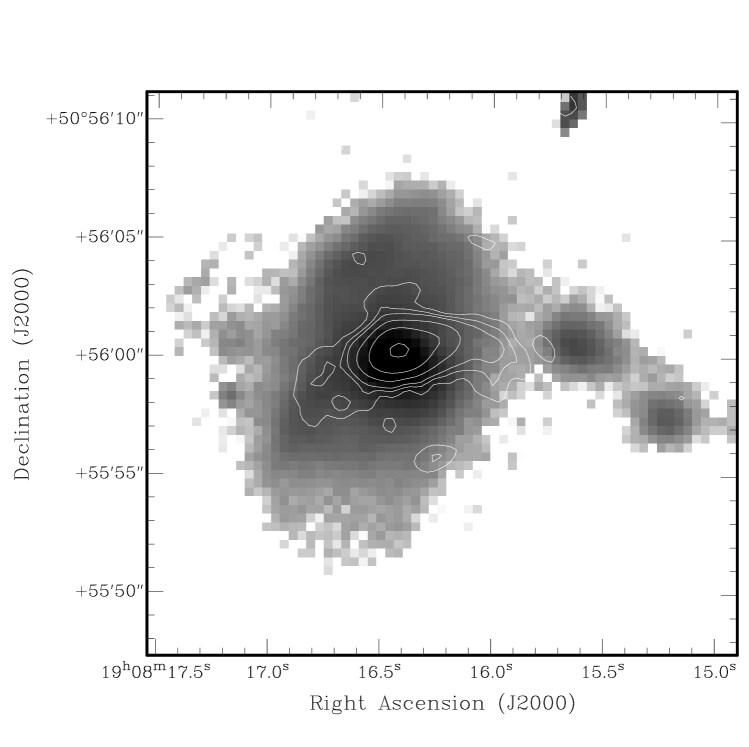
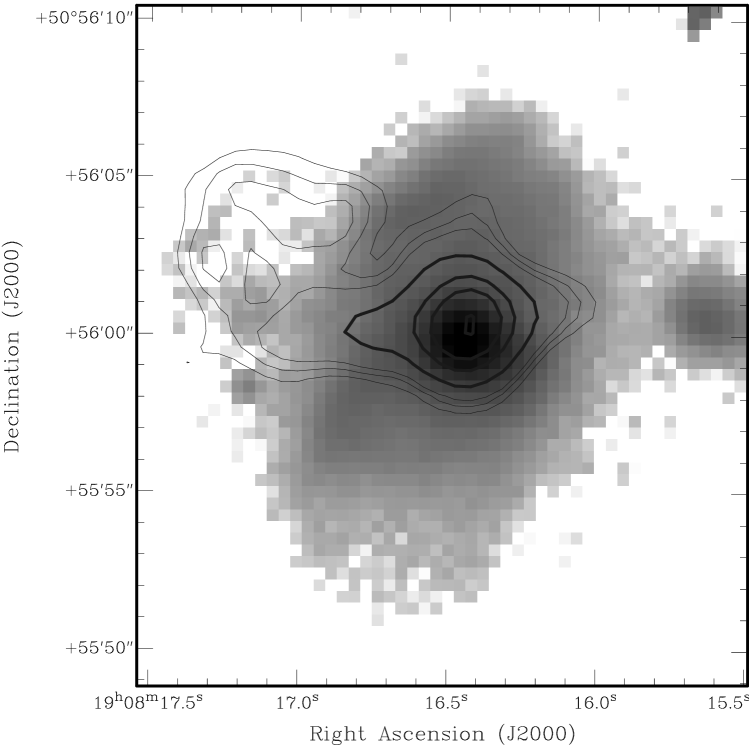
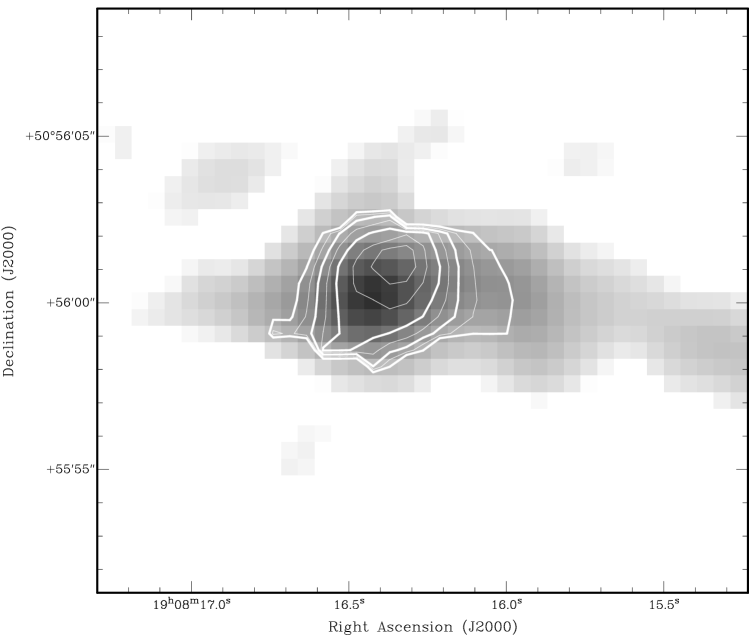
An H image of NGC 6764 was kindly given to us by D. Frayer. The observations were done at the Palomar 60-inch telescope with a seeing of 1–3″, using the X-filter centered at 6616 with a width of 20 , leaving out most of the [NII] emission line. Figure 3 shows the H emission at the center of NGC 6764. Apart from the most intense H emission in the central region, two other regions of emission are seen near the tip of the bar, which also lies near the beginning of the spiral arms. The most striking characteristic of the H emission near the center of NGC 6764 is its bubble-like shape, but its size is smaller than the size of the radio continuum outflow feature in the south. In Figure 4 a 4″ spur is observed to the southeast of the location of the 12CO(2–1) peak, bending towards south. This spur is spatially correlated with faint () 12CO(2–1) emission.
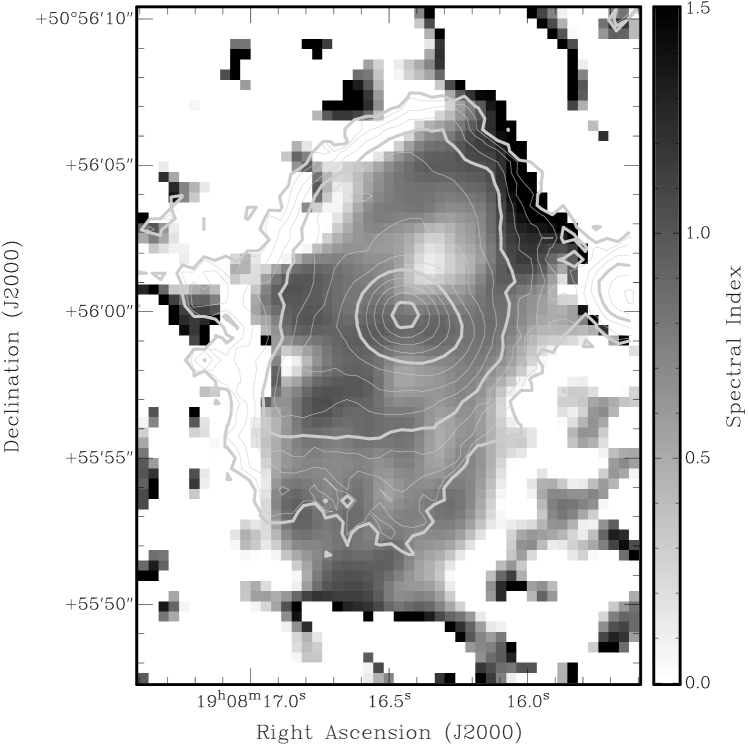
In Figure 5 the H emission is compared with the radio continuum spectral index. The “hot spot” in the bubble cavity with a flat spectral index () is associated with H emission driven by the nuclear starburst. Similarly, the tip of the southeastern H emission spur coincides with a small “hot spot” that has a flat spectrum.
3.3 Nuclear star formation
The nuclear star formation history was studied in detail by Schinnerer et al. (2000) using near-infrared K-band imaging spectroscopy of the very center of NGC 6764. To get the current star formation rate we have used here the FIR and the H emission line. We estimate as well the contribution of the thermal and non-thermal radiocontiuum emission.
3.3.1 Star formation rate
The total FIR luminosity is computed for the whole galaxy from the 60 and 100 m IRAS fluxes (see Table 1),
but is very close to the bolometric value computed for the nuclear region by Schinnerer et al (2000). Following Condon (1992), the star formation rate (SFR) for massive stars is
, which gives a SFR of 1 /yr.
The H line is mainly emitted by HII regions where newborn massive stars are ionizing
the gas. The total H flux can be used as a tracer of the star formation rate (Kennicutt 1998):
| (1) |
The H flux is 1.3 1041 erg/s for the nuclear starburst for an aperture size of 3″(see Table 3), which gives a SFR of 1 /yr, consistent with the SFR derived from the FIR luminosity. These two derivations of the SFR take into account only massive stars. Including all stellar masses, and accounting for the effects of optical extinction, Eckart et al. (1991) derived a SFR of 4 /yr for the nuclear starburst (NSB), and a supernova rate of /yr.
3.3.2 (Non-)Thermal radiocontinuum
| H | 20 cm | 3.5 cm | M(H2) | |
|---|---|---|---|---|
| (1039 erg.s-1) | (mJy) | (mJy) | () | |
| Nucleus | ||||
| Outflow | 45 | 12 |
While the radio continuum emission at long wavelengths is mainly produced by the compact source (AGN) the contribution from the NSB is important at 3.5 cm creating a flatter spectrum. By fitting the radio continuum between 6 cm and 80 cm where the non-thermal contribution is dominant, we found a spectral index of . Extrapolating that fit down to 3.5 cm, we obtained a non-thermal flux density of 6 mJy, which is much below the measured value of 31 mJy.
The free-free contribution (“bremsstrahlung”) can be computed from the H flux. The Balmer lines provide an estimate of the number of ionizing photons present in the source. If the optical extinction is known, the H flux can be used to compute the thermal radio continuum flux (e.g., Caplan & Deharveng 1986). Assuming an electron temperature of K and an optical extinction of (Eckart et al. 1991), the thermal radio continuum flux density at 3.5 cm is 14.8 mJy, obtained by integrating the H luminosity in the outflow. The H extinction is given by . Figure 6 shows the ratio between the radio flux density (mJy) and the H luminosity (in units of erg/s) for the thermal (free–free) contribution versus wavelength. This ratio is 75% at 3.5 cm. The maximum thermal contribution to the flux density at 3.5 cm is thus about 23 mJy (Zurita et al. 2000) which is consistent with our previous estimation of 6 mJy for the non-thermal radiocontinuum.
Table 4 gives an estimate of the thermal and non-thermal contributions to the observed radio continuum emission, using the H luminosities to estimate the thermal component. At 20 cm the radio continuum emission is mainly non-thermal (87 %), but at shorter wavelengths (6 and 3.5 cm) both contributions are comparable.
| Wavelength | Thermal | Non-thermal | ratio |
|---|---|---|---|
| (mJy) | (mJy) | ||
| 20 cm | 17.6 | 115.4 | 13% |
| 6 cm | 15.6 | 18.4 | 46% |
| 3.5 cm | 14.8 | 16.3 | 48% |

4 Molecular gas
4.1 Distribution
The CO emission detected with the PdBI is strongly concentrated toward the center of NGC 6764 (see Figure 2) and reaches a maximum at a projected distance of 125 ( 190 pc) from the radio continuum peak. More than 98% of the total molecular gas is concentrated within the inner 800 pc, and as much as 20% of the total 12CO(1–0) emission is included within one beam.
Apart from the central concentration, the CO emission is extended along the bar towards the western side (“W”) and has a smaller extension to the eastern side. Assuming that the external spiral arms are trailing, this CO emission is on the leading side of the bar.
The western CO feature, which extends to 10″ from the center, is aligned with the primary bar. The CO emission is associated with two H-emitting star forming regions (with and erg.s-1 H luminosities not corrected for extinction) which are among the brightest in NGC 6764, excluding the strong H emission at the tip of the bar (Rozas et al. 1996). Since NGC 6764 is highly inclined, the location of star formation and molecular gas in these regions is not completely clear.
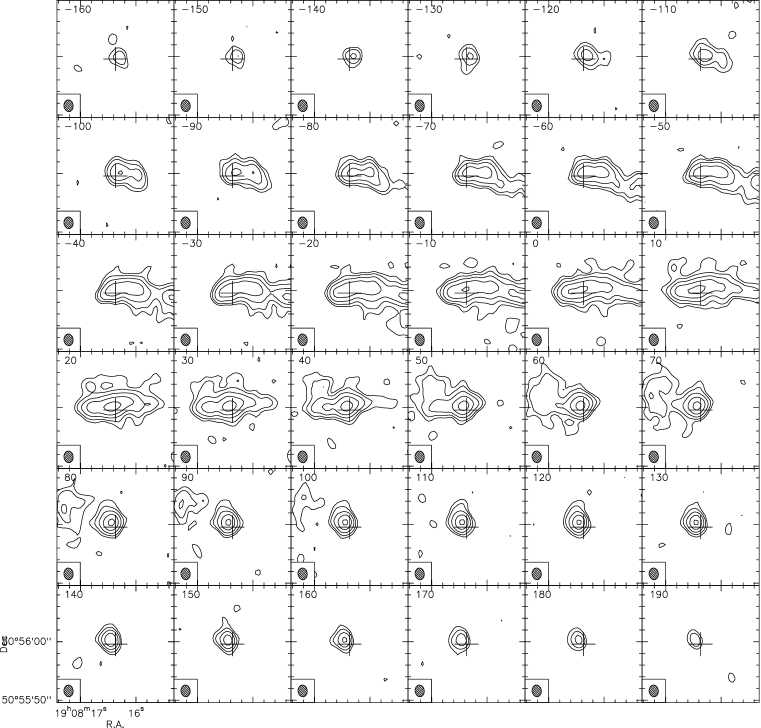
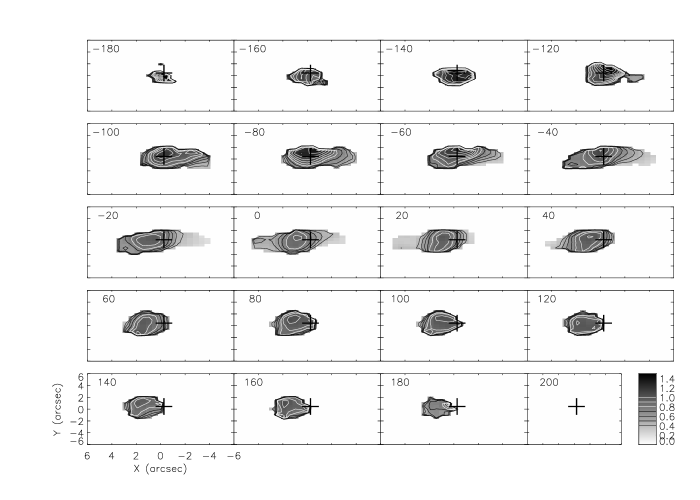
Figure 7 shows the 12CO(1–0) channel maps at 10 km s-1 velocity resolution relative to systemic. 12CO(1–0) emission is detected in the individual channels at 2.5 level from 2210 to 2600 km s-1(LSR). Two 12CO(1–0) peaks are seen in the very center at negative and positive velocities. The first of these strong peaks is seen mainly at negative velocities ( to km s-1), and is separated from the primary CO peak by 2″. This secondary peak is not visible in the integrated 12CO(1–0) map. Extended weaker features are visible in the channel maps as well. One feature is seen north of the 12CO(1–0) peak at velocities to 130 km s-1. Another more extended feature (see Figure 8) is seen at velocities 20 to 100 km s-1. The first feature is associated with the molecular outflow, visible in the 12CO(1–0) integrated intensity image, and flaring up to a 8″( 1 kpc) height. Correcting for the disk inclination, the molecular gas reaches 1.5 kpc above the plane of the galaxy. The velocities are consistent with motion perpendicular to the galaxy plane, taking into account the inclination and orientation of NGC 6764.
The faint extended feature between 20 and 100 km s-1 covers an area of about 1 kpc2 between 5″and 10″ radii (800 – 1600 pc). At a velocity of 70 km s-1, it reaches a total length of 12″ (1.9 kpc), and is oriented north to south. The velocity field shows few signs of outflow motion in this region, indicating that this feature is in the plane of the galaxy. The western feature (W) has a large velocity extent from km s-1 up to 10 km s-1. A CO spur is visible towards the north, and its location is spatially correlated with the boundary of the radio continuum superbubble, as seen at 20 cm.
4.2 Kinematics
4.2.1 First and second velocity moments
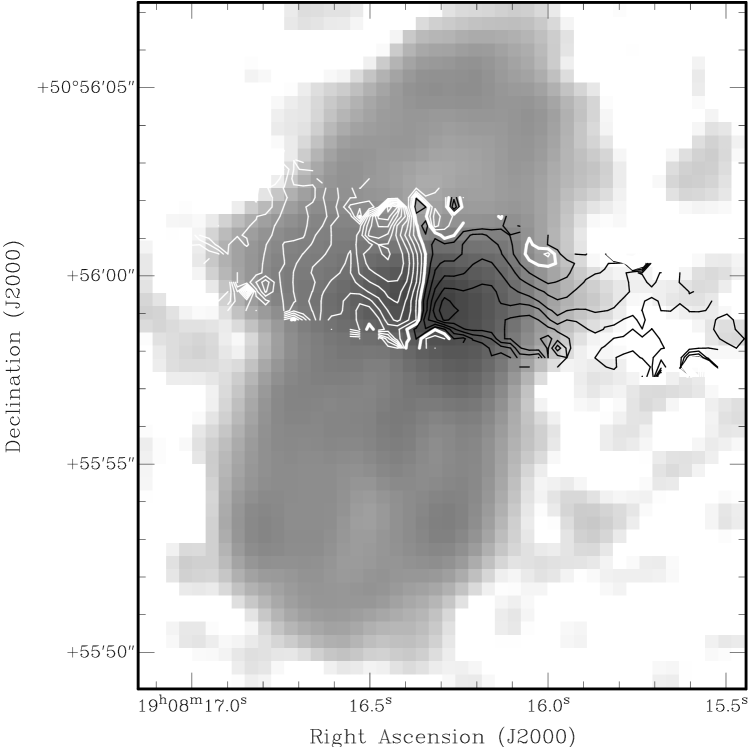
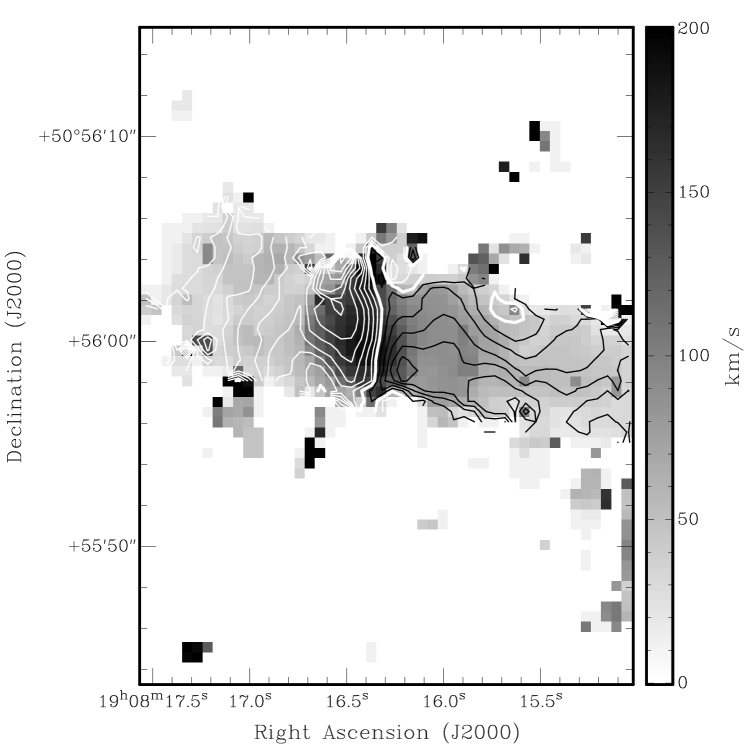
Figure 9 shows the beam-smeared map of the intensity-weighted 12CO(2–1) velocity field, derived from the first moment of the 12CO(2–1) data cube, overlaid on the 20 cm radio continuum emission. We determined the dynamical center of the gas motion from the 12CO(2–1) data, and compared it to the positions of the various emission peaks (see Table 5). HS06 find an offset of 0.55″between the VLA A-array peak at 3.5 cm and the optical nucleus. They explain that difference by a higher extinction close to the nucleus, which is consistent with the molecular gas distribution. The dynamical center of CO emission is spatially coincident with the nucleus as seen in the - and -bands, and located about 05 ( parsecs) from the radio continuum peak. Our observations are consistent with the global rotation of the galaxy disk, combined with streaming motions along the bar and/or a warping of the disk. The strongest deviation from the rotation pattern, the so-called “spider diagram,” is seen on the eastern side along the molecular outflow, which originates from the 12CO(1–0) peak, at 1″–2″ to the NE of the radio continuum peak. The noise in the velocity field there is significant since the CO emission is centrally concentrated and the emission intensity is much lower beyond the peak. The position angle (P.A.) of the galaxy major axis, determined from the velocity field, 70∘, is slightly larger than the P.A. from the orientation of the optical isophotes (615). The HI data of Wilcots et al. (2001) indicate a change in the P.A. between the outer part () and the inner part of the disk (). The difference is most likely due to the streaming motion near the center caused by the bar, as confirmed by the disturbed CO velocity field.
| Tracer | D20 | Astrom. | ||
|---|---|---|---|---|
| accuracy | ||||
| (″) | (″) | |||
| 20cm | 19:08:16.316 | 50:55:59.37 | 0.1 | |
| 12CO(1–0) peak | 19:08:16.392 | 50:56:0.24 | 1.2 | 0.3 |
| 12CO(1–0) vel.disp | 19:08:16.392 | 50:55:59.88 | 0.9 | 0.3 |
| 12CO(2–1) dyn | 19:08:16.351 | 50:55:59.74 | 0.5 | 0.2 |
| 12CO(2–1) peak | 19:08:16.402 | 50:56:0.29 | 1.2 | 0.2 |
| H | 19:08:16.440 | 50:55:59.87 | 1.3 | 0.2 |
| H | 19:08:16.362 | 50:55:59.68 | 0.5 | 0.2 |
| Nucleus -band | 19:08 :16.379 | 50:55:59.82 | 0.6 | 0.3 |
| Nucleus -band | 19:08:16.374 | 50:55:59.69 | 0.6 | 0.3 |
Figure 10 shows the beam-smeared map of the intensity-weighted 12CO(1–0) velocity dispersion in the center, derived from the second moment of the 12CO(1–0) data cube, overlaid with the 12CO(1–0) velocity field. The central velocity dispersion = 200 km s-1, is much higher than the internal velocity dispersion of a molecular cloud (typically a few km s-1; see e.g. Scoville et al. 1987). More likely, it results from the beam-smeared velocity gradient caused by a steeply rising rotation curve, together with a contribution from streaming motions.
Within the astrometric accuracy the peak of the velocity dispersion is located at the position of the dynamical center. At the position of the molecular outflow the velocity dispersion has values up to 150 km s-1, whereas along the bar, at radii larger than 5″ from the nucleus, the molecular gas velocity dispersion does not exceed 50 km s-1. Curiously, the velocity dispersion is asymmetric in the east–west direction, with larger values on the eastern side.
4.2.2 Lindblad resonances
The rotation curve has been computed from our 12CO(1–0) data and the HI data from Wilcots et al. (2001), using the task INSPECTOR in Gipsy. Although the HI spatial resolution is poorer than in CO, it provides data points at large radii. The rotation curve becomes flat at a value of 250 km s-1 at 12 kpc from the center. Under the assumption of the epicyclic approximation, the azimuthal frequency () and the radial frequency () have been computed from the rotation curve. The bar pattern speed is estimated from the rotation curve and the length of the bar semi-major axis (6.5 kpc). Several studies (e.g., Athanassoula 1992, Combes & Elmegreen 1993, Sempere et al. 1995) have shown that the ratio of the bar corotation radius to the bar semi-major axis length is in the range 1–1.5. The determination of the bar pattern speed is not strongly dependent on the exact value of this ratio since the frequency is flat in that domain. The bar pattern speed is 22 km s-1 kpc-1 with a corotation (CR) at a radius of 40″ (6.5 kpc), using a value of 1 for the ratio of the radius of the CR to the length of the bar semi-major axis. The inner Lindblad resonances (ILRs), if they exist, are the loci where the bar pattern speed equals (Figure 11). Thus, the epicyclic approximation suggests that two ILRs are present near the center. The rough radii for the inner and outer ILRs (iILR and oILR) are 6″ and 10″ (1 and 1.7 kpc). 4:1 resonances, or (inner/outer) ultraharmonic resonances (i/oUHR), with , are found at radii of 24″ (3.9 kpc; iUHR) and 100″ (16.5 kpc; oUHR). At these resonances the star orbits are periodic and form rings (e.g, Byrd et al. 1998). Contrary to the UHR location, the locations of the ILRs strongly depend on the bar pattern speed. Table 6 summarizes the locations of the resonances found with the application of the epicyclic approximation, valid for asymptotically weak bars. In the presence of an even moderately strong bar, an accurate determination of the resonance positions requires a full dynamical model, together with orbit analysis, which is beyond the scope of this paper.
| Resonance | n | Radius |
| () | ||
| iILR | -1/2 | 6″ |
| oILR | -1/2 | 10″ |
| iUHR | -1/4 | 24″ |
| CR | 0 | 40″ |
| oUHR | +1/4 | 100″ |

4.2.3 Non-circular motions
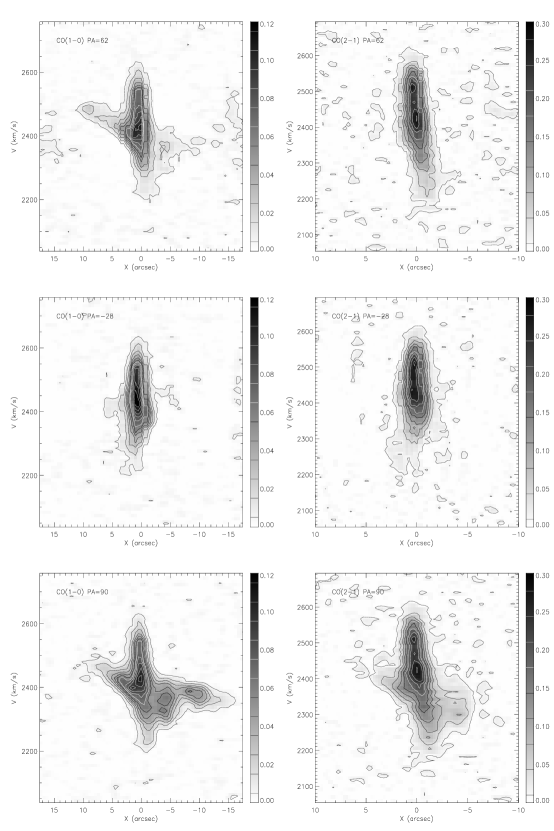
Figure 12 shows the position–velocity (PV) diagrams of the 12CO(1–0) and 12CO(2–1) emission along the major and minor axes (P.A. = 62∘ and P.A. = 152∘) of NGC 6764, along with a PV diagram at P.A. = 90∘ for comparison with the 12CO(1–0) observations made with the Nobeyama Millimeter Array (Eckart et al. 1996). As already shown by Eckart et al. (1996), the PV diagrams imply an asymmetric distribution of molecular gas near the nucleus. The CO intensity is higher for gas at redshifted velocities, with respect to the systemic velocity, i.e., on the eastern side. The PV diagram at P.A. = 90∘ in the 12CO(1–0) emission shows strong streaming motion at x=″, which is located slightly inside the iILR (). The 12CO(2–1) PV diagram along the minor axis reveals large streaming motions at x = 1″–2″, with a velocity near km s-1. Similarly, the 12CO(1–0) PV diagram along the minor axis shows an area of lower density gas on the eastern side at radii , with streaming motions at negative velocities. The spur visible between x-positions 1″ and 6″ in the velocity range [-30,80]km s-1 (relative to 2400 km s-1) is located in the molecular outflow, and is consistent with the 12CO(1–0) spectrum integrated over the outflow area. Assuming a trailing spiral structure, the northern part of NGC 6764 is closer to us, which implies largely redshifted (positive) velocities for the radial outflow in the northern side, as is seen in the PV diagram and in the integrated 12CO(2–1) spectrum.
4.3 CO line ratio
The line ratio for the integrated CO intensity between the 12CO(2–1) and 12CO(1–0) transitions, , was computed matching the u-v coverage of both transitions and using the same spatial resolution and taking only the 12CO(1–0) and 12CO(2–1) data above a threshold of . The result is shown in Figure 13. The maximum is 0.98, in agreement with that estimated by Eckart et al. (1991) from single dish observations. Eckart et al. (1991) interpreted the global ratio to arise from moderately warm, dense, and optically thick gas.

To estimate the uncertainty in the line ratio introduced by the missing flux, we compared the CO line ratio map derived from the single-dish data with the ratio derived from our new PdBI observations. We derive larger values of the ratio at large radii, owing to the lower spatial resolution () of Eckart et al. (1991). Their maximum value at the center is lower than ours by %. The maximum line ratio in each channel (10 km s-1 width) is shown in Figure 14. A bimodal feature is clearly seen, with peaks towards the blue and red sides. The blue side with a peak at km s-1 is associated with molecular gas closer to the radio continuum peak, as shown in the CO line ratio channel maps in Figure 15. At the peak the ratio reaches values of 2–2.5. The red side of the peak at 140 km s-1 has a maximum value of about 1.3. This high CO line ratio in fact applies to the bulk of the molecular gas, as is shown by the CO line ratio channel maps below.
The 12CO(2–1) /12CO(1–0) line ratio has been computed for each channel (10 km s-1width). Figure 15 shows the CO line ratio from a channel at km s-1 up to a channel at 200 km s-1 (the systemic velocity of NGC 6764 is 2400 km s-1, corresponding to a zero velocity in the channel maps). From to km s-1 the peak of the CO line ratio is spatially coincident with the nucleus (or the radio continuum peak, as indicated by a cross in the figure). The peak at km s-1 seen in Figure 14 is likely to be an edge effect. The “true” maximum is reached at km s-1, where the ratio reaches a value of 1.4 at the exact position of the radio continuum peak (to within a pixel width). The western CO emission feature has a mean CO line ratio of 0.3, which is likely to be an underestimate because of the filtering out of the extended emission.
The high CO line ratios for the blueshifted gas in the nucleus may be associated with outflowing molecular gas powered by the AGN or the starburst. HS06 reported a possible blueshifted HI absorption at against the compact core which may be related to the molecular gas with such high CO line ratios. We note that the radio continuum map (Fig. 1) has hints of a nuclear radio jet towards the south, likely associated with blue-shifted motions there as expected if the orientation of NGC 6764 with respect to the line of sight is taken into account. A redshifted counterpart with such a high line ratio is not detected.
4.4 H2 mass
Adopting a standard conversion factor of Xcm-2 (K km s-1)-1 (e.g., Strong et al. 1988), the total mass of molecular hydrogen (H2) is:
| (2) |
where is the integrated CO flux density in Jy km s-1 and is the distance in Mpc. The integrated 12CO(1–0) flux density from our new map gives a total molecular hydrogen mass of . It does not take into account the 50 % of flux filtered out by the interferometer observations.
In the Milky Way’s disk the X conversion factor derived from observations has been found to match the theoretical conversion factor quite well (e.g., Radford et al. 1991). However, there is growing evidence that the conversion factor is overestimated by a factor of 3–10 in the central part of galaxies, especially in those with nuclear starbursts (Downes & Solomon 1998). The physical reasons for this discrepancy have been discussed in several papers, and include the metallicity gradient (e.g., Dahmen et al. 1998), broadening of the CO line by the bulge potential (e.g., Stacy et al. 1989, Mauersberger et al. 1996), and changes in the physical conditions of the circumnuclear gas (e.g., its optical depth, temperature, and density). In NGC 253, a nearby starburst galaxy, Mauersberger et al. (1996) found a conversion factor times lower than in the central part of the galaxy. They argued that the central potential well is broadening the CO lines, and its emission could be partially optically thin. The conversion factor has been found to be 3 to 10 times lower in the galactic bulges compared to their disks (Sodroski et al. 1995). Recently, Weiß et al. (2001) analyzed the variations of X in the starburst of M82 in detail. They found that “ X is a function of the intrinsic gas properties, which strongly depend on environmental effects” (massive star formation). This leads to a variation of X by a factor of 5–10, compared to the Galactic value of X cm-2 K km s-1.
The dust mass computed from the IRAS fluxes at 60 and 100 m gives a total mass of Md= with a mean temperature of 36.5 K. It is known from FIR observations with ISO that the IRAS data are missing a cold dust component that emits beyond 150 m and has a temperature of T K, (Alton et al. 1998, Trewhella et al. 2000). This component can be 2–10 times more massive than the warm dust component.
In NGC 6764 the gas-to-dust mass ratio, using the standard CO-to-H2 conversion factor and correcting for the missing flux in the interferometer map, leads to . This factor is much larger than the typical value found in normal spiral galaxies (an average ratio of ; Leon et al. 1998) using IRAS-derived dust masses. This indicates that the molecular gas mass obtained from the 12CO(1–0) luminosity and the standard conversion factor has most likely been overestimated.
The high gas-to-dust mass ratio means that the H2 mass has probably been overestimated by a factor of 2–3 in the center of NGC 6764, when using the standard conversion factor X. This overestimate may be even more severe in the nucleus because of the intense starburst. Thus we estimate the total H2 mass to be 7, taking into account the filtered out flux in the 12CO(1–0) interferometric map.
5 Outflow
The basic morphological parameters for the outflow from the 20 cm radio continuum observations are: a projected base of radius 3.5″(540 pc) and a projected height of 7″(1080 pc) above the galaxy plane. The mass-load in the outflow is estimated from the spatial distribution of the 12CO(1–0) emission. The 12CO(1–0) emission was integrated in the area shown in Fig. 2 only for the northern part of the outflow. The area was chosen in order to avoid the contamination from the molecular gas emission in the disk, given the inclination of the galaxy and the spatial resolution of the observations. The 12CO(1–0) integrated intensity in the out-of-plane outflow is 1.4 Jy km s-1.
The observed energy of the different gas phases in the outflow is an indicator of the physical processes responsible for the outflow. Assuming that the bulk of the molecular gas is perpendicular to the disk plane, the expansion velocity Vexp is estimated from the spur in 12CO(1–0) seen between -30 and 80 km s-1on the PV diagram (see Fig. ). We take a projected expansion velocity of 25 km s-1, which gives an expansion velocity of 53 km s-1. This value is quite uncertain since we know already that some molecular gas is reaching an expansion velocity of 170 km s-1. Applying a correction of 1/3 to the CO-to-H2 conversion factor (see §4.4) the total molecular gas mass in the outflow is . Thus the molecular gas kinetic energy Ekin in the outflow is ergs.
For a starburst with a SFR=1 /yr, different star formation models have been computed (instantaneous or continuous). The total energy released by SNs and stellar wind at the age of the recent NGC 6764 starburst ( 5 Myr) is in the range of ergs. Thus there is no need to invoke AGN or other mechanisms, such as hypernovae or tidal interaction, to drive the outflow, even if the AGN seems to have an effect on the molecular gas physical conditions (see Sect. 4.3) and .the data cannot exclude the AGN from being the major energy source either.
To further study the energy budget, we computed the total thermal energy in the hot X-ray gas, which was determined by the HRI ROSAT instrument. The X-ray emission is composed by two components: one varying on the timescale of several days and a more diffuse one which extends up to 15″ from the nucleus, roughly along the minor axis (Schinnerer et al. 2000). We make use of the X-ray parameters derived by Eckart et al. (1996) from the ROSAT observations in the 0.1–2.4 keV band. They estimated an electron density , where is the volume filling factor, the volume of the extended X-ray gas as , and the temperature of the X-ray gas as K. The total thermal energy is then given by , i.e. ergs. We use , as was found for the starburst galaxy NGC 3256 (Heckman et al. 1990; Moran et al. 1999). Thus is estimated to be ergs. The current starburst in NGC 6764 appears to be capable of releasing sufficient energy to power the hot X-ray gas bubble.
To estimate the distribution of the radio continuum emission at 20 cm in the outflow bubble, the nuclear component has been subtracted by fitting a Gaussian to the nuclear flux above a threshold of 4 mJy beam-1. The total flux remaining in the center-subtracted map is 63 mJy, or about 60% of the total seen in the VLA observation. There is an offset of the centroid of the outflow emission relative to the position of the nuclear radio continuum peak, and relative to the disk plane. This offset can be due to various reasons: a) the starburst is located in the western part of the nucleus, and slightly below the plane, as suggested by the lower gas column density south of the nucleus, b) there is a possible contribution from a radio jet in the southern part in addition to the starburst-induced outflow.
6 Discussion
We compare the CO and H observations to the different hydrodynamical models of Tomisaka & Ikeuchi (1988) performed for a smooth gas component with various scenarios of starburst. The case D of Tomisaka & Ikeuchi (1988) has a starburst with a supernova rate comparable to the one found in NGC 6764 (yr-1: the bubble reaches z1.2 kpc after 9 Myr, which is difficult to conciliate with the W-R star age and population. In the case C, with an ambient density of , the height of the bubble reaches 1 kpc after 7 Myr. Moreover they performed a simulation with a short “explosion” which drives the bubble height to z 1.3 kpc as fast as in 1 Myr. From all these different models, we can conclude that the recent starburst has been intense and short 3-7 Myr ago, in complete agreement with the stellar population analysis of Schinnerer et al. (2000). From the comparison with these simulations we can conclude that the hot gas in NGC 6764 is still in a confined bubble, and has not yet escaped to the halo.
The NSB in NGC 6764 is very similar to the NSB in NGC 2782 (Jogee et al. 1998, 1999). However, NGC 2782 has no nuclear activity, apart from the starburst. The CO spurs in NGC 2782 have a total molecular gas mass of , a total molecular gas kinetic energy of ergs, and a thermal energy of . These numbers are larger by factors of 5–10 compared to the energy released in NGC 6764. Nevertheless the size of the outflows is comparable. This is probably due to the lower ISM density in NGC 6764 than in NGC 2782.
Observations (Seaquist & Clark 2001, Walter et al. 2002) of 12CO(3–2) and 12CO(1–0) emission in the prototypical starburst galaxy M82 indicate a large amount of molecular gas ( in the outflow with a maximum outflow velocity of 230 km s-1and an estimated kinetic energy of . Similarly to our estimate, Weiß et al. (2001) found a CO-to-H2 conversion 3 times lower than the Galactic conversion factor. The height of the molecular gas outflow is about 1 kpc above the plane with an estimated starburst age of 10 Myr. The comparison with NGC 6764 indicates that in this galaxy the build-up of the molecular outflow was faster by a factor 2-3. The main difference is the molecular gas mass involved in the outflow, which is an order of magnitude larger in M82 than in NGC 6764.
HS06 present a compilation of 10 galaxies with non-thermal bubbles that shows that all are associated with an AGN. They link the origin of these bubbles to the presence of an AGN. We note that 6 galaxies of their sample (60 %) have a FIR luminosity larger than the one of NGC 6764, if we adopt their luminosities. The presence of an AGN may not be sufficient to create these bubbles. It may indicate that the association of a starburst, present or recent, with an AGN could be the key to generate non-thermal radio bubbles. The creation of such feature would depend on a short time scale combination of the two processes: the starburst and the AGN. Nevertheless we note that the presence of radio AGN is very low in spiral galaxies (J. Sabater, private communication) which makes the correlation between radio-AGN and non-thermal bubble very significant. Thus a statistical study with a large sample of galaxy with non-thermal bubbles would help to disentangle their origins.
NGC 6764, like other composite galaxies with a nuclear starburst and an AGN, shows that the molecular gas evolution in the very center is mainly driven by the starburst, especially in the molecular outflow. Even if the AGN has an active role in the central evolution, as shown by the gas chemistry in the Seyfert 2 galaxy NGC 1068 (Usero et al. 2004), the only possible influences of the AGN on the molecular gas, at the resolution of the observations of the CO emission in NGC 6764, appears to be the high CO line ratio in the very center, and likely the high HCN/CO ratio already found by Kohno et al. (2001). No clear dynamic signature is observed. The AGN are able to inject vast amounts of energy into their host galaxies and should have a disruptive influence on the molecular gas in the central regions.
7 Summary
We have found the following results from our high-resolution mapping of the 12CO(1–0) and 12CO(2–1) millimetre lines and 3.5 and 20 cm radio continuum emission in the circumnuclear area of the NSB galaxy NGC 6764.
-
1.
The bulk of the 12CO emission is concentrated in the very center of NGC 6764 and is offset from the 20 cm radio continuum peak by (with respect to the 12CO(1–0) emission peak). A more extended component is detected along the bar on the western side of the nucleus.
-
2.
Non-thermal radio continuum emission at 3.5 and 20 cm is observed above and below the galactic plane in a nuclear bubble-like outflow, as already shown by HS06 and Laine et al. (2006). This outflow is detected out to z=1.3 kpc above the galactic plane (deprojected). 12CO(1–0) emission is detected at the NE boundary of the outflow. About of molecular gas is driven by the outflow out of the plane of the galaxy.
-
3.
The total molecular gas mass is using a CO-to-H2 conversion factor equal to 1/3 of the Galactic value. The use of such a value is motivated by the large gas-to-dust mass ratio and previous studies of molecular gas in starburst galaxies.
-
4.
The 12CO(2–1) / 12CO(1–0) line ratio was computed in each channel (10 km s-1velocity width). It reaches a maximum of 1–2 at the nucleus, and is likely associated with the nuclear AGN (it coincides with the 20 cm radio continuum peak). In the bulk of the molecular gas the maximum ratio is about 1–1.3, consistent with warm (TK) and dense gas (), as found by Eckart et al. (1991).
-
5.
An important fraction of the radio continuum at 3.5 cm is thermal. The outflow morphology and the ISM properties indicate an age of 3–7 Myr for the recent starburst, by comparing the observations to hydrodynamical simulations. It appears that the outflow is still confined and not freely expanding. A “hot-spot” of thermal gas with a flat spectral index () is located near the northern boundary of the bubble/outflow.
-
6.
The kinetic and thermal energies of the molecular and hot gas components in the bubble can be fully accounted for by the energy released from the NSB, even if the data cannot exclude the AGN from being the major energy source.
Acknowledgements.
We thank an anonymous referee for his careful reading and very detailed report which helped to improve this paper significantly. This research has made use of the NASA/IPAC Extragalactic Database (NED) which is operated by the Jet Propulsion Laboratory, California Institute of Technology, under contract with the National Aeronautics and Space Administration. During part of this research S. Leon was supported by a Marie Curie Individual Fellowship contract HPMF-CT-20002-01734 from the European Union. We would like to thank David Frayer and Eric Wilcots for providing their H and HI data, respectively.References
- (1) Alton, P. B., Bianchi, S., Rand, R. J., Xilouris, E. M., Davies, J. I., Trewhella, M. 1998, ApJ, 507, 125
- (2) Athanassoula, E. 1992, MNRAS, 259, 345
- (3) Baum, S. A., O’Dea, C. P., Dallacassa, D., de Bruyn, A. G., Pedlar, A. 1993 ApJ, 419, 553
- (4) Byrd, G.G., Ousley, D., dalla Piazza, C. 1998, MNRAS, 298, 78
- (5) Caplan, H., Deharveng, L. 1986, A&A. 155, 297
- (6) Colina, L., Arribas, S., Borne, K.D. 1999, ApJ, 527, L13
- (7) Combes, F. 2001, ’The Central Kiloparsec of Starbursts and AGN: The La Palma Connection’, ASP Vol. 249. Eds. Knapen, J.H., Beckman, J.E., Shlosman,I, Mahoney, T.J, p. 475
- (8) Combes, F., Gerin, M. 1985, A&A, 150, 327
- (9) Combes, F., Elmegreen, B.G. 1993, A&A, 271, 391
- (10) Condon, J. J., Yin, Q. F. 1990, ApJ, 357, 97
- (11) Dahmen, G., Huttemeister, S., Wilson, T. L., Mauersberger, R. 1998, A&A, 31, 959
- (12) Dopita, M.A. 1985, ApJ, 295, 5
- (13) Downes, D., Solomon, P. M. 1998, ApJ, 507, 615
- (14) Eckart, A., Cameron, M., Boller, Th., Krabbe, A., Blietz, M., Nakai, N., Wagner, S. J., Sternberg, A. 1996, ApJ, 472, 588
- (15) Eckart, A., Cameron, M., Jackson, J. M., Genzel, R., Harris, A. I., Wild, W., Zinnecker, H. 1991, ApJ, 372, 67
- (16) Franceschini, A., Silva, L., Fasano, G., Granato, L., Bressan, A. Arnouts, S., Danese, L. 1998, ApJ, 506, 600
- (17) Hota, A, Saikia, D.J. 2006, MNRAS, 371, 945 (HS06)
- (18) Heckman, T. M., Armus, L., Miley, G. K. 1990, ApJS, 74, 833
- (19) Hummel, E., van Gorkom, J. H., Kotanyi, C. G. 1983, ApJ, 267, 5
- (20) Hummel, E., Beck, R, Dettmar, R.-J. 1991, A&AS, 87, 309
- (21) Hill, T. L., Heisler, C. A., Norris, R. P., Reynolds, J. E.; Hunstead, R. W. 2001, AJ, 121, 128
- (22) Irwin, J. A., Sofue, Y. 1996, ApJ, 464, 738
- (23) Jogee, S. Kenney, J. D. P., Smith, B. J. 1998, ApJ, 494, 185
- (24) Jogee, S., Kenney, J. D. P., Smith, B. J. 1999, ApJ, 526, 665
- (25) Kenney, J. D. P., Carlstrom, J. E., Young, J. S. 1993, ApJ, 418, 687
- (26) Kennicutt, R. C., Jr. 1998, ApJ, 498, 541
- (27) Kohno, K. et al. 2001, “The Central Kiloparsec of Starbursts and AGN: The La Palma Connection”, ASP Conference Proceedings Vol. 249. Eds. Knapen, J. H., J. E. Beckman, J.E., Shlosman, I. and Mahoney, T.J. San Francisco: Astronomical Society of the Pacific, 2001, p. 672.
- (28) Kunth, D. Legrand, F. Tenorio-Tagle, G. Silich, S. Mas-Hesse, J. M. Cerviño, M. 2002, Ap&SS, 281, 261
- (29) Krolik, J.H., Begelman, M.C. 1986, 308, L55
- (30) Laine, S., Kotilainen, J. K., Reunanen, J., Ryder, S. D., Beck, R. 2006, AJ, 131, 701
- (31) Laine, S., Shlosman, I., Knapen, J. H., Peletier, R. F. 2002, ApJ, 567, 97
- (32) Launhardt, R., Zylka, R., Mezger, P. G. 2002, A&A, 384, 112
- (33) Lee, S.-W., Irwin, J. A., Dettmar, R.-J., Cunningham, C. T., Golla, G., Wang, Q. D. 2001, A&A, 377, 759
- (34) Leon, S., Combes, F., Menon, T. K. 1998, A&A, 330, 37
- (35) Leon, S., Meylan, G., Combes, F. 2000, A&A, 359, 907
- (36) Mauersberger, R., Henkel, C., Wielebinski, R., Wiklind, T., Reuter, H.-P. 1996, A&A, 305,.421
- (37) Mihos, J. C., Hernquist, L. 1994, ApJ, 425, 13
- (38) Moran, E. C., Lehnert, M. D., Helfand, D. J. 1999, ApJ, 526, 649
- (39) Norman, C. A., Ikeuchi, S. 1989, ApJ, 345, 372
- (40) Osterbrock, D. E., Cohen, R. E. 1982, ApJ, 261, 640
- (41) Radford, S. J. E., Downes, D., Solomon, P. M. 1991, ApJ, 368L, 15
- (42) Rozas, M.; Beckman, J. E.; Knapen, J. H. 1996, A&A, 307, 735
- (43) Sakamoto, K. Ho, P. T. P., Iono, D., Keto, E. R.; Mao, R.-Q., Matsushita, S., Peck, A. B., Wiedner, M. C.; Wilner, D. J., Zhao, J.-H. 2006, ApJ, 636, 685
- (44) Sanders, D. B., Mirabel, I. F. 1985, ApJ, 298, 31
- (45) Scalo, J., Chappell, D. 1999, MNRAS, 310, 1
- (46) Scoville, N. Z., Yun, M. S., Sanders, D. B., Clemens, D. P., Waller, W. H. 1987, ApJS, 63, 821
- (47) Schinnerer, E., Eckart, A., Boller, Th. 2000, ApJ, 545, 205
- (48) Seaquist, E. R., Clark, J. 2001, ApJ, 552, 133
- (49) Sempere, M.J., Garcia-Burillo, S., Combes, F., Knapen, J. H. 1995, A&A, 296, 45
- (50) Sodroski T.J. et al. 1995, ApJ, 452, 262
- (51) Stacy, J. G., Bitran, M. E., Dame, T. M., Thaddeus, P. 1989 The Center of the Galaxy: Proceedings of the 136th Symposium of IAU, Los Angeles, U.S.A., Ed M. Morris, Kluwer Academic Publishers, Dordrecht, p.157
- (52) Strickland, D. K., Ponman, T. J., Stevens, I. R. 1997, A&A, 320, 378
- (53) Strong, A. W., Bloemen, J. B. G. M., Dame, T. M., Grenier, I. A., Hermsen, W.,
- (54) Taylor, D., Tyson, Axon, D.J. 1992, MNRAS, 255, 351
- (55) Tomisaka, K., Ikeuchi, S. 1988, ApJ, 330, 695
- (56) Trewhella, M., Davies, J. I., Alton, P. B., Bianchi, S., Madore, B. F. 2000, ApJ, 543, 153
- (57) Usero, A., Garc a-Burillo, S., Fuente, A., Mart n-Pintado, J.; Rodr guez-Fern ndez, N. J. 2004 A&A, 419, 897
- (58) Walter, F.,Weiss, A., Scoville, N. Z. 2002, ApJ, 580, 21
- (59) Weiß, A., Neininger, N., Hüttemeister, S., Klein, U 2001, A&A, 365, 571
- (60) White, R. L., Becker, R. H. 1992, ApJS, 79, 331
- (61) Zurita, A., Rozas, M., Beckman, J. E. 2000, A&A, 363, 9