Evidence for strong 5 electron correlations and electron-magnon coupling in a pyrochlore, Y2Ir2O7
Abstract
We report the observation of an unusual behavior of highly extended 5 electrons in Y2Ir2O7 belonging to pyrochlore family of great current interest using high resolution photoemission spectroscopy. The experimental bulk spectra reveal an intense lower Hubbard band in addition to weak intensities in the vicinity of the Fermi level, . This provides a direct evidence for strong electron correlation among the 5 electrons, despite their highly extended nature. The high resolution spectrum at room temperature exhibits a pseudogap at and dependence demonstrating the importance of electron correlation in this system. Remarkably, in the magnetically ordered phase ( 150 K), the spectral lineshape evolves to a dependence emphasizing the dominant role of electron-magnon coupling.
pacs:
71.27.+a, 72.10.Di, 71.20.-b,79.60.BmIt is generally believed that electron-electron Coulomb repulsion strength, , among the electrons decreases as one traverses from 3 to 5 ions, due to the increase in radial extension of the these orbitals. For example, while the effective electron correlation strength, ( = bandwidth) in 3 transition metal oxides (TMOs) is significantly strong fujimori-review , in 4 TMOs is weak enabling first principle approaches to capture the experimentally determined electronic structure ruthPRBR ; fujimori . Signature of electron correlation in 5 transition metal compounds has not been observed allen ; Cd2Re2O7-2 ; bairo3band . In this letter, we offer a clear evidence for strong correlation among 5 electrons in a compound, Y2Ir2O7, which has not been paid enough attention in the literature.
This compound belongs to pyrochlore structure, which have drawn significant attention in recent times due to the possibility of geometrical frustration leading to a varieties of novel phenomena e.g., spin ice behavior SpinIce , superconductivity Cd2Re2O7-1 , correlation induced metal insulator transitions R2Mo2O7 etc. In particular, a Ir based pyrochlore, Pr2Ir2O7 has been recently identified to show spin-liquid behavior SLpr2ir2o7 , anomalous Hall effect AHEpr2ir2o7 etc. It is believed that the interaction between the Pr 4 moments mediated by Ir 5 conduction electrons plays a key role here. While Pr2Ir2O7 is a metal, the Y-analogue, Y2Ir2O7 is an insulator. Y2Ir2O7 is described to be a Mott insulator, where large leads to insulating phase in a metal Fukazawa ; soda ; fukazawa1 . In addition, Y2Ir2O7 has been proposed to exhibit a weak ferromagnetic transition at around 150 K soda ; fukazawa1 . Therefore, this system appears to be an ideal system to probe 5 electron correlation.
In this letter, we report the results of our investigation on the origin of unusual properties in Y2Ir2O7 using state-of-the-art high resolution photoemission spectroscopy. We find that the bulk Ir 5 band exhibits a signature of intense lower Hubbard band as observed in strongly correlated 3 TMOs fujimori-review ; kbmPRL . It is remarkable that no hard gap is observed in the bulk spectra although it is an insulator. The spectral lineshape in the vicinity of the Fermi level, changes from behavior at 300 K corresponding to a correlated Fermi liquid system to behavior in the ferromagnetic phase suggesting importance of electron-magnon coupling.
High quality Y2Ir2O7 was prepared by solid state reaction route using high-purity ( 99.9%) ingredients (Y2O3 and IrO2 powders). To achieve large grain size and good intergrain binding, the sample was sintered in pellet form at 900 oC for a day and subsequently, at 1000 ∘C for more than two days with an intermittent grinding. The sample quality was characterized by x-ray diffraction and scanning electron microscopy. There was no evidence for any impurity feature. Rietveld refinement reveals a single cubic phase ( = 10.20 Å; space group ). The sample was further characterized kartik by magnetization measurements and found to show a magnetic transition at about 150 K in agreement with the literature soda ; fukazawa1 . Photoemission measurements in the temperature range 10 K - 300 K were performed using monochromatic photon sources and SES2002 Gammadata Scienta analyzer. The energy resolutions were set to 300 meV, 4 meV and 1.4 meV for the measurements with Al (1486.6 eV), He II (40.8 eV) and He I (21.2 eV) photons, respectively. The sample surface was cleaned by in situ scraping (base pressure = 310-11 torr) and cleanliness of the sample surface was ensured by negligible ( 2%) impurity contributions in the O spectral region and the absence of C peak. The electronic band structure calculations were carried out using full potential linearized augmented plane wave method (WIEN2k software)wien within the local density approximations, LDA. The convergence was achieved considering 512 points within the first Brillouin zone and the error bar for the energy convergence was set to 0.25 meV.
In Fig. 1, we show the density of states (DOS) calculated for the nonmagnetic ground state representing the electronic structure at room temperature. The total density of states (TDOS), Ir 5 partial density of states (PDOS), O1 2 PDOS and O2 2 PDOS are plotted in different panels of the figure. Here, O1 and O2 represent the oxygens forming IrO16 octahedra and the oxygens bonded to Y forming O2Y4 tetrahedra, respectively. Y 4 PDOS appear primarily beyond 4.7 eV above with negligible contribution in the occupied part and hence not shown here. There are two groups of features in the TDOS in the occupied part. The energy range, -7.5 to -1.5 eV is primarily dominated by O1 2 and O2 2 PDOS with a small contribution from Ir 5 PDOS. O2 2 PDOS appears between -5.0 to -1.5 eV, which is not bonded to Ir 5 states. O1 2 - Ir 5 bonding states with dominant O1 2 character contribute to the energy range below -5 eV. In the energy range -1.2 eV to 0.3 eV, the antibonding bands having primarily Ir 5 character with symmetry appear. It is to be noted that there is a large TDOS at , suggesting a metallic phase in contrast to the insulating behavior observed in transport data Fukazawa ; soda .

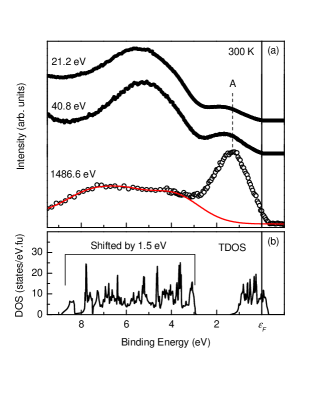
The experimental valence band photoemission spectra at room temperature are shown in Fig. 2(a). The spectra corresponding to ultraviolet (UV) photons (21.2 eV and 40.8 eV) exhibit two distinctly separated features. A dominant intensity appears between 3 - 9 eV binding energies (= - , = energy) and a weak feature, A, near . The intensity pattern becomes drastically opposite in the 1486.6 eV spectrum; the feature A becomes the most intense one compared to the intensity of the other feature. The ratio of the photoemission cross section of Ir 5 states to the O 2 states increases significantly for 1486.6 eV incident photon energy compared to UV energies; the feature A in the figure can therefore be attributed to the photoemission signal from the bands having essentially Ir 5 character. The O 2 features appear above 3 eV binding energy. A rigid shift of the calculated O 2 band by about 1.5 eV towards higher binding energies provides a remarkable representation of the experimental spectra as shown in Fig. 2(b). Such a rigid shift of the completely filled O 2 bands is often observed due to the underestimation of the correlation effects in the band structure calculations ddPRL .
It is clear from Figs. 1 and 2 that O 2 and Ir 5 related features are distinctly separated. Thus, Ir 5 contributions appearing near can be delineated by subtracting the tail of the O 2 band. We have simulated the O 2 contributions using a combination of Lorentzians convoluted by a Gaussian representing resolution broadening as shown by solid line in the case of 1486.6 eV spectrum in Fig. 2(a). The extracted Ir 5 bands are shown in Fig. 3(a) after normalizing to the integrated intensity. The 1486.6 eV spectrum clearly shows different lineshape and energy position compared to the UV spectra. This is demonstrated by overlapping the resolution broadened 21.2 eV spectrum (dashed line) over the 1486.6 eV spectrum. The -ray photoelectrons have larger escape depth than the ultraviolet photoelectrons. Thus, the difference in the 1486.6 eV and UV spectra is attributed to the different bulk and surface electronic structures.
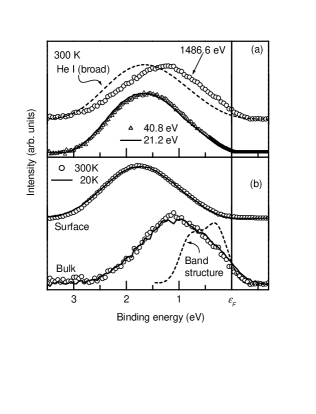
The intensity in the photoemission spectra can be expressed as , where and are the surface and bulk spectra, respectively. is the effective surface layer depth and is escape depth of the photoelectrons. To calculate and , we use = 1.8 and 0.5 for UV and -ray photoemission spectra, respectively as used for several other systems ruthPRBR ; kbmPRB . The extracted surface and bulk spectral functions are plotted in Fig. 3(b). The surface spectrum exhibits a peak around 1.8 eV with no intensity at suggesting insulating character of the surface electronic structure. The bulk spectrum, on the other hand, exhibits a substantial intensity at suggesting metallic phase in addition to an intense peak at around 1 eV.
In order to address the issue of electron correlation among 5 electrons, we compare the surface and bulk spectra with the ab initio results. The dashed line in Fig. 3(b) represents the Gaussian-convoluted (full width at half maximum = 0.3 eV) occupied TDOS at 300 K. The calculated spectrum exhibits a peak at around 0.5 eV, spreading down to about 1 eV binding energy, and it is significantly narrower than the width of the bulk spectra. Since, the electron correlation is significantly underestimated in the band structure calculations within LDA, the difference between the calculated spectrum and the experimental one is often attributed to the electron correlation effects fujimori-review . Thus, the intensities appearing at higher binding energies in the bulk spectrum represent photoemission signal from the correlation induced localized electronic states (lower Hubbard band), and is termed as ’incoherent feature’. The intensities in the vicinity of represent the signature of delocalized electronic states and is termed as ’coherent feature’. The large intensity of the incoherent feature compared to the coherent feature intensity indicates strong electron correlation effects, in sharp contrast to the observations in other Ir compounds bairo3band . Such a strong correlation in the highly extended 5 bands is unusual. The deviation from LDA results is most evident in the surface spectrum. Only the incoherent feature is observed along with a large gap at suggesting a Mott insulating phase corresponding to the two dimensional electronic structure at the surface.
We now focus on the influence of the magnetic phase transition on the electronic structure.
For this purpose, we first discuss the surface and bulk spectra at 20 K shown by solid lines in Fig. 3(b). The surface spectra remain unaffected with the change in temperature. No hard gap is observed in the bulk spectra down to the lowest temperature studied, which evidently rules out the possibility of Mott insulating phase in the bulk even at low temperatures. The lineshape of the 20 K bulk spectrum is very similar to that at 300 K indicating that the magnetic phase transition has insignificant influence if viewed in the energy scale of the figure. However, a closer look near region reveals subtle changes with temperature as described below.
Although the electron correlation effects are manifested in the large energy scale as described above, various thermodynamic properties are essentially determined by the electronic states near (). High energy resolution employed in the present investigation enables to address this issue. We investigate the evolution of the He I spectra near as a function of temperature in Fig. 4(a), which represent the bulk features as the surface spectra exhibit a large gap (see Fig. 3(b)). Normalization of all the spectra at around 200 meV binding energy shows similar line shape down to about 50 meV binding energy at all the temperatures. The spectra in the energy range closer to reveal interesting evolution along with the appearance of a sharp Fermi cut off at low temperatures.
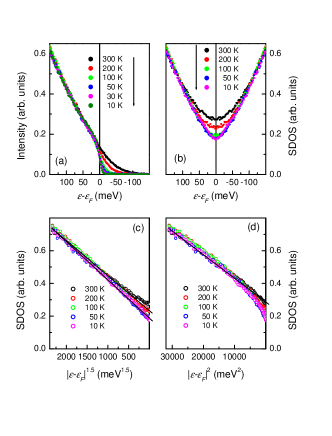
Since the energy resolution is very high and various lifetime broadenings are insignificant in the vicinity of , one can extract the spectral density of states (SDOS) directly from the raw data by symmetrizing the spectra; SDOS = . Thus obtained SDOS shown in Fig. 4(b), provide a good representation of the density of states in this small energy window. There is a dip in SDOS at , which gradually increases with the decrease in temperature down to 100 K. Further reduction in temperature does not show any significant change in the intensity at . It is often observed that the intensity at decreases with the decrease in temperature due to the disorder induced localization of the electronic states at DDdisorder ; kobayashi . In such a case, the DOS at follows (; is temperature) behavior kobayashi ; altshuler-aronov , which is qualitatively different from the behavior in the present case.
In order to investigate the energy dependence of the spectral lineshape, we analyzed SDOS as a function of for different values of . All the spectra could not be simulated for one value of . We show the two extreme cases in Fig. 4(c) and 4(d). The SDOS at 300 K is better represented by = 2 indicating strong influence of electron correlation effect in the electronic structure. This finding may serve as an experimental demonstration of the theoretical prediction of correlation induced effects in a Fermi liquid Correlation . Clearly, disorder does not play a major role as corresponding behavior of = 0.5 is not observed DDdisorder ; kobayashi ; altshuler-aronov . The spectra in the magnetically ordered phase ( 150 K) exhibit a deviation from = 2 behavior and are better represented by = 1.5. High resolution spectra of another 5 compound, BaIrO3, exhibiting ferromagnetic ground state below 183 K is also characterized by = 1.5 bairo3 . Thus, it is clear that electron-magnon coupling irkhin plays a significant role to determine the magnetically ordered states in these highly extended 5 systems.
In summary, we have addressed the issue of electron correlation within 5 band by choosing Y2Ir2O7, a compound belonging to a family of great current interest. A comparison of the electronic structure calculations and the high-resolution photoemission data offers distinct evidence for strong Coulomb correlation among Ir 5 electrons. No hard gap is observed in the bulk spectra down to the lowest temperature studied. The surface spectra exhibit an insulating phase at all the temperatures presumably due to the enhancement of at the surface compared to bulk. Analysis of the spectral lineshape in the vicinity of as a function of temperature emphasizes the need to consider electron-magnon coupling in addition to electron correlation while trying to understand the solid state behavior of the 5 electrons.
We thank K.K. Iyer for his valuable help in preparation and characterization of the sample.
References
- (1) M. Imada, A. Fujimori, and Y. Tokura, Rev. Mod. Phys. 70, 1039 (1998).
- (2) K. Maiti and R.S. Singh, Phys. Rev. B 71, 161102(R) (2005).
- (3) M. Takizawa et al., Phys. Rev. B 72, 060404(R) (2005).
- (4) Li-Shing Hsu, G. Y. Guo, J. D. Denlinger, and J. W. Allen, Phys. Rev. B 63, 155105 (2001).
- (5) R. Eguchi et al., Phys. Rev. B 66, 012516 (2002).
- (6) Kalobaran Maiti, Phys. Rev. B 73, 115119 (2006).
- (7) S. T. Bramwell and M. J. P. Gingras, Science 294, 1495 (2001).
- (8) M. Hanawa et al., Phys. Rev. Lett. 87, 187001 (2001).
- (9) I. Kézsmárki et al., Phys. Rev. Lett. 93, 266401 (2004).
- (10) S. Nakatsuji et al., Phys. Rev. Lett. 96, 087204 (2006).
- (11) Y. Machida, S. Nakatsuji, Y. Maeno, T. Tayama, T. Sakakibara, and S. Onada, Phys. Rev. Lett. 98, 057203 (2007).
- (12) H. Fukazawa and Y. Maeno, J. Phys. Soc. Jpn. 70, 2880 (2001).
- (13) M. Soda, N. Aito, Y. Kurahashi, Y. Kobayashi, and M. Sato, Physica B 329-333, 1071 (2003).
- (14) H. Fukazawa and Y. Maeno, J. Phys. Soc. Jpn. 71, 2578 (2002).
- (15) For example, K. Maiti, P. Mahadevan, and D.D. Sarma, Phys. Rev. Lett. 80, 2885 (1998); K. Maiti et al., Europhys. Lett., 55, 246 (2001).
- (16) We have performed magnetization () studies on our material. exhibits a weak hysteresis at 30 K (i.e., in the magnetically ordered state) around zero magnetic field () and varies rather linearly with at higher fields, without any evidence for saturation. The value of , even at as high as 120 kOe at 30 K, is negligibly small (about 0.02 per formula unit). On the basis of our results, we infer that there is a significant antiferromagnetic component, in addition to a ferromagnetic component.
- (17) P. Blaha, K. Schwarz, G. K. H. Madsen, D. Kvasnicka, and J. Luitz, WIEN2K, An Augmented Plane Wave + Local Orbitals Program for Calculating Crystal Properties (Karlheinz Schwarz, Technical Universit t Wien, Austria, 2001), ISBN 3-9501031- 1-2.
- (18) D.D. Sarma et al., Phys. Rev. Lett. 75, 1126 (1995).
- (19) K. Maiti et al., Phys. Rev. B 73, 052508 (2006).
- (20) D.D. Sarma et al., Phys. Rev. Lett. 80, 4004 (1998).
- (21) M. Kobayashi, K. Tanaka, A. Fujimori, S. Ray, and D. D. Sarma, Phys. Rev. Lett. 98, 246401 (2007).
- (22) P.A. Lee and T.V. Ramakrishnan, Rev. Mod. Phys. 57, 287 (1985); B.L. Altshuler and A.G. Aronov, Solid State Commun. 30, 115 (1979).
- (23) A.F. Efros and B.I. Shklovskii, J. Phys. C 8, L49 (1975); J.G. Massey and M. Lee, Phys. Rev. Lett. 75, 4266 (1995).
- (24) K. Maiti, R.S. Singh, V. R. R. Medicherla, S. Rayaprol, and E.V. Sampathkumaran, Phys. Rev. Lett. 95, 016404 (2005).
- (25) V.Yu Irkhin, M.I. Katsnelson, and A.V. Trefilov, J. Phys.: Condens. Matter 5, 8763 (1993); V.Yu Irkhin and M.I. Katsnelson, J. Phys.: Condens. Matter 2, 7151 (1990).