Defects Can Increase the Melting Temperature of DNA-Nanoparticle Assemblies
Abstract
DNA-gold nanoparticle assemblies have shown promise as an alternative technology to DNA microarrays for DNA detection and RNA profiling. Understanding the effect of DNA sequences on the melting temperature of the system is central to developing reliable detection technology. We studied the effects of DNA base-pairing defects, such as mismatches and deletions, on the melting temperature of DNA-nanoparticle assemblies. We found that, contrary to the general assumption that defects lower the melting temperature of DNA, some defects increase the melting temperature of DNA-linked nanoparticle assemblies. The effects of mismatches and deletions were found to depend on the specific base pair, the sequence, and the location of the defects. Our results demonstrate that the surface-bound DNA exhibit hybridization behavior different from that of free DNA. Such findings indicate that a detailed understanding of DNA-nanoparticle assembly phase behavior is required for quantitative interpretation of DNA-nanoparticle aggregation.
Introduction
DNA-capped nanoparticle solutions, which self-assemble to form disordered aggregates, have been shown to exhibit interesting phase behavior 1, 2, 3, 4, 5, 6. In these systems, the cluster networks are held together by non-covalent interactions, therefore, the aggregation process is reversible. Unlike free DNA duplexes, which show a broad transition from double- to single-stranded DNA, the DNA-nanoparticle assemblies formed here exhibit a sharp transition from aggregated to dispersed phase 2, 4, 6, 7, indicating that melting of the assembly is not simply a DNA duplex melting process. In addition, these surface-bound DNA exhibit unusual phase behavior that deviates from that of the free DNA.
Due to the color change induced by aggregation, DNA-nanoparticle assemblies have been proposed for use in DNA detection in medical research, diagnosis of genetic disease, and biodefense 8, 9, 10, 11, as well as an alternative technology to DNA microarrays (genechips) 12 and single-molecule sequencing 13. This nanoparticle technology relies on differentiation in DNA hybridization efficiency. In this system, single strands of DNA are functionalized with an alkanethiol group to bind with gold nanoparticles. Introducing a specific linker DNA results in aggregation and a visible color change. The aggregation and melting of these assemblies are influenced by many parameters, including nanoparticle size 2, DNA sequence 5, 7 and length 14, 6, 1, interparticle distance 14, 7, and electrolyte concentration 1.
Furthermore, self-assembly of DNA-capped gold nanoparticles has potential to be used for detecting single-base defects 15, 14. These experiments showed that certain single-base defects, such as a one base mismatch or deletion, result in DNA-nanoparticle assemblies with lower melting temperatures () than assemblies formed using a fully complementary linker. Thus, by heating DNA-nanoparticle aggregates formed with various linkers to just below the of their fully complementary counterpart, it is possible to differentiate solutions containing a complementary linker (target) from those with a single-base mismatch. Theory also suggests that it is possible to detect multiple targets in one solution by examining the phase behavior of the system 4, 16, 3. These technologies assume that introducing defects results in assemblies with lower than their fully complementary counterparts 17, 18. While this assumption holds true for free DNA, it is not directly applicable to surface-bound DNA. An anomaly in trend has been observed in the DNA-nanoparticle system 5, which indicates that the details of DNA base pairing play an important role in the phase behavior of these nanoparticle systems. Therefore, it is crucial to understand exactly how the microscopic binding behavior of DNA sequences is mapped onto the macroscopic phase behavior of DNA-nanoparticle solutions for proper quantification of data. Here we report experimental observations of unusual phase behavior in the DNA-nanoparticle system. Sequence-dependent defects, such as base-pair mismatches and deletions, were introduced, and trend of the assemblies different from that of the free DNA has been frequently observed.
Experimental Section
DNA-capped gold nanoparticles were synthesized and analyzed using methods described in Refs.[2,5]2, 5. Briefly, two noncomplementary, single-stranded DNA were functionalized with alkanethiol groups at their ends, to be used as probes. Probe DNA were purified by HPLC (Invitrogen) and prepared in 0.3 M NaCl, 0.01 M phosphate buffer (pH 7). DNA-nanoparticle probes are synthesized by saturating the surface of colloidal gold particles (Sigma), 10 nm in diameter, with functionalized probe DNA. Salt was filtered using NAP-5 or NAP-10 columns, to prevent the colloidal gold particles from irreversible aggregation. 24 hours after mixing the gold nanoparticles and DNA probes, the solution was centrifuged at 13,200 rpm to remove excess DNA. Approximately 8 l of linker DNA solution (710-6 M in 0.3 M NaCl, 0.01 M PBS (pH 7)) was added to 400 l of mixed probe solution (41017 particles/l) and allowed to aggregate for several days at 4 ∘C. The concentration was chosen such that the is independent of linker concentration.
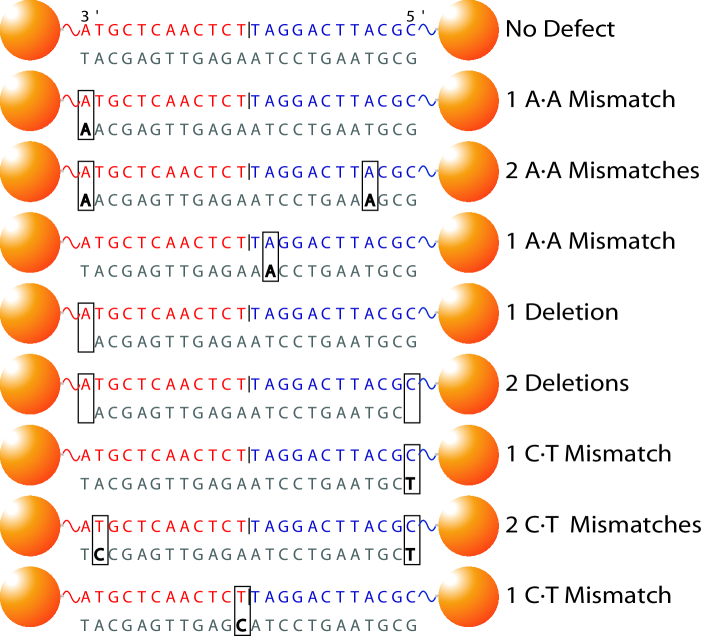
Nanoparticle assemblies were formed using linkers with either perfectly matched sequences or with various defects such as mismatches and deletions. The base pairs found in the usual double-stranded DNA are the Watson-Crick base pairs (AT and CG), because their geometry allows any sequence of base pairs to fit into a nucleic acid sequence without distortion 19. Defects in the current study include i) mismatched base pairs, and ii) deletions, on or near the surface, or near the mid-point between two particles (see Fig. 1). Melting of corresponding sequences of free DNA, which are not attached to gold nanoparticles, were measured for comparison. Melting of DNA-nanoparticle aggregates is observed using optical absorption spectroscopy at 260 nm while solutions are heated at a constant rate of 1 ∘C/min.
Results and Discussion
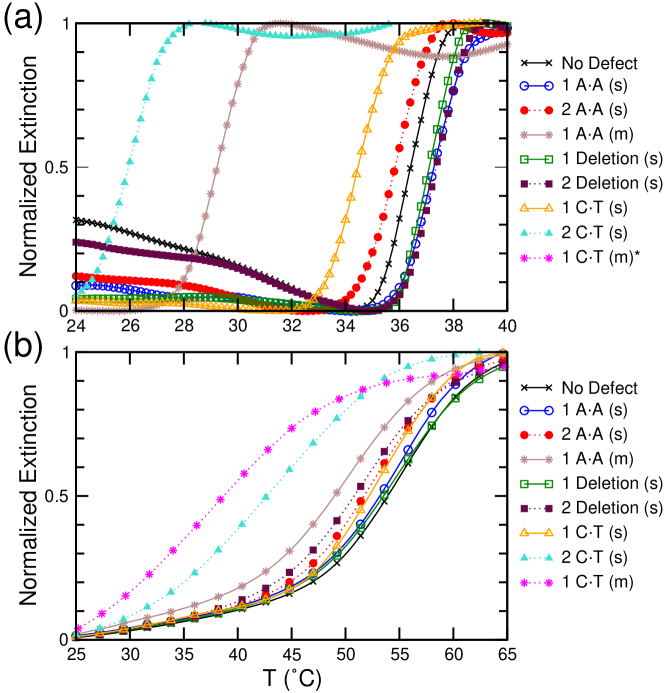
Representative melting curves for nanoparticle assemblies using linkers with specific defects are shown in Fig. 2(a). Melting curves for corresponding free DNA duplexes are given by Fig. 2(b). We found that, unlike the effect of defects on the free DNA, where mismatches and deletions always lower the , some defects increase in the DNA-nanoparticle assemblies. For example, an AA mismatch on the surface has a of 36.1 ∘C, which is higher then the perfectly complementary of 35.2 ∘C, while the corresponding mismatch in a free DNA lowers from 55.0 ∘C to 54.3 ∘C (see Table 1).
| (∘C) | (∘C) | ||||
|---|---|---|---|---|---|
| Defect Type | Free | Bound | Free | Bound | Deviation |
| No Defect | 55.0 | 35.2 | |||
| 1 AA (s) | 54.3 | 36.1 | 0.7 | 0.9 | 1.6 |
| 2 AA | 52.1 | 34.7 | 2.9 | 0.5 | 2.4 |
| 1 AA (m) | 49.9 | 28.3 | 5.1 | 6.9 | 1.8 |
| 1 Deletion (s) | 54.4 | 35.9 | 0.6 | 0.7 | 1.3 |
| 2 Deletion (s) | 51.2 | 36.4 | 3.8 | 1.2 | 5.0 |
| 1 CT (s) | 53.3 | 33.3 | 1.7 | 1.9 | 0.2 |
| 2 CT | 44.4 | 25.1 | 10.6 | 10.1 | 0.5 |
| 1 CT (m) | 38.9 | 7.4 | 16.1 | 27.8 | 11.7 |
Change in melting temperature of DNA duplex with defect
compared to corresponding perfectly matched DNA sequence, = (defect)(no defect).
Free DNA.
Particle-bound DNA aggregates.
Deviation in of particle-bound DNA versus free DNA.
Indicating defects located on surface.
Indicating defects located near midpoint between two particles.
The unusual trend in may be explained by a crowding effect on the particle surfaces. Replacing a paired base with a mismatched base allows flexibility in the dangling base (“A” in this case) to adjust its position and form non-specific binding with the particle surface, which increases the of the system, as observed. In fact, Coulomb blockage is responsible for much of the deviation in DNA hybridization thermodynamics on surfaces 20. To further investigate this effect, we obtained of a system with a “T” base deleted from the linker sequence while keeping the interparticle distance constant (see Fig. 1). We found that such a deletion results in a change of 0.7 ∘C in the nanoparticle system versus 0.6 ∘C for free DNA, which is consistent with our explanation that deletion of a DNA base at the end (surface) reduces electrostatic repulsion and, therefore, increases the .
To examine if these effects are base-dependent, we measured the of a system with one CT mismatch on the surface. Our results showed that such a defect lowers the (1.9 ∘C) relative to perfectly complementary particle assemblies, which is similar to the effect observed in free DNA (1.7 ∘C). This base-dependence effect (difference between AA and CT) may be understood in terms of recent experimental results of the binding energy of single DNA bases on gold surfaces 21, 22. It was discovered that DNA bases interact with gold surfaces with increasing strength as T C A G, with the T base interacting much more weakly than the others. Thus for an AA mismatch near the particle surface, the non-specific binding between the mismatched A base and the surface is stronger than that between the T base of the complementary AT base pair and the surface. On the other hand, the energy contribution from the binding of a mismatched T base to the particle surface is known to be much weaker, and thus does not create more efficient hybridization compared with a complementary linker. In addition, the energy loss of a disruption of a CG pair is more than that of an AT pair. Hence, a CG mismatch will likely result in an overall decreased . It is also possible that, due to the nonspecific binding of the end base to the particle surface, the DNA bases near the surface are partially denatured and do not form base pairs even when the bases are complementary. This may explain the small increase in when replacing a complementary base at the surface with a mismatched base.
Sequence dependence effects can also be seen in systems with single base deletions. This is evidenced by comparing the effects of deleting a T base from the sequence used here with those seen when deleting a T base from a much different sequence. It has previously been observed that a T base deletion may lead to a lowering of 5. In this study, however, a deletion of a T base results in higher . One difference is that the dangling base after the first deletion is an A versus a T 5. As mentioned above, the A base binds to the particle surface much more strongly than the T base, which may contribute to the increase in the sequence used here.
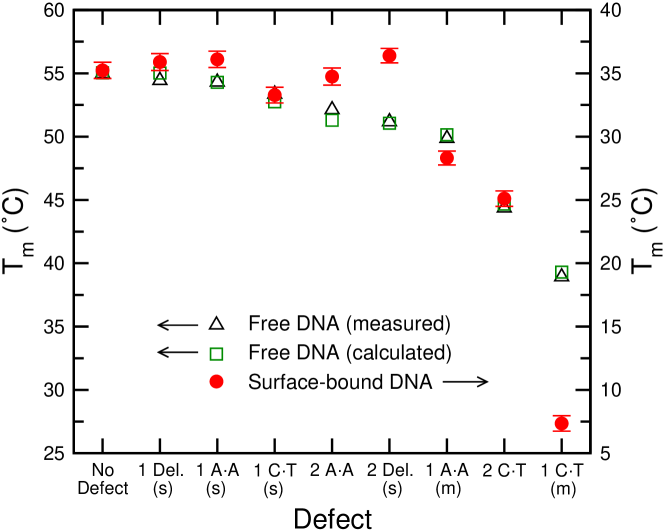
The for free DNA and DNA-nanoparticle assemblies for all defects are shown in Fig. 3. for free DNA were calculated with methods detailed in Ref.[5]5, using thermodynamic parameters for base pairs that incorporate nearest neighbor interactions 23, 24, 25, 26.
| (1) |
Where and are the enthalpy and entropy, respectively, is the gas constant, [Na+] and [DNA] are Na+ and DNA concentrations. Figure 3 shows that the experimentally observed free DNA is well described by these parameters. The and errors given for the DNA-nanoparticles system are calculated averages and one standard errors from repeated experiments. Comparing trends in , it is clear that while decreases with defect for the free DNA system, it increases for specific defects in the DNA-nanoparticle system.
To test if more than one mismatched or deleted base would contribute to the detection signal, we prepared systems with two AA or CT mismatched bases, or two deleted bases (see Fig. 1). The particle system formed aggregates in the presence of these defects. Again we found that may be higher or lower relative to the complementary system, depending on the specific defect, and that changes in are not always predictable from the free DNA system (see Fig. 3). Among all defect types studied, the system with two deletions on the surfaces has the highest , as well as the largest deviation in from its free DNA counterpart. While two mismatched AA bases near the particle surfaces create a system with lower compared to the complementary one (0.5 ∘C), the deviation from its free DNA counterpart is significant (2.4 ∘C). This observation indicates that even two base defects may contribute significantly to the signal, which should be taken into account for quantitative analysis of RNA or DNA profiling. The physical explanation for this finding is similar to that of the one-base defect, with the magnitude relying on the detailed composition of the bases involved in the process.
Mismatches at or near the midpoint of the DNA connection, however, produce very different effects from those near the surface. We found that an AA or a CT mismatch in the middle of a linker lowers the for both free and bound DNA. Since both the free and surface-bound DNA have the same terminal effect, the stronger effect of bound-DNA indicates that the effect is amplified in this system. For example, a CT mismatch in the middle significantly lowers the for both free and particle-bound DNA, with the bound DNA taking several days to form detectable aggregates at 4 ∘C (see Fig. 3). Part of the effect can be attributed to the fact that the mismatched base does not result in non-specific binding to the particle surface due to its location, and thus the only effect is the weakening of the DNA duplex due to the defect. However, the change in cannot be explained simply by the fact that there is no surface compensation of the binding energy, since the second mismatches we introduced in the two mismatch systems have defects near but not on the surface. The second AA mismatch is located at the forth base and the second CT mismatch is located at the second base from the surface. These defects do not result in a trend similar to those with mismatches in the middle. The stronger than expected effect of the CT base-pair mismatch in the middle implies a strong cooperative effect of the particle system that may stem from the same origin as the asymmetric bond length disorder of the system 5. We believe that the location of the defect, which influences the local binding energy distribution, has an impact on the overall stability of the aggregates.
Similar to our observations for DNA-nanoparticle assemblies, discrepancy in trends between free and surface-bound DNA has also been observed in DNA microarrays. DNA microarrays exploit sequence dependent DNA hybridization in order to quantitatively determine the level of gene expression in a sample. In some DNA microarrays, for every DNA probe that is used, a sequence differing by a single base mismatch is also included in order to determine the amount of non-specific binding that has occurred 12. However, experimental use of these microarrays has uncovered that, in many instances, mismatched probes result in more efficient hybridization than fully complementary probes 27, 28. Our results indicate that when differentiating between a perfectly complementary linker and those with single- or double-base mismatches, careful characterization of the behavior of the particle system is required for quantitative analysis of the results.
The fact that may be higher or lower then the fully complementary counterpart when there is a base-pairing defect in the DNA sequences implies that, while DNA-nanoparticle assemblies can distinguish fully complementary linkers from sequences with defects, quantification of single-base mismatches or deletions may not be generalized without detailed characterization of each specific defect. This unusual phase behavior cannot be predicted by DNA hybridization energy alone, because surface and cooperative effects influence as well. Both the type and the location of defects play an important role in the macroscopic behavior of the system. Once fully characterized, the results may be used to increase detection sensitivity by choosing DNA sequences with defects known to increase .
Conclusions
In conclusion, our results demonstrate that the phase behavior of DNA-nanoparticle solutions is sensitive to defects in DNA base-paring. This has implications for the design of new DNA detection technology, to include DNA-nanoparticle assemblies and DNA microarrays. DNA-nanoparticle assemblies remain a promising DNA detection technology as well as a system with easily controllable parameters for studying the behaviors of complex fluids. The complexity of the system should allow us to probe interesting physics and chemistry that is not otherwise present in a less controlled system such as a gel. The system also provides an opportunity for investigating how a local, microscopic perturbation affects the macroscopic properties of the system.
Acknowledgments
We thank the support from NSF DMR-0505814, NIH 1 T90 DK70121-01,
and the Hamill Innovation Fund.
References
- 1 Jin, R.; Wu, G.; Li, Z.; Mirkin, C. A.; Schatz, G. C. J. Am. Chem. Soc. 2003, 125, 1643–1654.
- 2 Kiang, C.-H. Physica A 2003, 321, 164–169.
- 3 Park, S. Y.; Stroud, D. Phys. Rev. B 2003, 67, 212202-1–4.
- 4 Lukatsky, D. B.; Frenkel, D. Phys. Rev. Lett. 2004, 92, 068302-1–4.
- 5 Harris, N. C.; Kiang, C.-H. Phys. Rev. Lett. 2005, 95, 046101-1–4.
- 6 Sun, Y.; Harris, N. C.; Kiang, C.-H. Physica A 2005, 354, 1–9.
- 7 Sun, Y.; Harris, N. C.; Kiang, C.-H. Physica A 2005, 350, 89–94.
- 8 Kushon, S. A.; Bradford, K.; Marin, V.; Suhrada, C.; Armitage, B. A.; McBranch, D.; Whitten, D. Langmuir 2003, 19, 6456–6464.
- 9 Hill, A. A.; Hunter, C. P.; Tsung, B. T.; Tucker-Kellogg, G.; Brown, E. L. Science 2000, 290, 809–812.
- 10 Zhou, B.; Wirsching, P.; Janda, K. D. Proc. Natl. Acad. Sci. USA 2002, 99, 5241–5246.
- 11 Liu, J.; Lu, Y. Anal. Chem. 2004, 76, 1627–1632.
- 12 Lipshutz, R. J.; Fodor, S. P. A.; Gingeras, T. R.; Lockhart, D. J. Nature Gen. 1999, 21, 20–24.
- 13 Austin, R. H.; Brody, J. P.; Cox, E. C.; Duke, T.; Volkmuth, W. Phys. Today 1997, 50, 32–38.
- 14 Storhoff, J. J.; Elghanian, R.; Mucic, R. C.; Mirkin, C. A. J. Am. Chem. Soc. 1998, 120, 1959–1964.
- 15 Taton, T. A.; Mirkin, C. A.; Letsinger, R. L. Science 2000, 289, 1757–1760.
- 16 Lukatsky, D. B.; Frenkel, D. J. Chem. Phys. 2005, 122, 214904-1–11.
- 17 Singh, N.; Singh, Y. Phys. Rev. E 2001, 64, 042901-1–4.
- 18 Wattis, J. A. D.; Harris, S. A.; Grindon, C. R.; Laughton, C. A. Phys. Rev. E 2001, 63, 061903-1–11.
- 19 Bloomfield, V. A.; Crothers, D. M.; Tinoco, I., Eds.; Nucleic Acids: Structures, Properties, and Fucnctions; University Science Books: California, 2000.
- 20 Vainrub, A.; Pettitt, B. M. Phys. Rev. E 2002, 66, 041905-1–4.
- 21 Demers, L. M.; Ostblom, M.; Zhang, H.; Jang, N. H.; Liedberg, B.; Mirkin, C. A. J. Am. Chem. Soc. 2002, 124, 11248–11249.
- 22 Strohoff, J. J.; Elghanian, R.; Mirkin, C. A.; Letsinger, R. L. Langmuir 2002, 18, 6666–6670.
- 23 Sugimoto, N.; Nakano, S.; Yoneyama, M.; Honda, K. Nucleic Acids Res. 1996, 24, 4501–4505.
- 24 Bommarito, S.; Peyret, N.; SantaLucia Jr., J. Nucleic Acids Res. 2000, 28, 1929–1934.
- 25 Peyret, N.; A, S.; Allawi, H. T.; SantLucia Jr., J. Biochemistry 1999, 38, 3468–3477.
- 26 Allawi, H. T.; SantaLucia Jr., J. Nucleic Acids Res. 1998, 26, 2694–2701.
- 27 Naef, F.; Lim, D. A.; Patil, N.; Magnasco, M. Phys. Rev. E 2002, 65, 040902(R)-1–4.
- 28 Hekstra, D.; Taussig, A. R.; Magnasco, M.; Naef, F. Nucleic Acids Res. 2003, 31, 1962–1968.