Coma cluster object populations down to M ††thanks: Based on observations obtained at the Canada-France-Hawaii Telescope (CFHT) which is operated by the National Research Council of Canada, the Institut National des Sciences de l’Univers of the Centre National de la Recherche Scientifique of France, and the University of Hawaii.
Abstract
Context. This study follows a recent analysis of the galaxy luminosity functions and colour-magnitude red sequences in the Coma cluster (Adami et al. 2007).
Aims. We analyze here the distribution of very faint galaxies and globular clusters in an east-west strip of arcmin2 crossing the Coma cluster center (hereafter the CS strip) down to the unprecedented faint absolute magnitude of M.
Methods. This work is based on deep images obtained at the CFHT with the CFH12K camera in the B, R, and I bands.
Results. The analysis shows that the observed properties strongly depend on the environment, and thus on the cluster history. When the CS is divided into four regions, the westernmost region appears poorly populated, while the regions around the brightest galaxies NGC 4874 and NGC 4889 (NGC 4874 and NGC 4889 being masked) are dominated by faint blue galaxies. They show a faint luminosity function slope of -2, very significantly different from the field estimates.
Conclusions. Results are discussed in the framework of galaxy destruction (which can explain part of the very faint galaxy population) and of structures infalling on to Coma.
Key Words.:
galaxies: clusters: individual (Coma); galaxies: luminosity functions1 Introduction
A few ultra deep (R of at least 25) luminosity functions (LFs) have become available in the literature for the Coma cluster (Bernstein et al. 1995: B95 or Milne et al. 2007: M07) but only in small fields. Recent large scale surveys for Coma are limited to much brighter magnitudes (e.g. Lobo et al. 1997, Trentham 1998, Terlevich et al. 2001, Andreon Cuillandre 2002, Beijersbergen et al. 2002, Iglesias-Páramo et al. 2003).
Ultradeep LFs sample the Coma cluster population down to the limit of what can be called galaxies and then include large populations of globular clusters. This is also shown by M07, who considered a catalog of objects detected along the Coma cluster line of sight down to R25.75. Among this population, the objects belonging to the Coma cluster are M systems. This corresponds to galaxies with a mass similar to that of globular clusters, and sometimes even smaller. The formation of such systems (that would not be globular clusters) remains quite puzzling and could e.g. be related to formation processes of tidal dwarf galaxies (e.g. Bournaud et al. 2003). This raises the question of galaxy formation in clusters from material coming from other already existing galaxies and the question of the globular cluster removal from their parent galaxies. It also relates to the cluster ability to influence the different giant galaxy types (e.g. Boselli et al. 2006) that will contribute in different ways to the formation of these very faint dwarf galaxies. A nice example of such very faint objects torn off from galaxies infalling into massive clusters can be found in Cortese et al. (2007).
To initiate the formation processes of such faint systems, material needs to be expelled from existing galaxies by several internal (e.g. gas expulsion via supernova winds) or external (tidal disruptions, harrassment, …) processes. At least external processes are driven by environmental effects that act at the cluster scale. In order to test these scenarios, we therefore need surveys with such large characteristic scales. However, up to now these ultra-deep surveys were limited to very small areas (a few to a few tens of arcmin2 for M07 and B95 respectively), which is a limitation to study possible environmental effects in the Coma cluster.
In order to fill this lack of a large ultradeep field on Coma, we added several pointings from our previous deep multiband survey made at CFHT (Adami et al. 2005 (A05), 2006 (a and b: A06a and b), and 2007 (A07)) which have a subarea in common. The resulting field of view of this new dataset combination (7 arcmin2 or 300 arcmin2) is large enough to study possible environmental effects and deep enough (R25.5) to reach the very faint object populations in the globular cluster regime.
Section 2 presents our data and methods. Luminosity functions are computed in Section 3. We discuss the nature of the faintest objects statistically in the Coma cluster in Section 4 and give conclusions in Section 5. All along that paper we use the following cosmological parameters: H0 = 71 km s-1 Mpc-1, and . The resulting Coma distance modulus is 34.98.
2 Data
2.1 Images and catalogs
The Coma cluster images are described in detail in A06a. The set of data was made of two deep 4230 arcmin2 fields observed at the CFHT 3.6 m telescope with the CFH12K camera: one covering the north and the other the south part of Coma. Each field was observed in the B, V, R, and I CFHT filters (u* band data is presently being acquired with the Megacam camera) and magnitudes were derived in the Vega system.
These observations had an overlap of arcmin2 in the form of a horizontal central strip (CS) crossing the Coma cluster from East to West. The CS covers the =[194.51,195.32] and =[27.93,28.06] rectangle. In the CS the exposure time was therefore at least doubled compared to the A06a data. We took advantage of this to compute deep B, V, and I images. We also computed a very deep R band image in the CS by co-adding (in addition to the north and south fields) a south R CFH12K image not used in A06a. The resulting exposure times in the CS are given in Table 1. Only the western field of Fig. 3 in R has a lower exposure time of 10800sec due to a CCD not available during the observations of the additionnal south R CFH12K image.
| Band | Exposure time (s) | Completeness magnitudes | Seeing |
|---|---|---|---|
| B | 14400 | 25.25 | 1.07 |
| V | 7440 | 24.75 | 1.00 |
| R | 14100/10800 | 25/24.7 | 0.90 |
| I | 14400 | 24 | 0.90 |
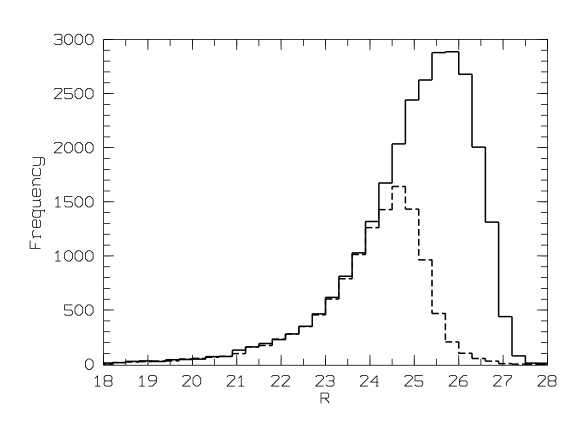
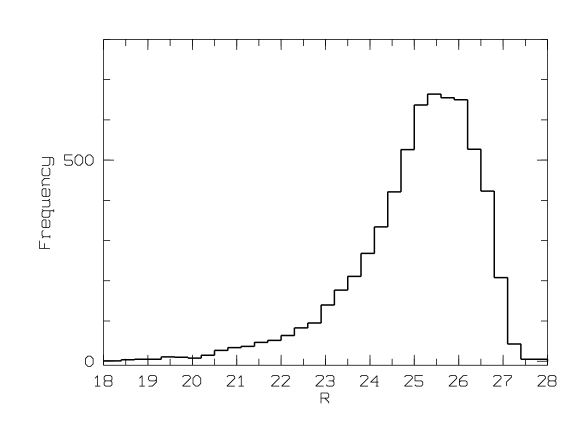
We extracted catalogs of objects using the SExtractor package (Bertin Arnouts 1995) as in A06a. However, we chose a lower threshold and minimal significant area: at least 3 pixels above a 1.1 sigma level, in order to detect objects with the lowest possible S/N. We also removed from the sample all objects with a size given by SExtractor smaller than 1 pixel (0.206 arcsec). We show in Fig. 1 the resulting R-band magnitude histograms. The histogram peaks at R=25.5 for the whole CS R band image. However, the western field has an exposure time lower by 30. We therefore also plot the western field counts in Fig. 1; this confirms that the western field is slightly shallower. We also show in Fig. 1 the A07 counts in the CS region. We will discuss the completeness levels more precisely in section 2.3.
We plot in Fig. 2 the R central surface brightness () versus the R band total magnitude for the present catalogs (whole CS and western field of the CS) and the A06a catalog. In addition to Fig. 1, this illustrates well the gain in depth for both total magnitudes and compared to A06a. To be conservative, we chose to limit all the present catalogs to =25.7 to be sure not to undersubtract the field contribution.
Finally, we applied the same masking pattern as in A07 to avoid CCD defects and regions heavily polluted by diffuse light from objects brighter than R=18 in the surrounding region (areas of 2 times the radius of these objects were removed from the data).
We compared our Coma data with a 1deg2 field already described in A07 and McCracken et al. (2003): the so-called F02 field. This field was observed with the same telescope and camera, in the same magnitude bands, and with similar exposure times and seeing, as already stated in A07. We did not use the other comparison field (F10) because it was not deep enough in all magnitude bands compared to the present Coma cluster data. New catalogs were extracted from the F02 field using the same extraction parameters previously described, in order to be homogeneous with the present Coma catalogs.
2.2 Star galaxy separation
Star-galaxy separation was made like in A06a, from the central surface brightness versus total magnitude diagram (Fig. 2). We classified as stars all objects brighter than R=21.2 and with a central surface brightness brighter than 0.95R + 1.35 (these objects are already removed from Fig. 2 where we only show the separation line between galaxies and stars).
We show in A06a that this method allows to efficiently remove stars from the catalogs down to R21, as it optimally separates the star and galaxy sequences in the total magnitude versus central surface brightness plot. Fainter objects were assumed to be galaxies (or globular clusters) because we also showed that the star contribution becomes very small at R21.
The star-galaxy separation has, however, a minor influence on our results since the bright end of our luminosity function will be chosen at R=21 (see below).
2.3 Completeness
A usual way to estimate the completeness level of a catalog is by comparison to a significantly deeper catalog. In A06a, we compared for example our data to the B95 catalog. Such a comparison is not efficient here because the R band CS image is now at least as deep as the B95 image and we would need a significantly deeper reference. The M07 catalog offers such a deeper catalog but the field of view in common with our data is far too small to give robust results.
We apply instead the same method as in A07 (see their Fig. 6), based on the total magnitude versus central surface brightness diagrams. In a few words, we first consider a magnitude range bright enough to be sure to detect all objects (galaxies, stars, and globular clusters) whatever their surface brightness (R23.5). We then consider the upper envelope of the central surface brightness of the object population as a function of total magnitude (inclined green lines in Fig. 2 for the R band). Second, we define the central surface brightness limit of our survey (horizontal green lines in Fig. 2). As shown in A07, the intersection between these two lines gives a good (and conservative for compact objects as elliptical galaxies or globular clusters) estimate of the catalog completeness level whatever the object type. This was done both for the whole CS and for the western field. These levels are summarized in Table 1. We note that the R band image is complete down to fainter magnitudes for compact objects (around R25.5 as suggested by Fig. 1).
3 Luminosity functions
We limited our study to the very faint part of the LF (R21). Brighter magnitudes were extensively investigated in A07 and we want to focus here on objects that are potentially created in the cluster from material expelled from already existing galaxies. A candidate population is tidal dwarf galaxies and the limit of R=21 corresponds approximately to their bright end (A06b).
We also only computed LFs in the R band because it is the only band reaching a depth of R=25, and comparable to ultra-deep surveys such as M07 or B95. The other bands (B and I) will only help to characterise the faint Coma cluster object populations.
3.1 Luminosity function computation
We have the same statistical approach as in A07. Briefly this consists in estimating the fore and background contributions along the Coma line of sight by using a comparison field. We then have access to the number of galaxies inside the Coma cluster as a function of R magnitude N(R) with the following expression:
N(R) = N(R) - N(R)
where N(R) and N(R) are the numbers of galaxies along the Coma cluster and along the empty field lines of sight, respectively, as a function of R magnitude.
Error bars on the counts were computed with the same method as in A07, taking into account magnitude uncertainties, Poisson noise and cosmic variance. Cosmic variance was treated using the Huang et al. (1997) formalism with the galaxy correlation function and the field galaxy luminosity function in the F02 comparison field as entry parameters.
3.2 Results
We arbitrarily divided the CS into 4 sub-regions of 10 arcmin width in right ascension to study environmental effects. This was a compromise between the field size and population richness. The four regions are drawn in Fig. 3 as well as the objects detected down to R=25.5. The Coma cluster LFs for the four subfields are displayed in the same figure.
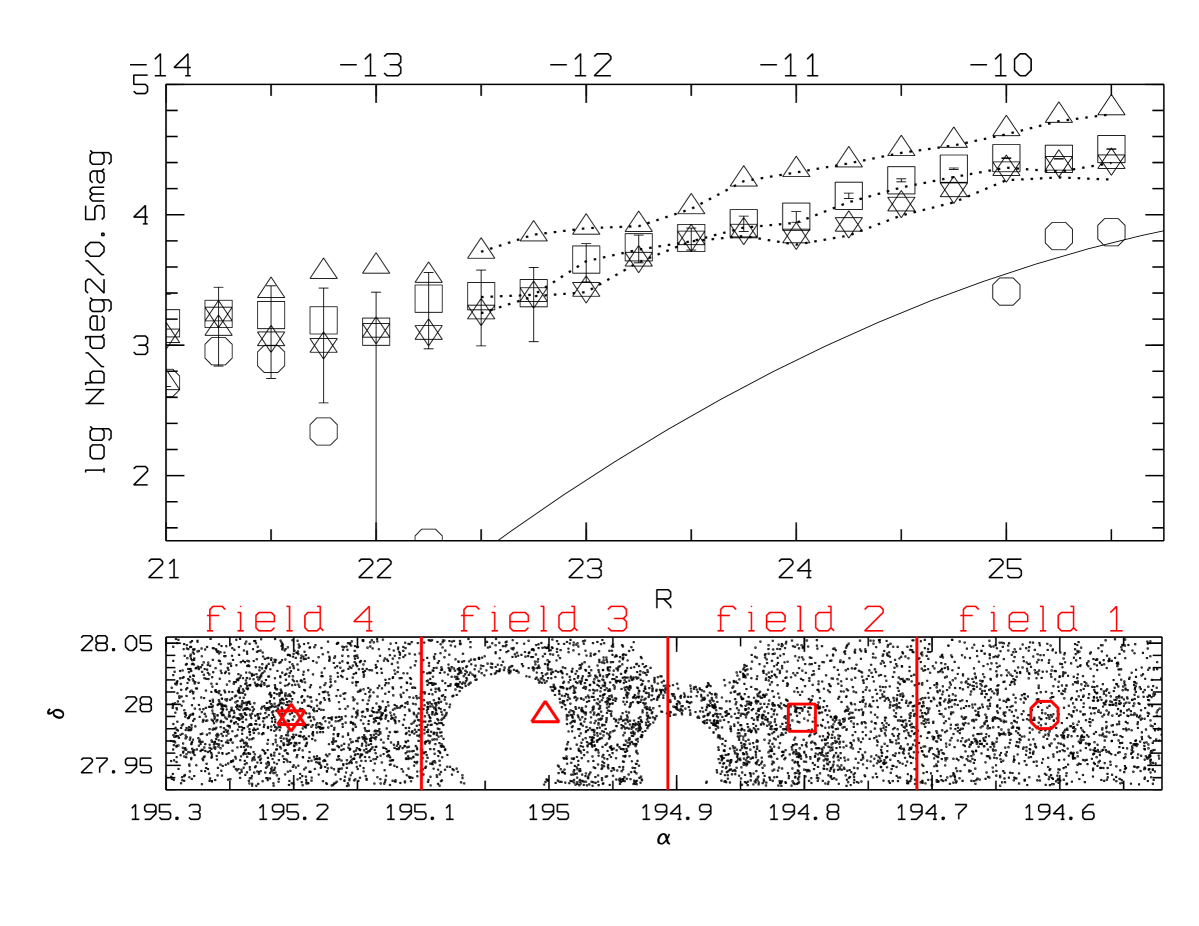
The general behavior of the LFs is similar to the results shown in A07: a very poor LF in the western field and growing and richly populated LFs in the other three fields. The fact that the western field has a shallower completeness level does not affect this conclusion, since the western field LF is still very poor for R brighter than 24.7, where the data are complete. The western field only shows numerous objects at the faint end of the LF. The three other fields exhibit LFs with a very regular slope. Before globular cluster subtraction, a power law model gives slopes of -1.90.05, -2.00.05, and -1.90.05 from East to West respectively; these slopes are quite similar to that given by M07 for data of similar depth in a very central region of the cluster (0.33), but steeper than the slope fitted by B95 (0.05). The comparison field used in this paper is significantly larger than those used by M07 and B95; therefore, we expect our slopes to be more reliable than those obtained in previous studies. The values of our slopes are different from what was seen for magnitudes brighter than R=21 in A07 where several dips were detected. We will discuss below this difference in terms of external processes acting on galaxies. We note that the bright parts of the CS LFs connect well with the faint parts of the A07 LFs in comparable areas.
4 Discussion
4.1 Nature of the faintest Coma cluster objects: are they globular clusters?
We detected a very large population of objects as faint as M. Globular Clusters (hereafter GCs) have comparable magnitudes and we must first estimate the intergalactic GC contribution to these counts as the question of the nature of the faintest cluster objects is recurrent. We discuss here the hypothesis of a faint Coma cluster population dominated by GCs.
Our data are, by definition, free of GCs close to their parent bright galaxies because we rejected all regions closer than twice the radius of all galaxies brighter than R=18. This strongly limits the GC contamination shown for example in B95. However, intergalactic GCs or GCs distant from galaxy centres can still be present, as demonstrated by Rhode Zepf (2004: RZ04). According to these authors, the GC number density profile could have a small (but non negligible) contribution to number counts outside the regions masked in our analysis.
If we apply our masking to the RZ04 M86 data, we find that the remaining GCs (distant from their parent galaxy) are 80 times less numerous than the whole population. In order to estimate a GC LF in our fields, we assumed the M86 population of GCs to be typical of all galaxies brighter than R=18 in the Coma CS. It will only be used to give us a rough estimate of the GC LF. Then, rescaling the surface densities to the Coma cluster distance, we were able to generate the GC LF shown by the continuous line in Fig. 3. This estimate neglects the GC population coming from galaxies fainter than R=18. However, galaxies just brighter than R=18, and therefore very significantly fainter than M86, also have a lower GC richness compared to this galaxy. This compensates at least partially the first underestimate.
On the one hand, we show that GCs can explain a large part of the object counts in the western field (Fig. 3). This does not mean that this field is only populated by intergalactic GCs at magnitudes fainter than R=25, but that we can not exclude that a large part of the faint object population in this field could be GCs. We have, however, to take into account the fact that at these faint magnitudes, the western field data are becoming incomplete and that the easiest objects to detect are globular clusters because they have a compact shape.
On the other hand, the three other fields have a faint object population that is clearly more numerous than the population of GCs predicted using the M86 data. This probbaly means that these three fields do not have a high level of GCs compared to their overall very faint galaxy population. Subtracting the estimated GC LF to the overall LFs does not even allow to completely flatten the slope (see dotted lines in Fig. 3). This is consistent with the results of A07 who have shown that only the NGC 4874 field has a significant population of objects that could be intergalactic GCs. Evidence for this last significant population was only given for B24.75 and our B and V data are not deep enough to generalize this study down to R=25.5.
In conclusion, the very faint object population in the three eastern fields is probably dominated by galaxies.
4.2 Faint end of the galaxy luminosity functions
We confirm (compared to A07) that the western part of the Coma cluster is very poorly populated, with less than 30 objects per deg2 and per half magnitude bin down to R=25. Even for fainter magnitudes, the level remains lower (around 4000 objects per deg2 and per half magnitude) than the populations in the other fields. We have previously shown that these objects are unlikely to be galaxies for a large part. This subfield is included in what we called the South area in A07 and it was probably at least partially depopulated in terms of galaxies by major matter infalls coming from the West (see also A07).
LFs in the three other subfields are confirmed (compared to A07) to be strongly rising with slopes close to . This implies the existence of a very large population of dwarf galaxies in these regions and shows that the LF in the central part of the Coma cluster is very significantly different from the field LFs (e.g. Ilbert et al. 2005). This also shows that peculiar processes are at work to form or to concentrate at this place such a large amount of faint objects.
We know that at least part of the faint Coma cluster dwarves (low surface brightness objects, see A06b) were probably formed in the early stages of the cluster, so at least part of the faint galaxy population is made of old cluster-resident galaxies. We have also shown in A06b that another part of these low surface brightness objects does not share the same history and are possibly coming from the field. A possible scenario in agreement with the present data could be that debris from brighter disrupted and harassed galaxies are populating the very faint part of the Coma cluster galaxy LFs. The mass spectrum of these debris would have a slope close to . This could be verified via numerical simulations, testing the mass distribution of debris issued from galaxy close encounters, generalizing for example the results by Bournaud et al. (2003). An example of such candidates is seen in our data around the two possibly interacting galaxies shown in Fig. 4.
Other concentrations of stars, which are called knots, have also been observed to be ejected from spiral galaxies in clusters by Cortese et al. (2007). The faintest knots observed by these authors from HST data have magnitudes F (close to our B band), and are therefore somewhat brighter than the faintest of our objects, but not very far in magnitude (and therefore mass) range. They also are very blue, so are still forming stars. Similar blue knots are also observed in our data for example south-west of NGC4858 (see Fig. 4) with magnitudes as faint as R24.5, but it is besides the goals of this paper to discuss a precise scenario of what happens around this galaxy.
The fact that the three eastern field LFs are very regular (except perhaps around R=22) shows that the general processes proposed in A07 to explain the dips in the LFs detected down to V22 are not efficient on the Coma very faint galaxy population. Similarly, the two central fields (including the two Coma cluster dominant galaxies NGC 4874 and NGC 4889) are the most populated regions. This shows that galaxy disruption sometimes proposed to explain the lack of faint galaxies in the cluster centers does not act too strongly on the faintest existing galaxies (or knots). The large scale diffuse light sources detected in A06b around NGC 4874 then probably originate from brighter galaxies.
4.3 Nature of the faintest Coma cluster galaxies
Besides the fact that these galaxies could be (at least part of them) debris of larger objects, we investigate here their properties based on colour plots such as B-I versus B-R (see A07). Ideally, we would need B and I data of similar depth as the R data, but this is not the case. We will therefore limit our sample to B=25.25 (the B band conservative completeness level). This means that all objects detected in B will also be detected in R and I, assuming typical B-R and B-I colours.
We then compute galaxy density maps in the B-I/B-R space for the Coma cluster line of sight and for the F02 comparaison field, as already done in A07. The difference between the two maps gives the statistical distribution of objects inside the Coma cluster CS in a B-I versus B-R plot.
In such a plot, we have shown (A07) that early-type, early-spiral and late spiral galaxies were optimally separated in the B-I versus B-R space by the lines:
(B-I) = (B-R) + 1.45
and
(B-I) = (B-R) + 2.60
With these limits, only 15 of the Coleman et al. (1980) type 2 (Sbc) galaxies are misclassified as type 1 (E/S0), and only 26 of types 3/4 (Scd/Irr) are classified as type 2. Results are displayed in Fig. 5.
We can note systematic concentrations around B-R1.2 and B-I1.7 whatever the field. These concentrations correspond nearly exactly to the expected B-R GC location from RZ04. Moreover, the GC B-I colours are probably close to bright elliptical galaxy colours, so are located above the (B-I) = 2 (B-R) + 2.60 line. This is also where the previous concentrations were found and they are probably originating at least partially from GCs. For the western field, however, these possible GCs are clearly dominated in population by the other objects: they only represent 8 of the total number. This leads us to conclude that the objects with B brighter than 25.25 are probably not all GCs. So, only the faintest part of the western field object LF could be really dominated by GCs, as also shown in Fig. 3, assuming that the western field incompleteness and the compact GC shape do not conspire to increase artificially the GC contribution (as discussed in section 4.1).
The westernmost field (field 1) appears dominated by late type galaxies that could be infalling objects. This is not surprising, since it is located on the path of infalling structures onto the Coma cluster (e.g. Neumann et al. 2003) which are likely to be populated by late type field galaxies.
The next field (field 2) to the East is dominated by NGC 4874 and exhibits late type faint galaxy populations. This is in good agreement with A07 (see their Fig. 14), where early type galaxies become dominated by later type objects above R22.75. The next field (field 3) to the East is dominated by NGC 4874 and NGC 4889 and has an earlier type population compared to field 2, but still made of relatively late type objects. This was also visible in Fig. 14 of A07. It is quite puzzling to find these galaxy types around the dominant cluster galaxies except if these are the remnants of disrupted disks, so still forming stars. These galaxies could be similar to the blue low surface brightness galaxies already detected in A06b, that were found to be clustered around NGC 4889 and present in the western areas. Only very high resolution numerical simulations could confirm or not this statement.
The easternmost field (field 4) has a mixed population of all types, but dominated by early types, as expected in the absence of major infall. Only the redder objects in B-I could be globular clusters because most of these objects do not have sufficiently red B-R colours.
5 Conclusions
We first note that the present study has mainly used R band data to detect the objects and B and I band data to investigate their nature. The fact that the B band data are not as deep as those in the R band is clearly the limitating factor of our work. Let us now summarize our main findings:
- Field 1 is very poorly populated. This is possibly due to a combination of galaxy destruction and to the fact that infalling galaxies do not stay in this region, as suggested in A07.
- The LF slopes (close to ) are very different in the CS compared to field regions free from rich clusters (e.g. Ilbert et al. 2005).
- No significant dips are detected for the very faint population showing that peculiar processes creating such dips in brighter galaxy populations (see A07) are not efficient here.
- The western faint galaxies are mainly blue, and therefore late-type-like or issued from late-type galaxies included in the West infalling galaxy layers (see Neumann et al. 2003).
- The eastern galaxies do not show preferential colours so do not have a dominant component. This is probably related to the absence of major infalls in this region.
- The two areas dominated by NGC 4874 and NGC 4889 are preferentially blue, and therefore late-type objects, and possibly come from disk-like disrupted disks.
The main insight of this work compared to A07 on the cluster formation history is the absence of significant dips in the very faint galaxy LF. A possible scenario in agreement with the present data could be that debris from disrupted and harassed brighter galaxies are populating the very faint part of the Coma cluster galaxy LFs. The mass spectrum of these debris would have a slope close to but this still needs to be verified with numerical simulations.
This property could also be directly related to the fact that the CS LFs are very different from the field LFs. Milne et al. (2007) reached similar conclusions. To explain this difference, one needs to flatten the field LF faint end or to steepen the cluster LF. A fading of the faint field galaxies due to reionization processes alone (Benson et al. 2003) cannot explain this difference, as already noted by Milne et al. (2007). They proposed, therefore, other environment dependent feedback processes. However, the cluster LF can be steepened when the faint magnitude ranges are populated by debris coming from brighter galaxies (such as those observed by Cortese et al. 2007 for example), as proposed in the present work.
Acknowledgements.
The authors thank the referee for constructive comments.The authors are grateful to the CFHT and Terapix teams for their help and to the French PNG, CNRS for financial support.
References
- (1) Adami C., Slezak E., Durret F., et al., 2005, AA 429, 39: A05
- (2) Adami C., Picat J.P., Savine C., et al. 2006a, AA 451, 1159: A06a
- (3) Adami C., Scheidegger R., Ulmer M.P., et al. 2006b, AA 459, 679: A06b
- (4) Adami C., Durret F., Mazure A., et al. 2007, AA 462, 411: A07
- (5) Andreon S., Cuillandre J.-C. 2002, ApJ 569, 144
- (6) Beijersbergen M., Hoekstra H., van Dokkum P.G., van der Hulst T. 2002, MNRAS 329, 385
- (7) Benson A.J., Frenk C.S., Baugh C.M., Cole S., Lacey C., 2003, MNRAS 343, 679
- (8) Bernstein G.M., Nichol R.C., Tyson J.A., Ulmer M.P., Wittman D., 1995, AJ 110, 1507: B95
- (9) Bertin E., Arnouts S., 1996, AASS 117, 393
- (10) Boselli A., Boissier S., Cortese L., et al., 2006, ApJ 651, 811
- (11) Bournaud F., Duc P.A., Masset F., 2003, AA 411, L469
- (12) Coleman D.G., Wu C.C., Weedman D.W., 1980, ApJS 43, 393
- (13) Cortese L., Marcillac D., Richard J., et al., 2007, MNRAS 376, 157
- (14) Huang J.S., Cowie L.L., Gardner J.P., 1997, ApJ 476, 12
- (15) Iglesias-Páramo J., Boselli A., Gavazzi G., Cortese L., Vílchez J.M. 2003, A&A 397, 421
- (16) Ilbert O., Tresse L., Zucca E., et al. 2005, A&A 439, 863
- (17) Lobo C., Biviano A., Durret F. et al. 1997, A&A 317, 385
- (18) McCracken H.J., Radovich M., Bertin E., et al., 2003, AA 410, 17
- (19) Milne M.L., Pritchet C.J., Poole G.B., et al., 2007, AJ 133, 177: M07
- (20) Neumann D.M., Lumb D.H., Pratt G.W., Briel U.G., 2003, AA 400, 811
- (21) Rhode K.L., Zepf S.E., 2004, AJ 127, 302: RZ04
- (22) Terlevich A.I., Calswell N., Bower R.G., 2001, MNRAS 326, 1547
- (23) Trentham N. 1998, MNRAS 293, 71