The distance to the Fornax dwarf spheroidal galaxy††thanks: Based on data collected at the European Southern Observatory,
La Silla, Chile, Proposal No. 66.B-0615
Abstract
A large multicolour, wide-field photometric database of the Fornax dwarf spheroidal galaxy has been analysed using three different methods to provide revised distance estimates based on stellar populations in different age intervals. The distance to Fornax was obtained from the Tip of the Red Giant Branch measured by a new method, and using the luminosity of Horizontal Branch stars and Red Clump stars corrected for stellar population effects. Assuming a reddening , the following distance moduli were derived: based on the Tip of the Red Giant Branch, from the level of the Horizontal Branch, and using the Red Clump method. The weighted mean distance modulus to Fornax is . All these measurements agree within the errors, and are fully consistent with previous determinations and with the distance measurements obtained in a companion paper from near-infrared colour-magnitude diagrams.
keywords:
Galaxies: fundamental parameters – Galaxies: distances – Galaxies: individual: Fornax dwarf spheroidal1 Introduction
Along with the disrupted Sagittarius dwarf, Fornax is one of the most massive satellites of the Milky Way. Fornax shows evidence of a complicated and extended star formation history and several studies have contributed to clarify the variety of stellar populations that are present. This galaxy was one of the first to provide convincing evidence of the presence of a conspicuous amount of intermediate-age stars, probed both by the presence of luminous carbon stars (Aaronson & Mould, 1985, 1980; Azzopardi, 1999) and by the well populated red clump (Stetson et al., 1998; Saviane et al., 2000). Blue luminous stars populating the upper main sequence indicate that Fornax has been forming stars up to very recent times (Buonanno et al., 1999; Pont et al., 2004; Saviane et al., 2000; Stetson et al., 1998). Finally, the detection of a significant number of RR Lyrae stars probes the presence of an old, metal-poor component (Bersier & Wood, 2002; Greco et al., 2005). Most recently, stellar population gradients and stellar metallicities have been studied over a wide area of Fornax by Battaglia et al. (2006), confirming the presence of at least three distinct stellar components: a young population concentrated near the centre, an intermediate-age population, and an ancient population. The three components are found to be distinct from each other kinematically, chemically, and in their spatial distribution.
The distance to Fornax marks a reference point in the distance ladder based on secondary distance indicators. Together with the Carina dwarf spheroidal and the Large and Small Magellanic Clouds, Fornax has been used as a benchmark to investigate possible discrepancies between different distance indicators, and to study their dependence on the properties of the underlying stellar populations (e.g., see Bersier, 2000; Pietrzyński et al., 2003). Fornax is particularly suitable for these kind of investigations because of the contemporary presence of both old and intermediate-age/young stellar populations.
The distance to Fornax has been determined using a number of different indicators, and the estimates range from (Buonanno et al., 1985) to (Pietrzyński et al., 2002). In particular, Saviane et al. (2000) found based on the Tip of the Red Giant Branch (TRGB) technique, and based on the luminosity of red Horizontal Branch (HB) stars. Bersier (2000) derived a slightly shorter distance modulus, , based on TRGB and Red Clump (RC) methods. A larger distance modulus, , was obtained by Pietrzyński et al. (2003) using -band imaging of RC stars. A recent analysis of a wide-area database of near-infrared data by Gullieuszik et al. (2006) resulted in from the mean magnitude of the Red Clump (RC), and based on a population-corrected measurement of the TRGB in the band. Previous measurements of the distance to Fornax are summarised in Table 1.
The consistent results from the near-infrared photometry of Gullieuszik et al. (2006) and the relatively large scatter of previous optical distance estimates motivated us to revise the distance to Fornax by exploiting a large multi-band database of photometric observations of Fornax. Our data, covering 1/4 square degree and containing 450.000 stars, were obtained with the Wide Field Imager at the ESO/MPG 2.2-m telescope at La Silla, Chile. The range of distances found in the literature are based on different data sets, each with its own filter set and photometric zero-point. Therefore, measuring the distance with different methods on a single, homogeneous data set with high statistics may provide a standard case of the intrinsic uncertainties in distance determinations in stellar systems with extended star formation histories.
The paper is organised as follows: Sect. 2 presents the observations, the reduction techniques, and the resulting colour-magnitude diagram (CMD). The different methods used to derive the distance to the Fornax dwarf spheroidal are then presented and the results discussed in Sect. 3, 4, and 5. Final remarks and discussion of the results are presented in Sect. 6.
| Value | Method | Reference | |
|---|---|---|---|
| HB | 0.03 | Buonanno et al. (1985) | |
| HB | 0.05 | Buonanno et al. (1999) | |
| HB | 0.05 | Demers et al. (1990) | |
| TRGB | 0.03 | Saviane et al. (2000) | |
| HB | 0.03 | Saviane et al. (2000) | |
| TRGB | 0.03 | Bersier (2000) | |
| RC | 0.03 | Bersier (2000) | |
| RC | 0.03 | Pietrzyński et al. (2003) | |
| RR Lyrae | 0.04 | Greco et al. (2005) | |
| RC | 0.03 | Gullieuszik et al. (2006) | |
| TRGB | 0.03 | Gullieuszik et al. (2006) |
2 Observations and Data Reduction
Wide field observations of Fornax were obtained with the WFI camera mounted at the Cassegrain focus of the ESO/MPG 2.2-m telescope at La Silla, Chile. The camera consists of eight 2k 8k CCDs, closely mounted on a mosaic pattern yielding a total field of view of . The observations were carried out on October 21, 2001, as a part of ESO proposal 66.B-0615. Both long and short exposures were obtained: seconds in , seconds in , and seconds in . The absolute calibration was obtained by observing stars from the list of Landolt (1992) on each CCD. Pre-reduction was performed within the IRAF111The Image Reduction and Analysis Facility (IRAF) software is provided by the National Optical Astronomy Observatories (NOAO), which is operated by the Association of Universities for Research in Astronomy (AURA), Inc., under contract to the National Science Foundation. environment, using the MSCRED package by Valdes (1998). The subsequent reduction steps made use of the WFPRED script package developed by two of us (L.R. and E.V.H.) at the Padova Observatory. This package effectively deals with the problems of astrometric and photometric calibration. Images were astrometrically calibrated using a polynomial solution computed on star fields taken from the list of Stone et al. (1999). Crowded field stellar photometry was performed with the daophot ii / allstar package (Stetson, 1987), with point-spread functions (PSFs) independently computed for each CCD and each filter. Aperture corrections were used to match the PSF photometry with the aperture photometry, using growth-curve analysis of bright isolated stars. Finally, the photometric catalogues were independently calibrated for each CCD using the observations of standard stars. The RMS of the photometric calibration is mag. An extensive set of artificial star experiments was run to estimate the degree of completeness and the distribution of photometric errors. Completeness levels drop to 10% at where the photometric errors reach 0.25 mag.
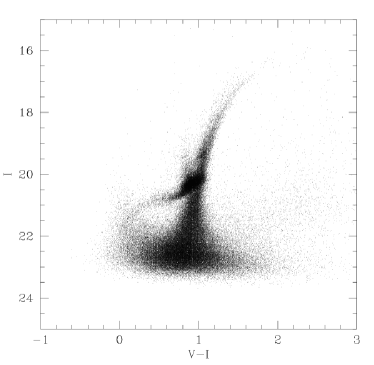
The resulting , CMD is presented in Figs. 1. The limiting magnitude is around , corresponding to the position of the old main sequence turn-off. Note that the figure only shows stars with a photometric error less than 0.2, and is consequently limited to 23.5. A number of known features are evident: the well populated luminous main sequence of stars as young as 0.3 Gyr, the wide and non-uniformly populated red giant branch (RGB), the conspicuous red clump of intermediate-age stars in their helium burning phase, and the less populated but evident horizontal branch (see, e.g., Stetson et al., 1998; Saviane et al., 2000; Pont et al., 2004; Battaglia et al., 2006).
These features are used in Sect. 5 to derive information on the star formation history. This CMD offers us the possibility to use several different methods to estimate the distance to Fornax. The TRGB is bright, well defined and well populated, with manageable AGB contamination. The RC is prominent and bright enough to be usefully adopted as a distance indicator. The HB is not quite as populated as the RC, but still contains enough stars to derive a precise average magnitude.
3 Distance based on the Tip of the Red Giant Branch
In low mass stars, the He ignition occurs under degenerate conditions at almost the same luminosity, with very little dependence on metallicity or age. The observational evidence of this physics is a sharp cut-off of the luminosity function of the RGB, approximatively located at . Da Costa & Armandroff (1990) and Lee et al. (1993) demonstrated the power of this distance indicator applied to nearby galaxies. Lee et al. (1993) provided both an absolute calibration of the -band luminosity of the TRGB () and an objective method to estimate its position on a CMD, based on a digital Sobel filter. This technique was refined by Sakai et al. (1996),who replaced the binned luminosity function with an adaptively smoothed probability distribution. Méndez et al. (2002) introduced a new way to estimate the position of the TRGB, based on a maximum-likelihood approach that effectively uses all the stars around the tip region. In a series of papers, Ferraro et al. (1999); Ferraro et al. (2000) and Bellazzini et al. (2001, 2004) obtained a new robust calibration of the magnitude of the tip, extended to higher metallicities (up to ) and to infra-red pass-bands.
A modified and optimised version of the maximum-likelihood approach has been recently presented by Makarov et al. (2006). The new method has the advantage that completeness, photometric errors, and biased error distributions are fully taken into account. The application of this method to the CMD of Fornax is presented in Fig. 2. The left panel of Fig. 2 shows the CMD and the limits of the CMD region selected for the fitting procedure. On the right half of the figure the completeness function and the distribution of photometric errors derived from artificial star experiments are shown. A biased error distribution is evident at magnitudes fainter than . The lower panel shows the result of the fit.
The tip is detected at , and the average colour of stars at the tip is . As a first approximation, the colour of stars at the tip can be used to estimate the metallicity of the underlying stellar population. By using the relation presented in Bellazzini et al. (2001) (their Figure 1), this colour is converted into a metallicity (the error is purely statistical and does not contain any systematic contribution). Using this value and the TRGB calibration of Bellazzini et al. (2001) (their equation 4), we obtain . The corrected distance is then derived by adopting the reddening value from the infra-red dust maps of Schlegel et al. (1998) and the relation . Using the relation
the distance to Fornax from the RGB tip is then .

The main contribution to the error affecting this determination comes from the conversion of the mean colour at the level of the tip to metallicity. In the case of Fornax, this conversion is not actually necessary. Indeed, several determinations of the metallicity of Fornax exist in the literature. Saviane et al. (2000) found that the average metallicity is (on the scale of Zinn & West, 1984), with tails extending to . They also concluded that a model involving two populations seems to provide a good description of the star content of this galaxy, with the older populations having . With a similar technique, applied to colours Gullieuszik et al. (2006) found a mean age-corrected mean metallicity of . Tolstoy et al. (2001) found , later confirmed with high resolution spectroscopy (Tolstoy et al., 2003). More recently, Pont et al. (2004) and Battaglia et al. (2006) derived the metallicity distribution of Fornax RGB stars from spectroscopy in the CaII triplet region. Both studies agree on finding a metallicity distribution centred at (on the scale of Carretta & Gratton, 1997) with tails extending to and . In summary, both photometric and spectroscopic determination agree in suggesting a metallicity . Using this value, rather than the value derived from direct conversion of the average colour at the tip into metallicity, we derive , and the best estimate of the distance based on the TRGB method is then . The error we quote is quite large, and is derived by estimating the difference between this last distance measurement and the value derived by simple conversion between colour at the tip and metallicity, considering that the metallicity uncertainty is the dominant factor in the error estimate.
4 Distance based on Horizontal Branch stars
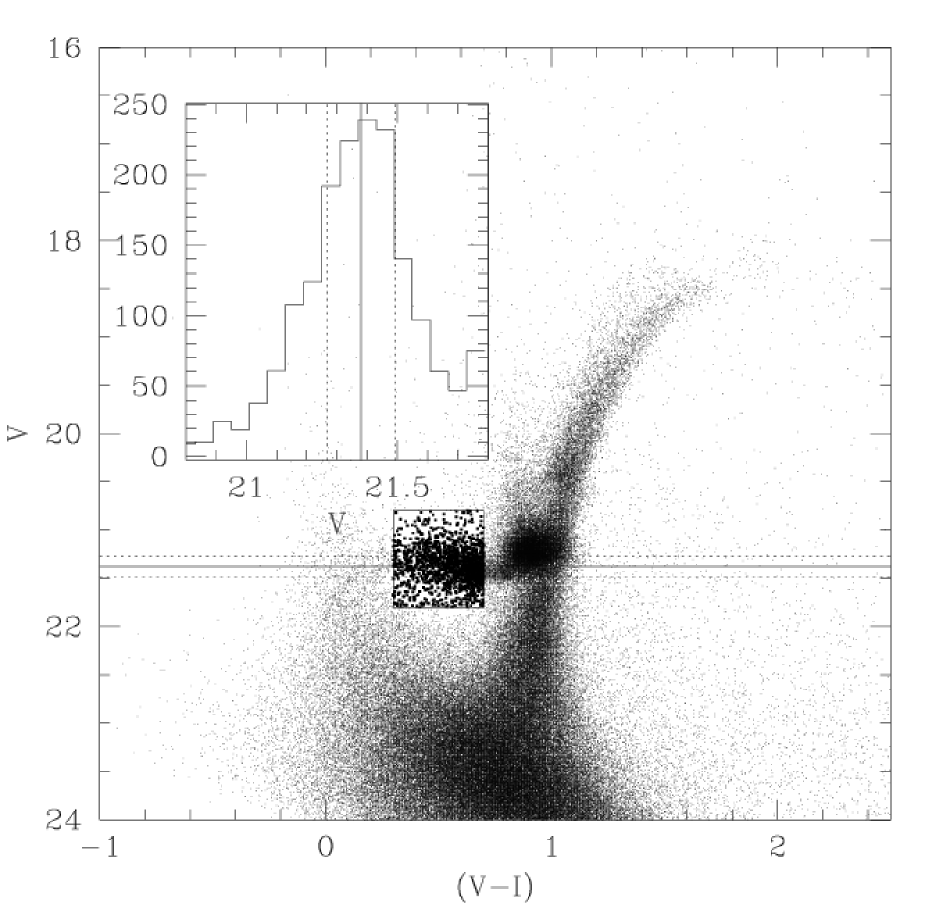
The average luminosity of RR Lyrae and HB stars is the most widely used Pop. II distance indicator. Our measurement of the HB level in Fornax is presented in Fig. 3. Stars with and were selected, and their luminosity function computed. The average magnitude of these stars is , where the error was inferred from the typical magnitude error at the corresponding level. Errors caused by the binning in magnitude, estimated by adding different shifts to our choice of bins, were found to be negligible ( mag).
Assuming an absolute magnitude for HB stars (actually, RR Lyrae stars) requires knowledge of metallicity. A lot of work has been devoted to determine the metallicity dependence of the luminosity of RR Lyrae stars. In this paper, we adopt the recent calibration of Cacciari & Clementini (2003):
We also consider the previous calibration from Carretta et al. (2000). In both cases, the metallicity is on the scale of Carretta & Gratton (1997).
In the previous Section we mentioned a number of estimates of the metallicity of Fornax, based on the RGB stars. In this Section, however, the metallicity we are interested in is that of the old stellar population producing the HB and RR Lyrae stars.
A search for variable stars by Bersier & Wood (2002) resulted in an average metallicity of the variables on the Butler-Blanco scale, which is known to be more metal-rich than the scale of Zinn & West (1984). This value is confirmed by preliminary results of a study of RR Lyrae in the field of Fornax by Greco et al. (2005), suggesting a metallicity on the scale of Carretta & Gratton (1997). This range of results clearly reflects the complex enrichment history of Fornax. For the absolute calibration of HB stars, we assume that HB stars belong to the oldest and most metal-poor stellar population in the galaxy. For this reason, and taking into account the results of Saviane et al. (2000), Bersier & Wood (2002), and Greco et al. (2005), we adopted a metallicity of HB stars on the scale of Zinn & West (1984), corresponding to on the scale of Carretta & Gratton (1997).
The resulting distance modulus was then derived as:
Using the calibration of Cacciari & Clementini (2003) the absolute magnitude of HB stars is and the absorption-corrected distance is . The calibration of Carretta et al. (2000) would yield and a resulting distance modulus .
It is well known that RR Lyrae stars spend most of the time near the faint limit of their light curve, so that a straight average of the magnitudes measured in a single epoch might be biased towards fainter values (resulting in an overestimate of the distance). To quantify this possible source of error, we can look at the average magnitude of RR Lyrae stars as measured by Bersier & Wood (2002) and Greco et al. (2005). In both cases, the reddening-corrected magnitude is , or =21.34 without reddening correction. This is 0.05 mags brighter than the values we computed, and this is probably a reliable estimate of the errors related to averaging single-epoch observations rather than the complete light curve.
5 Distance based on the Red Clump method
Core helium-burning stars of intermediate age form a well defined clump of stars at a magnitude slightly brighter than the HB and near the Hayashi line. This clump has been claimed to provide a very accurate standard candle (e.g., see Udalski, 2000a, and references therein). Once the mean -band magnitude of the red clump, , is known, the absolute distance modulus can be derived using the relation:
where is the mean absolute magnitude measured for nearby red clump stars whose distances were measured using independent techniques (such as trigonometric parallaxes for the Hipparcos sample), is the interstellar absorption in the direction of the object and is a population correction term accounting for the different mixture of stellar ages in the local sample of stars and the Fornax galaxy. The correction term was initially neglected (Paczynski & Stanek, 1998; Stanek et al., 1998; Udalski et al., 1998), but Cole (1998) and Girardi et al. (1998) pointed out that it is non-negligible according to theoretical models of clump stars. Empirical determinations of the dependence of from stellar parameters by Udalski (1998a, b) give a linear relation between and with little or no dependence from stellar ages. Udalski (2000b) suggested the following relation for the RC luminosity:
Discussing the problem from a theoretical point of view, Girardi & Salaris (2001) found a clear and non linear dependence of both from age and metallicity. They determined the mean value of the red clump stars by averaging the contribution from all the stars in the core helium burning phase, and provided tables of as a function of age for 6 different metallicities ranging from to . Following their precepts, we computed the expected correction to the absolute magnitude of the red clump in Fornax, given its star-formation history and chemical enrichment law.
The apparent magnitude of the RC in Fornax was measured by selecting stars with and . After this selection the luminosity function was computed, a linear continuum subtracted, and Gaussian fitting used to measure the average magnitude of RC stars.

According to our measurements, illustrated in Fig. 4, the Fornax RC is found at . The errors are inferred from the typical magnitude error at the corresponding level. Errors due to the magnitude binning were estimated by adding a sequence of shifts to the zero-point of the binning. Such errors were found to be less than and were consequently neglected.
We now need to determine the population correction to correct for the difference between the absolute luminosity of the RC in the Hipparcos sample and in Fornax. To derive the population correction we follow these steps: (1) we perform a full inversion of the CMD of Fornax, to derive its star formation history, (2) we measure the luminosity of RC stars on a simulated diagram that closely reproduces the star formation history of Fornax (), (3) we construct a simulated CMD based on literature studies of the age and metallicity distribution of RC stars of the Hipparcos sample (), (4) we compute the population correction .
To derive the star formation history of Fornax, we used the chemical enrichment law of Pont et al. (2004) and the CMD simulation technique presented in Rizzi et al. (2002, 2003) to perform a full inversion of our Fornax CMD. The result is shown in Fig. 5. Note that there is a very good agreement between the SFH derived here and the one presented in Tolstoy et al. (2003).

Using the results of this simulation, we applied the above described selection of RC stars to the simulated diagram, and derived an absolute magnitude of the RC that fully takes into account the chemical evolution history and the SFH of the galaxy. Gaussian fitting to the background-subtracted luminosity function of simulated stars in the RC region results in . The error was derived by Monte Carlo simulations, by repeating 500 times the CMD inversion using a completely new set of simple stellar populations.
To derive the absolute magnitude of the RC in the Hipparcos sample, we used the star formation history and chemical enrichment laws presented in Rocha-Pinto et al. (2000a, b). The same magnitude and colour selection was adopted as in the case of the simulated CMD of Fornax, and the fitting routine yielded the value: . Note that this is same value derived by Girardi & Salaris (2001).
Stanek et al. (1998) estimate the mean absolute magnitude of RC stars in the Hipparcos sample: . Using all these values we find a distance .
For comparison, we followed a different approach and used the relation derived by Udalski (2000b) to estimate the distance to Fornax from , by adopting an average metallicity . In this case, and the distance modulus is .
6 Summary and conclusions
| Method | Distance | Distance |
|---|---|---|
| E(B-V)=0.02 | E(B-V)=0.05 | |
| RGB tip | ||
| HB | ||
| Red clump | ||
| Mean | ||
| Weighted Mean |
In this paper we have presented a revision of the distance to Fornax based on wide-field observations, and using three different distance indicators, namely the Tip of the Red Giant Branch, the Horizontal Branch, and the Red Clump. Our measurements are summarised in Table 2 for two different values of the interstellar reddening, and , encompassing the range of values adopted in previous works. Within the errors the different methods agree. The straight average of the measurements is for .
It is worth discussing the individual results of each method by comparing them with previous determinations. Previous measurements based on the TRGB in the band were obtained by Saviane et al. (2000), who found , and Bersier (2000), who found . The agreement with the measurement presented in this paper is fairly good, but even better if we only look at the observable, which is the magnitude of the TRGB. Indeed, Saviane et al. (2000) found , and Bersier (2000) found , almost coincident with the value derived here, . The difference in the derived distances are entirely due to different assumptions on the absolute magnitude of the tip, the metallicity, and the reddening.
Previous determinations of the distance to Fornax based on the HB are presented in Saviane et al. (2000), who found , and in Greco et al. (2005), who found . Both values are fully consistent with the values presented in this paper, as is the agreement of the observable, the mean level of the HB stars. Saviane et al. (2000) found while the value measured in this paper is . Note that the Saviane et al. (2000) value refers to the red part of the HB, while the present measurement refers to the CMD region populated by RR Lyrae variable stars. This value is in perfect agreement with the mean luminosity of RR Lyrae stars in the Fornax globular cluster #4 determined from a different and independently calibrated data set by Greco et al. (2007).
Finally, a previous determination of the distance to Fornax based on the optical luminosity of RC stars is presented in Bersier (2000), who finds based on a magnitude of the RC , almost coincident with the value derived here, . The determination presented in Pietrzyński et al. (2003), , is also fully consistent with our measurement. It is interesting to note that the difference found in this paper is in good agreement with the linear fit presented in Figure 4 of Bersier (2000), obtained by adopting the RC calibration of Udalski (2000a).
We conclude that the different data sets recently published show an almost perfect agreement with each other and with the results obtained in this paper. On the other side, there are still small differences between the distance moduli obtained with different methods and by different authors. The differences are mainly due to the different details in the choice of the standard candle, while there is a striking agreement between the different photometry sets. The main sources of uncertainty are (a) the relatively uncertain metallicity, (b) the still debated absolute calibration of these methods, and (c) the adopted reddening. It is on these open subtle calibration issues that the attention should focus to bring the different distance measurements in perfect agreement.
Acknowledgements
We would like to thank the referee, D. Bersier, for his useful and constructive suggestions that significantly improved the paper.
References
- Aaronson & Mould (1980) Aaronson M., Mould J., 1980, ApJ, 240, 804
- Aaronson & Mould (1985) Aaronson M., Mould J., 1985, ApJ, 290, 191
- Azzopardi (1999) Azzopardi M., 1999, Ap&SS, 265, 291
- Battaglia et al. (2006) Battaglia G., Tolstoy E., Helmi A., Irwin M. J., Letarte B., Jablonka P., Hill V., Venn K. A., Shetrone M. D., Arimoto N., Primas F., Kaufer A., Francois P., Szeifert T., Abel T., Sadakane K., 2006, A&A, 459, 423
- Bellazzini et al. (2001) Bellazzini M., Ferraro F. R., Pancino E., 2001, ApJ, 556, 635
- Bellazzini et al. (2004) Bellazzini M., Ferraro F. R., Sollima A., Pancino E., Origlia L., 2004, A&A, 424, 199
- Bersier (2000) Bersier D., 2000, ApJL, 543, L23
- Bersier & Wood (2002) Bersier D., Wood P. R., 2002, AJ, 123, 840
- Buonanno et al. (1999) Buonanno R., Corsi C. E., Castellani M., Marconi G., Fusi Pecci F., Zinn R., 1999, AJ, 118, 1671
- Buonanno et al. (1985) Buonanno R., Corsi C. E., Fusi Pecci F., Hardy E., Zinn R., 1985, A&A, 152, 65
- Cacciari & Clementini (2003) Cacciari C., Clementini G., 2003,in Stellar Candles for the Extragalactic Distance Scale, Eds. D. Alloin & W. Gieren, Lectures Notes in Physics, Springer Verlag, 635, 105
- Carretta & Gratton (1997) Carretta E., Gratton R. G., 1997, A&As, 121, 95
- Carretta et al. (2000) Carretta E., Gratton R. G., Clementini G., Fusi Pecci F., 2000, ApJ, 533, 215
- Cole (1998) Cole A. A., 1998, ApJL, 500, L137
- Da Costa & Armandroff (1990) Da Costa G. S., Armandroff T. E., 1990, AJ, 100, 162
- Demers et al. (1990) Demers S., Grondin L., Kunkel W. E., 1990, PASP, 102, 632
- Ferraro et al. (1999) Ferraro F. R., Messineo M., Fusi Pecci F., de Palo M. A., Straniero O., Chieffi A., Limongi M., 1999, AJ, 118, 1738
- Ferraro et al. (2000) Ferraro F. R., Montegriffo P., Origlia L., Fusi Pecci F., 2000, AJ, 119, 1282
- Girardi et al. (1998) Girardi L., Groenewegen M. A. T., Weiss A., Salaris M., 1998, MNRAS, 301, 149
- Girardi & Salaris (2001) Girardi L., Salaris M., 2001, MNRAS, 323, 109
- Greco et al. (2007) Greco C., Clementini G., Catelan M., Held E. V., Poretti E., Gullieuszik M., Maio M., Rest A., De Lee N., Smith H. A., Pritzl B. J., 2007, ApJ, submitted
- Greco et al. (2005) Greco C., Clementini G., Held E. V., Poretti E., Catelan M., Dell’Arciprete L., Gullieuszik M., Maio M., Rizzi L., Smith H. A., Pritzl B. J., Rest A., De Lee N., in ”Resolved Stellar Populations”, eds. D. Valls-Gabaud and M. Chavez, ASP Conf. Ser. (in press), ArXiv Astrophysics e-prints astro-ph/0507244
- Gullieuszik et al. (2006) Gullieuszik M., Held E. V., Rizzi L., Saviane I., Momany Y., Ortolani S., 2007, A&A, accepted, ArXiv Astrophysics e-prints astro-ph/0703489
- Landolt (1992) Landolt A. U., 1992, AJ, 104, 340
- Lee et al. (1993) Lee M. G., Freedman W. L., Madore B. F., 1993, ApJ, 417, 553
- Makarov et al. (2006) Makarov D., Makarova L., Rizzi L., Tully R. B., Dolphin A. E., Sakai S., Shaya E. J., 2006, AJ, 132, 2729
- Méndez et al. (2002) Méndez B., Davis M., Moustakas J., Newman J., Madore B. F., Freedman W. L., 2002, AJ, 124, 213
- Paczynski & Stanek (1998) Paczynski B., Stanek K. Z., 1998, ApJL, 494, L219
- Pietrzyński et al. (2002) Pietrzyński G., Gieren W., Fouqué P., Pont F., 2002, AJ, 123, 789
- Pietrzyński et al. (2003) Pietrzyński G., Gieren W., Udalski A., 2003, AJ, 125, 2494
- Pont et al. (2004) Pont F., Zinn R., Gallart C., Hardy E., Winnick R., 2004, AJ, 127, 840
- Rizzi et al. (2002) Rizzi L., Held E. V., Bertelli G., Nasi E., Saviane I., Vallenari A., 2002, in Lejeune T., Fernandes J., eds, ASP Conf. Ser. 274: Observed HR Diagrams and Stellar Evolution, p. 490
- Rizzi et al. (2003) Rizzi L., Held E. V., Bertelli G., Saviane I., 2003, ApJL, 589, L85
- Rocha-Pinto et al. (2000a) Rocha-Pinto H. J., Maciel W. J., Scalo J., Flynn C., 2000a, A&A, 358, 850
- Rocha-Pinto et al. (2000b) Rocha-Pinto H. J., Scalo J., Maciel W. J., Flynn C., 2000b, A&A, 358, 869
- Sakai et al. (1996) Sakai S., Madore B. F., Freedman W. L., 1996, ApJ, 461, 713
- Saviane et al. (2000) Saviane I., Held E. V., Bertelli G., 2000, A&A, 355, 56
- Schlegel et al. (1998) Schlegel D. J., Finkbeiner D. P., Davis M., 1998, ApJ, 500, 525
- Stanek et al. (1998) Stanek K. Z., Zaritsky D., Harris J., 1998, ApJL, 500, L141
- Stetson (1987) Stetson P. B., 1987, PASP, 99, 191
- Stetson et al. (1998) Stetson P. B., Hesser J. E., Smecker-Hane T. A., 1998, PASP, 110, 533
- Stone et al. (1999) Stone R. C., Pier J. R., Monet D. G., 1999, AJ, 118, 2488
- Tolstoy et al. (2001) Tolstoy E., Irwin M. J., Cole A. A., Pasquini L., Gilmozzi R., Gallagher J. S., 2001, MNRAS, 327, 918
- Tolstoy et al. (2003) Tolstoy E., Venn K. A., Shetrone M., Primas F., Hill V., Kaufer A., Szeifert T., 2003, AJ, 125, 707
- Udalski (1998a) Udalski A., 1998a, Acta Astronomica, 48, 383
- Udalski (1998b) Udalski A., 1998b, Acta Astronomica, 48, 113
- Udalski (2000a) Udalski A., 2000a, ApJL, 531, L25
- Udalski (2000b) Udalski A., 2000b, Acta Astronomica, 50, 279
- Udalski et al. (1998) Udalski A., Szymanski M., Kubiak M., Pietrzynski G., Wozniak P., Zebrun K., 1998, Acta Astronomica, 48, 1
- Valdes (1998) Valdes F. G., 1998, in Albrecht R., Hook R. N., Bushouse H. A., eds, ASP Conf. Ser. 145: Astronomical Data Analysis Software and Systems VII The IRAF Mosaic Data Reduction Package. p. 53
- Zinn & West (1984) Zinn R., West M. J., 1984, ApJs, 55, 45