The Persistence of High-Frequency Spin Fluctuations in Overdoped La2-xSrxCuO4 (=0.22)
Abstract
We report a detailed inelastic neutron scattering study of the collective magnetic excitations of overdoped superconducting La1.78Sr0.22CuO4 for the energy range 0–160 meV. Our measurements show that overdoping suppresses the strong response present for optimally doped La2-xSrxCuO4 which is peaked near 50 meV. The remaining response is peaked at incommensurate wavevectors for all energies investigated. We observe a strong high-frequency magnetic response for meV suggesting that significant antiferromagnetic exchange couplings persist well into the overdoped part of the cuprate phase diagram.
pacs:
74.72.Dn, 74.25.Ha, 75.40.Gb, 78.70.NxThe occurrence of high-temperature superconductivity is widely believed to be connected to the cuprates’ spin degrees of freedom Chubukov et al. (2003). Thus, we might expect strong spin fluctuations to co-exist with superconductivity over the whole superconducting phase diagram. The spin excitations have been well characterised for the insulating antiferromagnetic (AF) Coldea et al. (2001) and lightly-doped Keimer et al. (1992); Stock et al. (2006); Mook et al. (2002); Hayden et al. (2004) compositions. For optimally doped compositions, structured excitations have been observed over a wide energy range Hayden et al. (1996); Vignolle et al. (2007). However, little is known about the high-energy spin dynamics on the overdoped side of the cuprate phase diagram. One of the best materials to investigate this region is single layer La2-xSrxCuO4 (LSCO). This system can be doped sufficiently to destroy the superconductive behavior Wakimoto et al. (2004), allowing the spin excitations to be studied across the entire superconducting dome. Studying the overdoped part of the phase diagram offers a different view on the emergence of the superconducting state. In contrast to the underdoped regime, superconductivity does not emerge from the ‘pseudogap’ state Timusk and Statt (1999). Rather, it emerges from what appears to be a strongly correlated metallic state Hussey et al. (2003).
In this letter, we report an inelastic neutron scattering (INS) study of the magnetic response of an overdoped superconducting sample over a wide energy range (0–160 meV) and throughout the Brillouin zone. We have chosen the composition La1.78Sr0.22CuO4 ( K), which shows a substantial drop in with respect to optimal doping but is nevertheless superconducting (see Fig. 1). We find that the spin excitations are dramatically modified from those observed at optimal doping: The strong peak in the local susceptibility present Vignolle et al. (2007) in La1.84Sr0.16CuO4 near 50 meV is suppressed, and the remaining response is incommensurate and strongest around meV and meV. Thus, strong spin excitations persist well into the overdoped region of the cuprate phase diagram as required by magnetically mediated models of superconductivity.
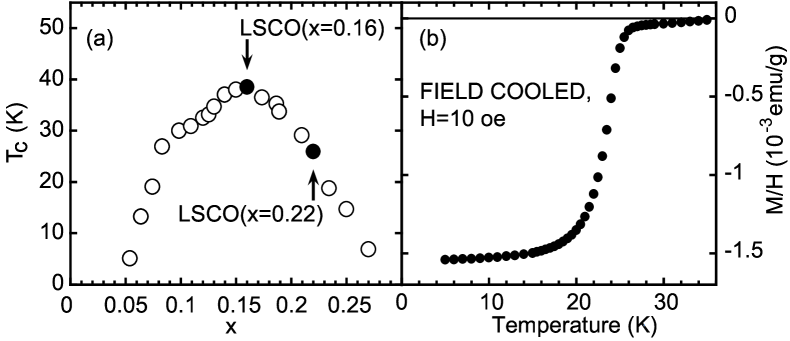
La1.78Sr0.22CuO4 has a tetragonal structure and we use tetragonal indexing to label reciprocal space . The magnetic excitations in LSCO are 2D as the strongest magnetic couplings are within the CuO2 planes. Thus, usually we quote in-plane components of . In this notation, the parent compound of the series, La2CuO4, exhibits AF order with an ordering vector of and points along the Cu–O bonds. Seven single crystals with a total mass of 75 g were co-aligned with a total mosaic of 0.8∘. The crystals were grown by a traveling-solvent floating-zone technique Komiya et al. (2002) and annealed with one bar of oxygen for six weeks at 800∘C. The Sr stoichiometry was measured with SEM-EDX and ICP-AES to be . Magnetization measurements [see Fig. 1(b)] indicate that K.
INS probes the energy and wavevector dependence of . The magnetic cross section is given by
| (1) |
where =0.2905 barn sr-1, and are the incident and final neutron wavevectors and is the anisotropic magnetic form factor for a Cu2+ orbital. Data were placed on an absolute scale using a V standard.
The magnetic response of the cuprates is dominated by the unpaired electrons of Cu2+ ions. The AF parent compound La2CuO4 displays spin waves Coldea et al. (2001), which disperse out from position. For doped superconducting compositions, the low-energy ( meV) excitations of La2-xSrxCuO4 are peaked at and Shirane et al. (1989); Cheong et al. (1991). The low-energy incommensurability of the excitations increases with and saturates with Yamada et al. (1998); Wakimoto et al. (2004). It has recently been shown that of La2-xSrxCuO4 and La2-xBaxCuO4 disperses Tranquada et al. (2004); Christensen et al. (2004); Vignolle et al. (2007) with energy and shows a minimum near meV. The high-energy ( meV) response in optimally doped La1.84Sr0.16CuO4 appears to be more isotopic, possibly with incommensurate (IC) peaks rotated by in the plane Vignolle et al. (2007). Interestingly, a similar ‘hourglass’ dispersion has been observed Arai et al. (1999); Bourges et al. (2000); Hayden et al. (2004) in YBa2Cu3O6+x.
Our INS experiments were performed on the MAPS instrument at the ISIS spallation source. MAPS is a direct-geometry time-of-flight chopper spectrometer with position-sensitive detectors. This allows a large region of reciprocal space to be sampled using a single setting with a given incident energy . In order to identify and minimize phonon contamination of our results we collected data for seven different ’s. Each allows a given position to be probed for a different value [see Fig 4(d)]. The magnetic scattering in LSCO depends only on the out-of-plane wavevector through , whereas phonon scattering is strongly dependent on . We excluded data from our final results if it satisfied any of the following criteria: (i) A clearly identified phonon branch could be seen to cross the region. (ii) The pattern was not four-fold symmetric around (after subtracting a background quadratic in ). (iii) The fitted value of was more than twice (including errors) that found at the same for a different . The excluding procedure was only required below the phonon cut-off energy of 90 meV.
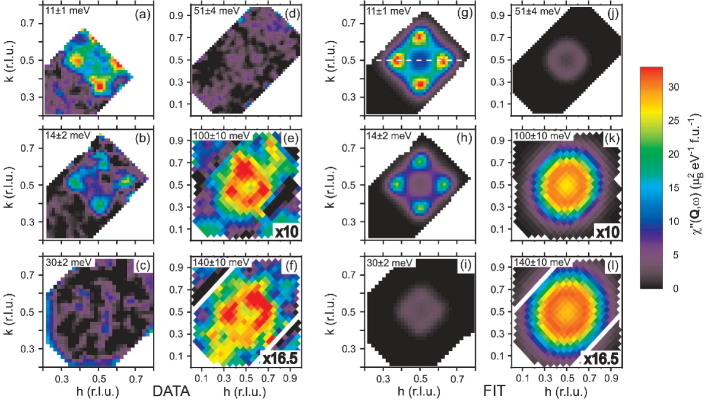
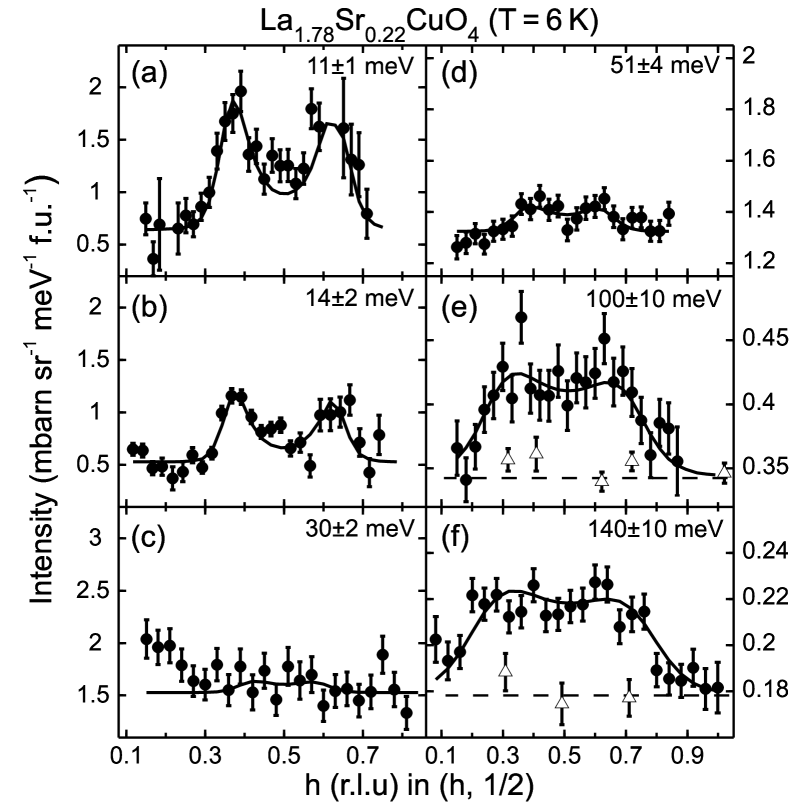
Fig. 2 shows of LSCO(=0.22) as slices at various energies. Corresponding cuts through the raw data along the line are plotted in Fig. 3. The low- cut in Fig. 2(a) at =11 meV shows the well-known four-peak structure Shirane et al. (1989); Wakimoto et al. (2004); Cheong et al. (1991); Yamada et al. (1998); Tranquada et al. (2004); Christensen et al. (2004); Vignolle et al. (2007). The structure is considerably weaker at =14 meV [Fig. 2(b) and Fig. 3(b)] and has almost disappeared for =30 meV and =50 meV [Fig. 2(c)-(d) and Fig. 3(c)-(d)]. This behavior is in contrast to optimally doped La1.84Sr0.16CuO4 Christensen et al. (2004); Vignolle et al. (2007), where the IC response is strongest around meV and there is a strong response centered on for energies in the range =40–50 meV. At higher energies, the magnetic response reemerges for =100 meV [Fig.2(e) and Fig. 3(e)] and =140 meV [Fig.2(f) and Fig. 3(f)]. The high- response is significantly broader in and is weaker than the low- response. However, as we shall see below, when integrated in and it dominates the magnetic response.
We used a modified lorentzian function to make a quantitative analysis of the data:
| (2) |
with
where the position of the four peaks is determined by , is an inverse correlation length (peak width), and controls the shape of the pattern (=4 yields four distinct peaks and =0 a pattern with circular symmetry Lip (????)). This phenomenological response function provides a good description of the data at all energies. Fig. 2(g)-(l) show 2D fits of Eq. 2 to the corresponding slices (a)-(f). The parameters extracted from fitting the resolution-convolved model to the 2D slices are shown in Fig. 4(a)-(c). We have expressed the strength of the magnetic response in terms of the wavevector-averaged or local susceptibility determined from the fitted . The local susceptibility indicates the overall strength of the magnetic excitations for a given energy.
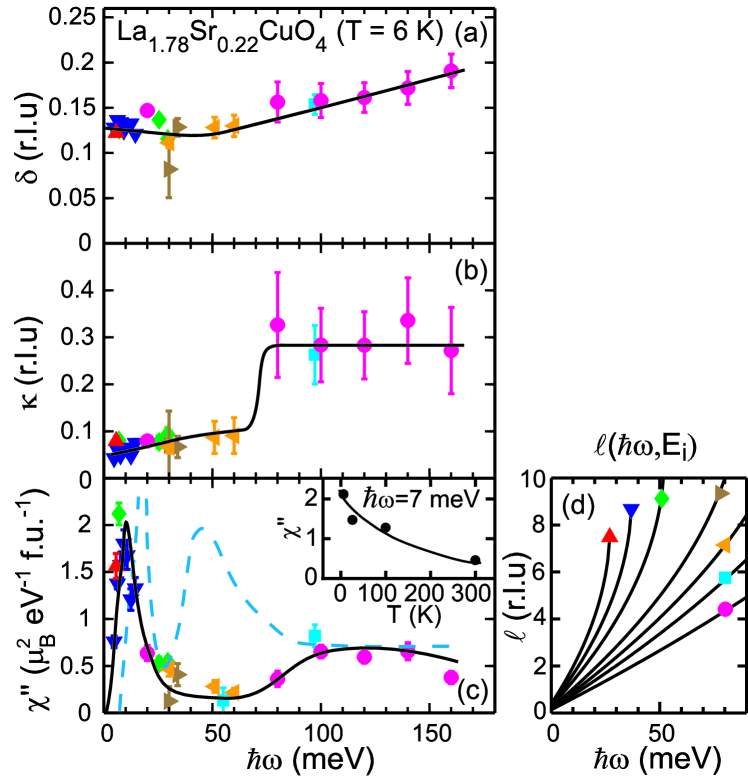
Fig. 4 summarizes the main findings of this work. Firstly, the magnetic response is made up of two components [see Fig. 4(c)]: A low-frequency (four-peaked) component for which is peaked around 10 meV and a much broader high-frequency component which is strongest around 120 meV. The spectral weight of the components are found to be and , the high energy component therefore dominating the response. The emergence of the high-frequency component at 80 meV corresponds to a rapid broadening of in wavevector as shown by the sudden increase in the parameter [Fig. 4(b)] at this energy. Comparing the present results with a recent study Vignolle et al. (2007) of optimally doped La1.84Sr0.16CuO4 over the same energy range [dashed line is Fig. 4(c)], we note (i) The low-energy peak in has moved from 18 meV down to about 10 meV with no change in spectral weight Vig (????). The low-energy IC component [Fig. 4(a)] does not disperse rapidly towards as seen in optimally doped LSCO Christensen et al. (2004); Vignolle et al. (2007). Instead the pattern disappears rapidly. (ii) The peak in around 40-60 meV present in LSCO(=0.16), which corresponds to a strong response near , is suppressed. (iii) A high-energy ( meV) component remains with approximately the same amplitude as for LSCO(=0.16). A recent study Wakimoto et al. (2007) of more highly doped LSCO(=0.25) reported significant spectral weight in the range 40-60 meV, although we note that this work was performed with two ’s only, which may have limited the ability to discriminate between scattering of a magnetic and phononic nature.
The origin of the magnetic excitations in the cuprates has been discussed in terms of many models. As we move to the overdoped side of the phase diagram, it is widely believed that Fermi-liquid-based models become more appropriate. Within such models, the low-energy IC peaks arise from the creation of (correlated) quasiparticle pairs Si et al. (1993); Littlewood et al. (1993); Norman (2007). Thus the shift of the low-energy peak in to lower energy as we move from LSCO(=0.16) to overdoped LSCO(=0.22) might be due to changes in the band structure. It is more difficult to explain the sudden collapse of the magnetic response in the intermediate 50–70 meV energy range between LSCO(=0.16) and LSCO(=0.22) [see Fig. 4(c)] although photoemission (ARPES) suggests that the topology of the Fermi surface changes between these two compositions as the quasiparticle states near move above the Fermi energy Yoshida et al. (2006). Thus, there will undoubtedly be a concomitant change in the nesting of the quasiparticle states. At higher energies (80–160 meV), we observe the reemergence of a magnetic signal which despite the heavy doping is about 1/3 of the intensity of the parent antiferromagnet La2CuO4 Hayden et al. (1996) in the same energy range. If we associate the high-energy response with residual antiferromagnetic interactions, we find from the dispersion of the high-energy excitations [Fig. 4(a)] = meV r.l.u.-1 that meV. Thus a strong AF exchange coupling persists across the cuprate phase diagram into the overdoped region.
It is interesting to compare our measurements with electronic spectroscopies. ARPES experiments Kaminski et al. (2001); Johnson et al. (2001); Zhou et al. (2003) have observed ‘kink’ structures in the quasiparticle dispersion of a number of systems including LSCO. These have been interpreted as a signature of the coupling of quasiparticles to collective excitations (bosons). In LSCO(=0.22) a kink is observed Zhou et al. (2003) at about 70 meV which corresponds approximately to the onset of the higher-energy excitations that we have observed. Recent APRES experiments Kordyuk et al. (2006); Graf et al. (2007); Valla et al. (2007); Chang et al. (2006) indicate further quasiparticle anomalies at higher energies which persist into the overdoped region Kordyuk et al. (2006). These features could be related to high-energy spin fluctuations which have been observed up to 250 meV for LSCO(=0.14) Hayden et al. (1996) and up to 160 meV in the present measurement of LSCO(=0.22). Infrared optical-spectroscopy measurements Hwang et al. (2006) also provide evidence of the coupling of quasiparticles to bosonic excitations and in particular the existence of a two-component excitation spectrum with a high-energy tail.
In conclusion, overdoping dramatically suppresses the magnetic response. The remaining spin excitations are incommensurate and persist over a wide energy range. Defining the energy scale of the spin excitations as the ‘center of mass’ of the observed spectrum, the parent compound is an antiferromagnet with spin-wave excitations and an energy scale meV. Doping results in stronger magnetic excitations at intermediate energies, meV, for example, in optimally doped La2-xSrxCuO4 and a lower energy scale. The present experiment shows that the energy scale increases as we move into the overdoped regime. Thus, the special feature of the optimally doped region is the overall low characteristic energy of the spin excitations and the drop in with overdoping is associated with the disappearance of the commensurate response near 50 meV Vignolle et al. (2007).
References
- Chubukov et al. (2003) A. V. Chubukov, D. Pines, and J. Schmalian, in The Physics of Superconductors, Eds. K. H. Bennemann and J. B. Ketterson (Springer, Berlin, 2003), vol. 2, p. 495.
- Coldea et al. (2001) R. Coldea, et al., Phys. Rev. Lett. 86, 5377 (2001).
- Keimer et al. (1992) B. Keimer, et al., Phys. Rev. B 46, 14034 (1992).
- Stock et al. (2006) C. Stock, et al., Phys. Rev. B 73, 100504 (2006).
- Mook et al. (2002) H. A. Mook, et al., Phys. Rev. Lett. 88, 097004 (2002).
- Hayden et al. (2004) S. M. Hayden, H. A. Mook, P. C. Dai, T. G. Perring, and F. Dogan, Nature 429, 531 (2004).
- Hayden et al. (1996) S. M. Hayden, et al., Phys. Rev. Lett. 76, 1344 (1996).
- Vignolle et al. (2007) B. Vignolle, et al., Nature Phys. 3, 163 (2007).
- Wakimoto et al. (2004) S. Wakimoto, et al., Phys. Rev. Lett. 92, 217004 (2004).
- Timusk and Statt (1999) T. Timusk and B. Statt, Rep. Prog. Phys. 62, 61 (1999).
- Hussey et al. (2003) N. Hussey, M. Abdel-Jawad, A. Carrington, A. Mackenzie, and L. Balicas, Nature 425, 814 (2003).
- Yamada et al. (1998) K. Yamada, et al., Phys. Rev. B 57, 6165 (1998).
- Komiya et al. (2002) S. Komiya, Y. Ando, X. F. Sun, and A. N. Lavrov, Phys. Rev. B 65, 214535 (2002).
- Shirane et al. (1989) G. Shirane, et al., Phys. Rev. Lett. 63, 330 (1989).
- Cheong et al. (1991) S. W. Cheong, et al., Phys. Rev. Lett. 67, 1791 (1991).
- Tranquada et al. (2004) J. M. Tranquada, et al., Nature 429, 534 (2004).
- Christensen et al. (2004) N. B. Christensen, et al., Phys. Rev. Lett. 93, 147002 (2004).
- Arai et al. (1999) M. Arai, et al., Phy. Rev. Lett. 83, 608 (1999).
- Bourges et al. (2000) P. Bourges, et al., Science 288, 1234 (2000).
- Lip (????) The data is best described with for and for , where meV.
- Vig (????) For LSCO(=0.16) Vignolle et al. (2007), the total spectral weight of the low and high energy components are 0.031(3) and 0.110(8) .
- Wakimoto et al. (2007) S. Wakimoto, et al., Phys. Rev. Lett. 98, 247003 (2007).
- Si et al. (1993) Q. M. Si, Y. Y. Zha, K. Levin, and J. P. Lu, Phys. Rev. B 47, 9055 (1993).
- Littlewood et al. (1993) P. B. Littlewood, J. Zaanen, G. Aeppli, and H. Monien, Phys. Rev. B 48, 487 (1993).
- Norman (2007) M. R. Norman, cond-mat/0701720.
- Yoshida et al. (2006) T. Yoshida, et al., Phys. Rev. B 74, 224510 (2006).
- Kaminski et al. (2001) A. Kaminski, et al., Phys. Rev. Lett. 86, 1070 (2001).
- Johnson et al. (2001) P. D. Johnson, et al., Phys. Rev. Lett. 87, 177007 (2001).
- Zhou et al. (2003) X. J. Zhou, et al., Nature 423, 398 (2003).
- Kordyuk et al. (2006) A. A. Kordyuk, et al., Phys. Rev. Lett. 97, 17002 (2006).
- Graf et al. (2007) J. Graf, et al., Phys. Rev. Lett. 98, 067004 (2007).
- Valla et al. (2007) T. Valla, et al., Phys. Rev. Lett. 98, 167003 (2007).
- Chang et al. (2006) J. Chang, et al., cond-mat/0610880.
- Hwang et al. (2006) J. Hwang, et al., cond-mat/0610488.