High-resolution Spectroscopy of [Ne II] Emission from TW Hya
Abstract
We present high-resolution echelle spectra of [Ne II] m emission from the classical T Tauri star (CTTS) TW Hya obtained with MICHELLE on Gemini North. The line is centered at the stellar radial velocity and has an intrinsic FWHM of km s-1. The line width is broader than other narrow emission lines typically associated with the disk around TW Hya. If formed in a disk, the line broadening could result from turbulence in a warm disk atmosphere, Keplerian rotation at an average distance of 0.1 AU from the star, or a photoevaporative flow from the optically-thin region of the disk. We place upper limits on the [Ne II] emission flux from the CTTSs DP Tau and BP Tau.
1 INTRODUCTION
X-ray and UV emission from classical T Tauri stars (CTTSs) can affect the chemical structure of their protoplanetary disks by ionizing the disk surface, dissociating molecules, and heating the gas and grains (see reviews by Najita et al., 2007; Dullemond et al., 2007; Bergin et al., 2007). Direct evidence of irradiated disks is seen in far-UV H2 emission, which requires excitation by H I Ly irradiation and can be attributed to emission from the inner disk of some CTTSs (Herczeg et al., 2006). Other observational evidence for FUV- and X-ray-irradiated disks around CTTSs has been more circumstantial. The underabundance of HCN relative to CN in disks around several CTTSs may be attributed to strong Ly emission (Bergin et al., 2003). Bary et al. (2003) suggest that X-ray irradiation warms the disk surface enough to produce emission in the H2 1-0 S(1) line. The excess FUV continuum emission may result from the electronic cascade and dissociation following excitation of H2 by energetic electrons (Herczeg et al., 2004; Bergin et al., 2004). EUV irradiation of the disk can produce a photoevaporative wind, which could be visible in the low-velocity component of some optical forbidden lines (see review by Dullemond et al., 2007).
Recently, Pascucci et al. (2007) and Lahuis et al. (2007) may have found a new probe of gas at the disk surface by detecting emission in the [Ne II] m fine-structure line in low-resolution Spitzer IRS spectra of CTTSs. [Ne II] was detected in four of six targets in the Pascucci et al. (2007) sample and in 15 of 76 targets in the Lahuis et al. (2007) sample. Relative to the Myr old CTTSs in Taurus, the six stars observed by Pascucci et al. (2007) have faint mid-IR continuum emission, are X-ray bright, and have mass accretion rates an order of magnitude lower than the average CTTS of similar spectral type. The Lahuis et al. (2007) sample and detections are comprised mostly of T Tauri stars with an IR excess. The only class I source in their sample was also detected in [Ne II], and several Herbig Ae/Be stars were undetected in [Ne II]. The sources both with and without [Ne II] detections from Lahuis et al. (2007) show a range of X-ray luminosities. Lahuis et al. (2007) also detected [Ne III] emission from one source (Sz102), and four of the six targets with H2 0–0 S(2) emission also show [Ne II] emission.
Pascucci et al. (2007) and Lahuis et al. (2007) both argue that the irradiated disk surface is the most likely origin for this emission. Two ionization paths can ionize Ne and thereby produce the [Ne II] emission. Glassgold et al. (2007) propose that the line is formed because of Ne ionization by K-shell absorption of stellar X-rays at energies keV. The observed [Ne II] fluxes and the [Ne III]/[Ne II] flux ratio and lower limits are consistent with predictions from this X-ray ionization model. Alternatively, EUV photons shortward of the Ne I ionization edge at Å can produce [Ne II] emission if the EUV emission is able to penetrate through neutral gas in the accretion column and wind. If the disk origin is confirmed, then the [Ne II] 12.81m line would be a direct probe of the irradiation of the protoplanetary disk by the central star.
In this paper, we present high-resolution echelle spectra of the 12.81m region of the CTTSs TW Hya, BP Tau, and DP Tau obtained with MICHELLE on Gemini North. TW Hya is a nearby 10 Myr old CTTS with a disk that is believed to be optically-thin within 4 AU from the star based on models of its infrared spectral energy distribution (Calvet et al., 2002) and an inner hole and bright ring imaged at 7mm with the VLA (Hughes et al., 2007). BP Tau and DP Tau are 1 Myr old CTTSs with optically-thick inner disks (Kenyon & Hartmann, 1995; Muzerolle et al., 2003). All three stars are X-ray bright (Table 1). We find strong [Ne II] emission from TW Hya and place upper limits on the [Ne II] flux from DP Tau and BP Tau. We discuss the origin of the emission in the context of profiles of other emission lines from TW Hya and suggest that the line is formed in a disk, although formation in a heated photosphere cannot be ruled out. If the [Ne II] emission is formed in a disk, the line width could result from Keplerian rotation at a distance of 0.1 AU from the star, tran-sonic turbulence, or detecting the front and back of a photoevaporative flow.
2 OBSERVATIONS AND DATA REDUCTION
We used the echelle mode of MICHELLE on Gemini North to observe the CTTSs TW Hya, DP Tau, and BP Tau on 9 March 2007. MICHELLE has a 320x240 Si:As array with a plate scale of (Glasse et al., 1997). When used with the echelle spectrograph MICHELLE has a spectral resolution of . We centered the targets on the slit using images obtained with the Si-5 filter, which has an effective wavelength of m. We used a 2-pixel wide slit and the Si-6 filter to obtain spectra centered at 12.815m and covering m. We nodded off the slit at 35s intervals. Our total on-source integration was 40.4 min for TW Hya, 20 min for BP Tau and 22.5 min for DP Tau. These three targets were observed at median airmasses of 1.8, 1.3, and 1.9, respectively. Observations of CMa and the asteroid Iris were used as telluric standards. The seeing varied from to , as measured in the cross-dispersion spatial profile from our unresolved telluric standards.
In each set of four nod positions, the counts in each column of the off-source images are scaled to and then subtracted from the counts in the same column of the on-source sky background. This scaling is necessary because the second derivative of the sky brightness versus time was non-zero. We correct for fringing in the cross-dispersion direction by fitting a high-order polynomial to the residual background in each column. We extract the spectrum from a 7-pixel window centered on the source, and then subtract background sky spectra obtained from 20-pixel windows on both sides of the source. Fringing in the spectral direction is not detected or corrected for because of the low S/N in the continuum (Table 1).
We estimate the telluric correction for each observation by interpolating the standard spectra of Iris and CMa at intermediate airmasses. The atmospheric correction is applied to each nod prior to combining the images. Several O3, CO2, and H2O lines are present in the wavelength range of our spectra. We calibrate wavelengths to an accuracy of km s-1 per pixel using a 2nd-order fit to sky emission lines identified with ATRAN (Lord, 1992). Each pixel covers km s-1. We estimate a resolution of pixels ( km s-1) from the FWHM of four weak, narrow sky emission lines.
TW Hya was also observed on 12 April 2006 during re-commissioning of the East Arm Echelle Spectrograph (Libbrecht & Peri, 1995) on the 5m Hale Telescope at Palomar. The instrument is fed by a bundle of fibers that together subtend and illuminate a pixel CCD. The spectrum covers most of the 4000-9000 Å range at a resolution of 15,000-45,000, depending on location on the chip. The relative wavelength solution in each order was obtained using a ThAr lamp. The absolute wavelength solution is determined separately for each echelle order by matching photospheric lines to the radial velocity of TW Hya and is accurate to km s-1.
No sufficient flat field was obtained during the commissioning. However, observations of the white dwarf Feige 34 and the A0 star HD74198 obtained in the same night yield spectra with a count rate that peaks near the center of each order and falls off smoothly to the edge of the detector. The absence of flat-fielding has a negligible effect on the line profile shapes and equivalent width measurements because they are extracted from narrow spectral regions. We use observations of several other stars to identify the approximate flux in telluric emission lines, which are located at -20 km s-1 relative to the photospheric velocity of TW Hya. The telluric and stellar components of the [O I] lines at 5577, 6300, and 6363 Å can therefore be separated. The Na I D emission lines are undetected, with a sensitivity limited by strong telluric emission. We calculate line fluxes from equivalent widths by estimating the continuum flux level from non-simultaneous archival HST/STIS optical spectra (Herczeg et al., 2004; Roberge et al., 2005).
The heliocentric radial velocity of TW Hya is km s-1 (Weintraub et al. 2000; see also Kastner et al. 1997, de la Reza et al. 1989) and of BP Tau is 15.8 km s-1 (Herbig & Bell, 1995). The heliocentric radial velocity of DP Tau has not been measured. We estimate a radial velocity of km s-1 by averaging the radial velocities of the T Tauri stars GO Tau and V955 Tau (Herbig & Bell, 1995), which are both about 10′ from DP Tau.
3 CHARACTERIZING THE [Ne II] EMISSION
Figure 1 shows our MICHELLE spectra of TW Hya, BP Tau, and DP Tau. The continuum is detected from each target. We measure equivalent widths for the [Ne II] fine-structure line ( – ) at m (Yamada et al., 1985) of Å for TW Hya and upper limits of and Å for non-detections from BP Tau and DP Tau, respectively. The upper limits are calculated by assuming the same line profile as that of TW Hya, and would be larger if the hypothetical lines from these objects were broader. We convert equivalent widths to , , and erg cm-2 s-1 using m continuum flux measurements from Spitzer IRS spectra (Uchida et al., 2004; Furlan et al., 2006). These fluxes assume that the mid-IR continuum and the [Ne II] emission are not spatially extended beyond the seeing.
The [Ne II] line profile from TW Hya is consistent with a single Gaussian profile centered at km s-1 in the stellocentric frame with a FWHM of pixels ( km s-1). Deconvolving the line width from the instrumental resolution yields an intrinsic line FWHM of km s-1. Two components (a broad component at the stellocentric velocity with a flux enhancement on the blue side of the line) are visually apparent in the line profile. However, based on the S/N detected in the continuum (Table 1) the profile shape is not a significant deviation from a single Gaussian profile. The telluric CO2 line did not divide out sufficiently for some of the TW Hya observations and results in increased uncertainty on the blue side of the line profile. The [Ne II] emission is more compact than the angular resolution (40 AU at the distance of TW Hya), which was estimated from both the mid-IR continuum of TW Hya and the telluric standard CMa, which was observed shortly before TW Hya.
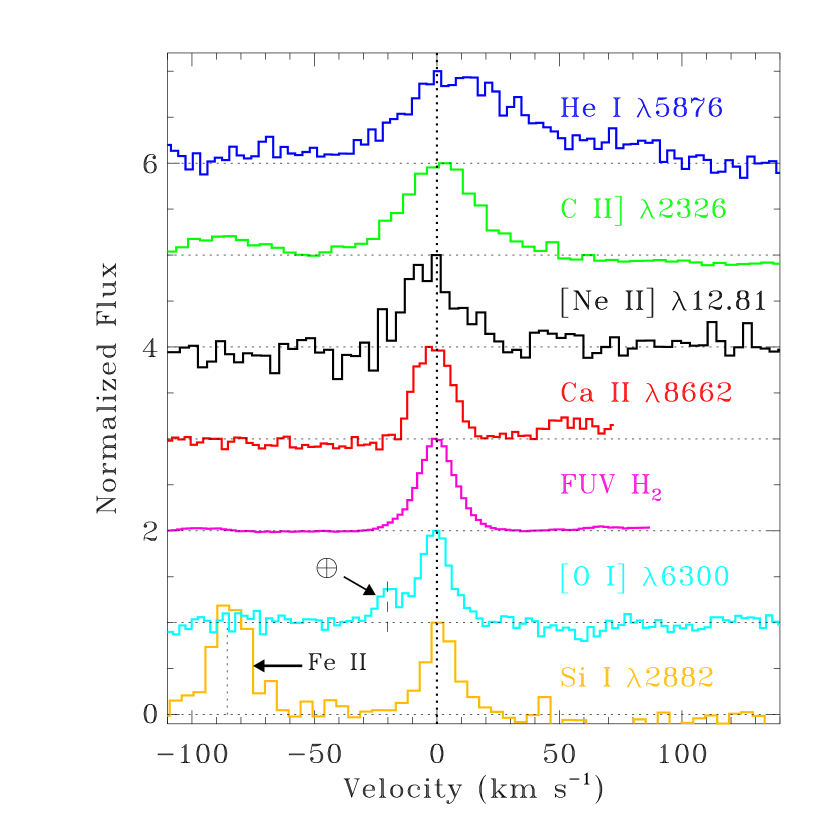
Table 2 and Figure 2 compare the [Ne II] emission to a sample of other emission lines from TW Hya, excluding those significantly affected by wind absorption (e.g., H I , O I , C II , He I , see Herczeg et al. 2002, Edwards et al. 2006). These lines show a range of emission profile shapes, and were observed at resolutions similar to that of our MICHELLE spectra. The velocity and FWHM listed in Table 2 are measured from Gaussian fits to the emission lines. The energy of the upper level () for these transitions (0.60–23.1 eV) are all substantially larger than that of the fine-structure [Ne II] line (0.10 eV). Most lines, including the Ca II IR triplet and the [O I] , show narrow emission centered at the stellocentric velocity. No high-velocity ( km s-1) or low-velocity ( km s-1) component of other optical forbidden lines are detected (Hamann, 1994; Hartigan et al., 1995). Several lines show broad redshifted emission profiles, presumably produced by the accretion flow. Many of the near-UV Fe II lines have both narrow and broad components centered at the stellocentric velocity.
4 DISCUSSION
4.1 Comparison To Other Emission Lines From TW Hya
Emission lines from CTTSs may be formed at or near the disk surface, in the accretion funnel flow and shock, in outflows, in the stellar chromosphere, or in the accretion-heated part of the stellar photosphere. We first rule out formation of the [Ne II] emission in the accretion flow and shock. Lines commonly attributed to accretion, including He I and the C IV , N V , and O VI doublets (Alencar & Batalha, 2002; Herczeg et al., 2002; Lamzin et al., 2004; Johns-Krull & Herczeg, 2007; Yang et al., 2007), have much broader line widths than the [Ne II] emission from TW Hya and are redshifted from the stellocentric velocity. Second, we rule out fast outflows because the [Ne II] line is centered at or near the stellocentric velocity and is limited to low velocities. Formation in a very slow outflow may be possible if both the front and back sides of the flow are visible. Third, we rule out a chromospheric origin. Some lines from Table 2 are attributed to chromospheric emission and seen from main-sequence dwarfs and weak-line T Tauri stars (Ayres, 2005), but these lines are narrower than the [Ne II] line. Several other emission lines, including the C I and C II] multiplets, Cl I , and some NUV Fe II lines, have slightly larger widths than the [Ne II] emission and may form in a heated stellar photosphere. However, these lines have larger energy upper levels than the fine-structure [Ne II] line and are unlikely to trace the same gas. More likely is the possibility that the [Ne II] line forms either in the inner disk or in a photoevaporative flow from the optically thin region of the disk, as suggested by the excitation energy (0.10 eV), width (21 km s-1), and velocity centroid ( km s-1) of the line.
Collisional ionization equilibrium would require temperatures of K to produce [Ne II] emission. All identified lines from TW Hya that probe K have a larger width ( km s-1) than the [Ne II] line. We therefore infer that the [Ne II] emission is not likely collisionally ionized. Instead, the emission is likely ionized by X-ray or EUV-irradiation of gas at or near the disk surface. Indeed, Glassgold et al. (2007) speculated that X-ray irradiated disks would produce strong [Ne II] emission. The observed width of the [Ne II] line is larger than that shown by Glassgold et al. (in their Fig. 5). However, Glassgold et al. (2007) considered only the emission that would arise from a non-turbulent X-ray irradiated disk that extends beyond 1 AU.
Irradiated disks are believed to produce the molecular line emission detected from TW Hya in the FUV H2, near-IR H2, and fundamental CO transitions (Weintraub et al., 2000; Herczeg et al., 2002; Rettig et al., 2004; Salyk et al., 2007; Najita et al., 2007). The emission arises from warm ( K) gas, and the FUV H2 lines in particular require irradiation by strong FUV emission from the central star. The line widths are , , and km s-1 narrower for H2 1-0 S(1), FUV H2, and fundamental CO lines, respectively, than the [Ne II] line. The narrow width of the H2 1-0 S(1) suggests formation at large radii.
Interestingly, the widths of the fundamental CO, FUV H2, and [Ne II] lines increase with their approximate formation temperatures of K (Salyk et al. 2007; Najita et al. 2003), K (as observed for TW Hya; Herczeg et al. 2004), and 4000–10,000 K (based on theoretical modeling; Glassgold et al. 2007; Hollenbach et al. 2000), respectively. This trend might indicate a common origin for the lines in a disk with an outwardly decreasing temperature gradient (e.g., Carr et al. 2004). If the [Ne II] line width results from Keplerian disk rotation, then the emission arises at an average distance of AU of the star, assuming a inclination of the disk around TW Hya (Qi et al., 2004). The trend might also indicate a common origin for the lines in a turbulent disk atmosphere with a vertically increasing temperature gradient,- i.e., increasing (transonic) turbulent broadening higher in the disk atmosphere. For example, the line width of the [Ne II] emission could be explained entirely by turbulent broadening in 10,000 K gas. With a combination of Keplerian rotation and turbulence, the line could form at disk radii larger than AU and in gas cooler than K. Alternatively, the width of the [Ne II] line could also be explained if the emission arises from a photoevaporative flow from the optically thin region of the disk (at AU). We explore these possibilities using simple scaling arguments to point out the challenges associated with these interpretations.
4.2 X-ray Excitation of the Inner Disk
The [Ne II] flux is converted to a mass from the Einstein A-value of s-1 (Kramida & Nave, 2006), a solar Ne/H abundance ratio of (Anders & Gervesse, 1989), a Ne ionization fraction of , and an average atomic mass per atom of 1.4. In LTE the fraction of Ne II in the level is 0.14 and 0.28 at 1000 and 5000 K if the electron density is larger than the critical density, cm-3, as assumed here. If the line is optically-thin and not attenuated by dust within the disk, then the gas mass is , where this range includes uncertainties in the line flux and the population of the upper level. If we assume that the [Ne II] emission arises in the annulus of an empty cylinder with a height , radius , and width , then the total hydrogen column density of the layer measured parallel to the disk is H cm-2.
Either the disk atmosphere or the photoevaporative flow scenario requires that the ionizing photons penetrate through the emission region, which constrains the neutral hydrogen column density, (H I), as measured radially from the central star. Based on the Chandra X-ray spectrum of TW Hya (Kastner et al., 2002), 23% of photons with energies keV penetrate to depths of (H I)= cm-2, but only the hardest 3% of those photons can penetrate to (H I)= cm-2. However, almost all EUV photons longward of 100 and 500 Å are attenuated for (H I) and cm-2, respectively.
If we set AU, then (H) cm-2. Even if the ionization fraction is high, (H I) will be large enough to require the ionization of Ne by X-rays and a disk height comparable to the disk radius. Such a geometrically thick disk may also be required to explain the strength of the H2 fluorescence in FUV spectra of TW Hya (Herczeg et al., 2004). The scale height of gas in hydrostatic equilibrium at AU from TW Hya can be estimated as AU. Eisner et al. (2006) calculated that the dust temperature is K at the inner dust truncation radius ( AU). However, since only a small amount of micron-sized dust is present within the 4 AU dust clearing radius (Calvet et al., 2002), the gas temperature at these radii may be significantly hotter than the dust temperature. Models of optically-thick disks with viscosity parameter suggest a gas surface density of 25–90 g cm-2 at 0.1 AU from TW Hya (D’Alessio et al., 1998). The mass of the [Ne II] emitting region would be about % of the total disk mass within 0.2 AU of the star. The [Ne II] emission in this scenario traces a thin surface layer of the disk higher than one scale height above the disk midplane. This interpretation of [Ne II] emission is challenging if because the larger total mass traced by the [Ne II] emission would require an even larger geometrical disk height.
This situation can be ameliorated if turbulent broadening contributes to or dominates the [Ne II] line width. If the disk atmosphere is turbulent and the turbulent velocity is close to the sound speed, then the FWHM of a line would be km s-1 at K, consistent with the observed line width. At this temperature the [Ne II] emission could arise from a wide range of radii, perhaps extending out to 10-20 AU. Glassgold et al. (2007) suggest that at 1–10 AU, the gas within cm-2 of the disk surface will be heated to 4000 K. At this temperature the average radii for formation of [Ne II] emission would be AU from the star.
Approximately transonic turbulence in disk atmospheres is inferred from the intrinsic line broadening of CO overtone emission from accretion disks (Carr et al. 2004; Najita et al. 1996). The dissipation of turbulence in disk atmospheres could also produce the extra heating that is needed to explain the strength of CO fundamental emission from T Tauri disks (Glassgold et al., 2004). While these observations refer to emission from cool, molecular disk gas that is located deeper in the disk atmosphere, similar transonic turbulence may characterize warmer, atomic gas higher up in the disk atmosphere where the [Ne II] emission may arise. Indeed, simulations of weakly magnetized disks find that MHD turbulence generates a warm ( K) disk corona with a transonic velocity dispersion above several disk scale heights (Miller & Stone, 2000).
4.3 Photoevaporation of an EUV-irradiated Disk Surface
On the other hand, in the disk dissipation models of Alexander et al. (2006ab) EUV irradation of the disk produces a K flow with a velocity of km s-1 from the disk surface, near the gravitational radius (see also Hollenbach & Gorti 2007). Analytical formulations for assuming an abiabatic gas (Liffman, 2003) suggest that AU AU for a CTTS with the mass of TW Hya. In the photoevaporation simulations by Font et al. (2004), most of the mass loss occurs inside AU for a source like TW Hya. While these expectations are for a radially continuous gas disk, Calvet et al. (2002) find that at 10 m the disk is optically thin within 4 AU of TW Hya. Any additional frontal illumination of the inner edge of the optically-thick disk at 4 AU by FUV and X-ray photons may provide an additional heating source that could help puff up the disk or help launch the photoevaporative flow. If the [Ne II] emission is formed in a photoevaporative flow within 4 AU of the star, the apparent line broadening could result from detecting [Ne II] emission from both the front and back sides of the disk. The profile could be slightly blueshifted if some [Ne II] emission occurs in a photoevaporative flow beyond the dust clearing radius, where emission on the back side of the disk would not be detectable. Alexander et al. (2006a) predict that the photoevaporative flow will have velocities km s-1 at distances greater than 4 AU from the star, implying the possibility of a stronger blueshifted asymmetry than is observed.
If we assume the photoevaporative flow is produced at AU, then the height of the flow (including both front and back sides of the disk) is AU. If and (H) cm-2, then AU. The velocity of a photoevaporative flow is expected to be km s-1 at 4 AU above the disk (Alexander et al., 2006a). The crossing time for the evaporating gas across the emission region on either side of the disk () is then 3.5 yr. The estimated mass loss rate is yr-1, where is the fraction of [Ne II] emission that arises in the photoevaporative flow.
Such a low-velocity ( km s-1) photoevaporative flow would be distinct from the observed high-velocity ( to km s-1) wind that dominates blueshifted absorption profiles of atomic and singly-ionized lines from TW Hya (Edwards et al. 2006; Johns-Krull et al. 2007). The estimated photoevaporation mass loss rate of about one-fifth the stellar mass accretion rate is similar to the yr-1 estimate for a radially-continuous disk that is irradiated with an EUV photon flux of phot s-1 (Hollenbach et al., 1994). Several parameters in this simple scaling argument, including , are uncertain and together could suppress our estimate for the mass loss rate. This scenario constrains the (H) in the photoevaporative flow to a narrow range. A smaller (H) would increase the volume and decrease the below the critical density by increasing , where any flow is likely less collimated. A larger (H) decreases the height and crossing time, thereby increasing the estimate of the mass loss rate.
The photoevaporation scenario is contingent upon some EUV emission reaching the disk surface. The photon flux at Å from TW Hya of phot s-1 is dominated by line emission (Alexander et al., 2005). Since both the K FUV lines and K X-ray lines are attributed to the accretion flow (Johns-Krull & Herczeg, 2007; Kastner et al., 2002), this estimated EUV emission likely applies to emission produced near the accretion shock. Whether this EUV emission reaches the disk depends on a small neutral hydrogen column density. A smaller amount of EUV emission is expected to be produced by the transition region in magnetic structures and may reach the disk, depending on the geometry of the accretion flow. Based on an analysis of FUV H2 emission, Herczeg et al. (2004) suggested that an absorbing column of (H I) cm-2 H I, perhaps in a stellar outflow, is present between the H I Ly emission from TW Hya and the warm H2 in the disk. If (H I) between the EUV and [Ne II] emission resions, then 5–15% of the EUV photons could reach the disk and lead to some photoevaporation. A larger intervening (H I) would prevent EUV photoevaporation.
4.4 Conclusions
Our lower luminosity limits for [Ne II] emission from BP Tau and DP Tau are comparable to the line luminosity from TW Hya, despite having mass accretion rates an order of magnitude larger than that onto TW Hya. [Ne II] is detected from several CTTSs with low mass accretion rates both here and in Pascucci et al. (2007). Of the few stars in the Lahuis et al. (2007) sample with measured mass accretion rates, [Ne II] emission is detected from several weak accretors but not from several strong accretors. If weak accretors do show stronger [Ne II] emission than strong accretors, this effect may be explained because the intervening (H I) in the accretion flow and wind should scale with the mass accretion and mass loss rates. However, a similar effect may be seen for X-ray-irradiation models if older CTTSs are more X-ray luminous than younger CTTSs.
The [O I] emission from TW Hya may be produced by recombination subsequent to photoionization. The [O I] lines are centered at the stellocentric velocity, do not correlate with optical veiling (Alencar & Batalha, 2002), and are not seen from WTTSs. [O I] emission is thought to arise from the disk surface of some Herbig Ae/Be stars (Böhm & Catala, 1994; Acke et al., 2005). [O I] emission produced subsequent to OH dissociation by FUV emission from the central star will be undetectable from disks around CTTSs (Störzer & Hollenbach, 2000). However, models of EUV or X-ray irradiated disks may explain some [O I] emission in the low-velocity components of CTTSs (Font et al., 2004). That the [O I] lines are narrower than the [Ne II] line suggests that, if the [O I] emission is produced in a disk, it traces less turbulent gas or gas at larger disk radius than the [Ne II] emission.
High-resolution spectroscopy of [Ne II] emission from TW Hya suggests formation in a disk irradiated by X-ray or EUV photons, although formation in a heated photosphere cannot be ruled out. The origin of the line broadening and the ionization path can be identified by high-resolution spectra of additional sources. If the line broadening is dominated by Keplerian rotation, the [Ne II] line will appear much broader from stars with disks viewed at higher inclinations. If the line broadening is dominated by turbulence, the observed line width from disks viewed at higher inclinations will only be modestly larger. If formed in a photoevaporative wind, the [Ne II] emission from stars with optically-thick inner disks will likely appear blueshifted, as only the front side of the disk will be detectable. The description of [Ne II] emission from TW Hya should apply generally to stars with small mass accretion rates. [Ne II] emission from stars with large mass accretion rates may also be produced in shocks associated with outflows.
5 Acknowledgements
We thank the anonymous referee for helpful comments that improved the clarity of the discussion. This observing time was awarded by Caltech as part of the Keck/Gemini exchange program. We thank Kevin Volk for observing support with MICHELLE during the run and for helping to identify the atmospheric lines with ATRAN. We thank Andrew Pickles for observing TW Hya during the re-commissioning of the East Arm Echelle spectrograph. We thank David Hollenbach for discussing the application of photoevaporation models to the [Ne II] line.
References
- Acke et al. (2005) Acke, B., van den Ancker, M.E., & Dullemond, C.P. 2005, A&A, 436, 209
- Alencar & Batalha (2002) Alencar, S.H.P. & Batalha, C. 2002, ApJ, 571, 378
- Alexander et al. (2005) Alexander, R.D, Clarke, C.J., & Pringle, J.E. 2005, MNRAS, 358, 283
- Alexander et al. (2006a) Alexander, R.D, Clarke, C.J., & Pringle, J.E. 2006a, MNRAS, 369, 216
- Alexander et al. (2006b) Alexander, R.D, Clarke, C.J., & Pringle, J.E. 2006b, MNRAS, 369, 229
- Anders & Gervesse (1989) Anders, E., & Grevesse, N. 1989, GeCoA, 53, 197
- Ayres (2005) Ayres, T.R. 2005, Proc. of the 13th Cambridge Workshop on Cool Stars, Stellar Systems and the Sun, Edited by F. Favata et al. ESA SP-560, European Space Agency, 2005., p.419
- Bary et al. (2003) Bary, J.S., Weintraub, D.A., & Kastner, J.H. 2003, ApJ, 586, 1136
- Batalha & Basri (1993) Batalha, C.C., & Basri, G. 1993, ApJ, 412, 363
- Böhm & Catala (1994) Böhm, T., & Catala, C. 1994, A&A, 290, 167
- Bergin et al. (2003) Bergin, E., Calvet, N., D’Alessio, P., & Herczeg, G.J. 2003, ApJ, 591, L159
- Bergin et al. (2004) Bergin, E., et al. 2004, ApJ, 614, L133
- Bergin et al. (2007) Bergin, E.A., Aikawa, Y., Blake, G.A., & van Dishoeck, E.F. 2007, PPV
- Briggs et al. (2007) Briggs, K.R., et al. 2007, A&A
- Calvet & Gullbring (1998) Calvet, N., & Gullbring, E. 1998, ApJ, 509, 802
- Calvet et al. (2002) Calvet, N., D’Alessio, P., Hartmann, L., Wilner, D., Walsh, A., & Sitko, M. 2002, ApJ, 568, 1008
- de la Reza et al. (1989) de la Reza, R., Torres, C.A.O., Quast, G.R., Castilho, B.V., & Vieira, G.L. 1989, ApJ, 343, L61
- D’Alessio et al. (1998) D’Alessio, P., Canto, J., Calvet, N., & Lizano, S. 1998, ApJ, 500, 411
- Dullemond et al. (2007) Dullemond, C.P., Hollenbach, D., Kamp, I., D’Alessio, P. 2007, proceedings of P&PV, eds. B. Reipurth, D. Jewitt, and K. Keil, 951, 555
- Edwards et al. (2006) Edwards, S., Fischer, W., Hillenbrand, L., & Kwan, J. 2006, ApJ, 646, 319
- Eisner et al. (2006) Eisner, J.A., Chiang, E.I., & Hillenbrand, L.A. 2006, ApJ, 637, L133
- Font et al. (2004) Font, A.S., McCarthy, I.G., Johnstone, D., & Ballantyne, D.R. 2004, ApJ, 607, 890
- Furlan et al. (2006) Furlan, E., et al. 2006, ApJS, 165, 568
- Glasse et al. (1997) Glasse, A.C., Atad-Ettedgui, E.I., & Harris, J.W. 1997, SPIE, 2871, 1197
- Glassgold et al. (2004) Glassgold, A.E., Najita, J.R., & Igea, J. 2004, ApJ, 615, 972
- Glassgold et al. (2007) Glassgold, A.E., Najita, J.R., & Igea, J. 2007, ApJ, 656, 515
- Gregory et al. (2007) Gregory, S.G., Wood, K., & Jardine, M. 2007, MNRAS, accepted. astro-ph/07042958
- Hamann (1994) Hamann, F. 1994, ApJSS, 93, 485
- Hartigan et al. (1995) Hartigan, P., Edwards, S., & Ghandour, L. 1995, ApJ, 452, 736
- Hartmann et al. (1998) Hartmann, L., Calvet, N., Gullbring, E., & D’Alessio, P. 1998, ApJ, 495, 385
- Herbig & Bell (1995) Herbig, G.H., & Bell, K.R. 1995, yCat, 5073
- Herczeg et al. (2002) Herczeg, G. J., Linsky, J. L., Valenti, J.A., Johns-Krull, C.M. 2002, ApJ, 572, 310 (Paper I)
- Herczeg et al. (2004) Herczeg, G.J., et al. 2004, ApJ, 607, 369
- Herczeg et al. (2006) Herczeg, G.J., et al. 2006, ApJS, 165, 256
- Hollenbach et al. (1994) Hollenbach, D., Johnstone, D., Lizano, S., & Shu, F. 1994, ApJ, 428, 654
- Hollenbach et al. (2000) Hollenbach, D., Yorke, H.W., & Johnstone, D. 2000, in Mannings V., Boss A. P., Russell S. S., eds, Protostars and Planets IV. Univ. Arizona Press, Tucson, p. 401
- Hollenbach & Gorti (2007) Hollenbach, D., & Gorti, U. 2007, to be submitted
- Hughes et al. (2007) Hughes, A.M., Wilner, D.J., Calvet, N., D’Alessio, P., Claussen, M.J., Hogerheijde, M.R. 2007, ApJ, accepted. astro-ph/07042442
- Johns-Krull & Herczeg (2007) Johns-Krull, C.M., & Herczeg, G.J.
- Kastner et al. (1997) Kastner, J.H., Zuckerman, B., Weintraub, D.A., & Forveille, T. 1997, Science, 277, 67
- Kastner et al. (2002) Kastner, J. H. Huenemoerder, D. P., Schulz, N. S., Canizares, C.R., & Weintraub, D.A. 2002, ApJ, 567, 434
- Kenyon & Hartmann (1995) Kenyon, S.J., & Hartmann, L. 1995, ApJS, 101, 117
- Kramida & Nave (2006) Kramida, A.E., & Nave, G. Eur. Phys. J. D, 39, 331
- Lahuis et al. (2007) Lahuis, F., va Dischoeck, E.F., Blake, G.A., Evans, N.J., Kessler-Silacci, J.E., & Pontpiddian, K.M. 2007, ApJ, accepted. astro-ph/07042305
- Lamzin et al. (2004) Lamzin, S.A., Kravtsova, A.S., Romanova, M.M., & Batalha, C. 2004, AstL, 30, L413
- Libbrecht & Peri (1995) Libbrecht, K.G., & Peri, M.L. 1995, PASP, 107, L62
- Liffman (2003) Liffman, K. 2003, PASJ, 2003, 337
- Lord (1992) Lord, S.D. 1992, NASA Technical Memor. 103957
- Mamajek (2005) Mamajek, E.E. 2005, ApJ, 634, 1385
- Mazzotta et al. (1998) Mazzotta, P., Mazzitelli, G., Colafrancesco, S., & Vittorio, N. 1998, A&AS, 133, 403
- Miller & Stone (2000) Miller, K.A., & Stone, J.M. 2000, ApJ, 534, 398
- Muzerolle et al. (1998) Muzerolle, J., Hartmann, L., & Calvet, N. 1998, AJ, 116, 455
- Muzerolle et al. (2000) Muzerolle, J., Calvet, N., Briceno, C., Hartmann, L., & Hillenbrand, L. 2000, 535, L47
- Muzerolle et al. (2003) Muzerolle, J., Calvet, N., Hartmann, L., & D’Alessio, P. 2003, ApJ, 597, L149
- Najita et al. (2007) Najita, J., Carr, J.S., Glassgold, A.E., & Valenti, J.A. 2007, PPV
- Pascucci et al. (2007) Pascucci, I., et al. 2007, ApJ, accepted. astro-ph/0703616
- Qi et al. (2004) Qi, C., et al. 2004, ApJ, 616, L11
- Rettig et al. (2004) Rettig, T.W., Haywood, J., Simon, T., Brittain, S.D., & Gibb, E. 2004, ApJ, 616, L163
- Roberge et al. (2005) Roberge, A., Weinberger, A.J., & Malumuth, E.M. 2005, ApJ, 622, 1171
- Salyk et al. (2007) Salyk, C., Blake, G.A., Boogert, A.C.A., & Brown, J.M. 2007, ApJ, 655, L105
- Stelzer & Schmitt (2004) Stelzer, B., Schmitt, J.H.H.M. 2004, A&A, 418, 687
- Störzer & Hollenbach (2000) Störzer, H., & Hollenbach, D. 2000, ApJ, 539, 751
- Uchida et al. (2004) Uchida, K.I., et al. 2004, ApJS, 154, 439
- Valenti et al. (1993) Valenti, J.A., Basri, G., & Johns, C.M. 1993, ApJ, 106, 2024
- Webb et al. (1999) Webb, R.A., Zuckerman, B., Platais, I., Patience, J., White, R.J., Schwartz, M.J., & McCarthy, C. 1999, ApJ, 512, L63
- Weintraub et al. (2000) Weintraub, D. A., Kastner, J. H. & Bary, J. S. 2000, ApJ, 541, 767
- Yamada et al. (1985) Yamada, C., Kanamori, H., & Hirota, E. 1985, JCP, 83, 552
- Yang et al. (2007) Yang, H., Johns-Krull, C.M., & Valenti, J.A. 2007, AJ, 133, 73
| Table 1: Source Properties | ||||||||||||
| Star | SpT | d | EW ([Ne II]) | Refs | ||||||||
| pc | km s-1 | yr-1 | Å | |||||||||
| TW Hya | K7 | 51 | 12.2 | 1.4c | 0.7 | 1.0 | 1.3 | 1,2,3,4 | ||||
| BP Tau | K7 | 140 | 15.8 | 1.8e | 0.5 | 2.0 | 1.5 | 5,6,7,8 | ||||
| DP Tau | M0 | 140 | 17f | 0.8e | 0.5 | 1.4 | 1.8 | 5,6,7,8 | ||||
| aContinuum flux level ( erg cm-2 s-1 Å-1) at 12.8m from Spitzer IRS spectra | ||||||||||||
| bS/N per pixel in the continuum in our MICHELLE observations | ||||||||||||
| c0.45–2.25 eV luminosity from high-resolution XMM spectra (Stelzer & Schmitt, 2004). | ||||||||||||
| d1.8 from Alencar & Batalha (2002) and Herczeg et al. (2004), adjusted for 51 pc distance. 0.5 from Muzerolle et al. (2000) | ||||||||||||
| e0.3–10 eV from models based on low-resolution XMM spectra (Briggs et al., 2007). | ||||||||||||
| fAverage radial velocities of GO Tau and V955 Tau from Herbig & Bell (1995). | ||||||||||||
| Mamajek (2005) | Uchida et al. (2004) | Weintraub et al. (2000) | Webb et al. (1999) | |||||||||
| Valenti et al. (1993) | Herbig & Bell (1995) | Briggs et al. (2007) | Hartmann et al. (1998) | |||||||||
| Table 2: Selected Emission Lines from TW Hya, in order of FWHMa,b | |||||||||
| Line | R | FWHMa | EW | Fluxc | Formationd | ||||
| ID | Å | eV | km s-1 | km s-1 | Å | ||||
| H | 21218 | 0.60 | 49000 | 0 | 0.02 | 1 | D | ||
| CO (fundamental)f | 24000 | 0 | 8.3 | - | - | D | |||
| Si I | 2882.551 | 5.1 | 30000 | 1 | 11 | 0.14 | 0.96 | P | |
| [O I]b | (5577.571) | 2.0 | 36000 | (0) | (12) | (0.11) | – | ||
| [ O I] | 6300.549 | 2.0 | 34000 | -1 | 12 | 0.67 | 8.7 | D? | |
| [O I] | 6364.050 | 2.0 | 26000 | 0 | 13 | 0.23 | 3.5 | D? | |
| [S II]b | (6730.81) | 1.8 | 20500. | (0) | (12) | – | |||
| [N II]b | (6583.46) | 1.9 | 21000 | (0) | (12) | – | |||
| [Fe II]b | (8616.952) | 1.7 | 27500 | (0) | (12) | – | |||
| Na Ig | (5889.951) | 2.1 | 22000 | (0) | (12) | – | |||
| Na Ig | (5895.924) | 2.1 | 22000 | (0) | (12) | – | |||
| H | FUVh | 1–2i | 25000 | 0 | 14 | - | - | D | |
| Fe II | 2371.319 | 5.6 | 30000 | -1 | 15 | 0.17 | 0.76 | ? | |
| Fe II | 2665.569 | 8.0 | 30000 | 0 | 15 | 0.09 | 0.55 | ? | |
| Ca II | 8542.362 | 3.2 | 16000 | -2 | 15 | 1.2 | 21 | P+A? | |
| Ca II | 8662.464 | 3.1 | 43000 | -1 | 16 | 0.84 | 17 | P+A? | |
| Mg II | 2791.722 | 8.9 | 30000 | 1 | 16 | 0.27 | 0.19 | P? | |
| [Ne II] | 128140 | 0.10 | 31000 | -2 | 22.5 | 62 | 5.9 | D | |
| Fe II (1)j | 2626.565 | 4.8 | 30000 | 1 | 25 | 1.3 | 6.3 | P/H? | |
| (2)j | 2626.557 | 4.8 | 30000 | 0 | 130 | 2.1 | 10.3 | H? | |
| Cl I | 1351.715 | 9.3 | 30000 | 0 | 41 | 0.18 | 0.27 | H? | |
| C I | 1656.346 | 7.5 | 30000 | 1 | 41 | 1.5 | 4.6 | H? | |
| C II] | 2326.231 | 5.3 | 30000 | 1 | 42 | 3.8 | 19 | H? | |
| He Ik | 5876.060 | 23.1 | 19000 | 10 | 50 | 0.81 | 12 | A | |
| S I | 1296.231 | 9.6 | 30000 | 0 | 52 | 0.95 | 1.3 | A? | |
| N I] | 1411.966 | 12.4 | 30000 | -7 | 83 | 1.9 | 2.8 | A? | |
| He IIl | 1640.601 | 48 | 30000 | 20 | 88 | 310 | 94 | A | |
| O III] | 1666.093 | 7.5 | 30000 | -23 | 113 | 0.8 | 1.6 | W? | |
| C III | 2297.842 | 18.1 | 30000 | 22 | 127 | 0.8 | 3.2 | A | |
| H | 4341.214 | 13.1 | 32000 | 39 | 195 | 8.1 | 81 | A | |
| H | 4861.713 | 12.8 | 32000 | 11 | 199 | 34 | 44 | A | |
| H | 4102.464 | 13.2 | 32000 | 41 | 201 | 2.9 | 23 | A | |
| C IVl | 1548.757 | 8.0 | 30000 | 110 | 300 | 93 | 186 | A | |
| N Vl | 1239.068 | 10.0 | 30000 | 60 | 340 | 15 | 30 | A | |
| aIntrinsic FWHM after deconvolution from the instrumental resolution. | |||||||||
| bAssumed properties for undetected lines in parentheses. | |||||||||
| c erg cm-2 s-1 | |||||||||
| dW=Wind, P=photosphere, H=Heated Photosphere, A=Accretion funnel, D=Disk | |||||||||
| eFrom Weintraub et al. (2000). | |||||||||
| fAveraged CO FWHM from Salyk et al. (2007). | |||||||||
| gNot detected here. Alencar & Batalha (2002) found narrow Na I D lines at the stellocentric velocity. | |||||||||
| hCoadded FUV H2 profiles by coadding many of the strongest lines from Herczeg et al. (2002). | |||||||||
| iExcited from many levels between 1–2 eV (Herczeg et al. 2002). | |||||||||
| jNUV Fe II lines from TW Hya have narrow and broad components. | |||||||||
| jProperties are for bright, narrower component. Excess weak redshifted emission is also present. | |||||||||
| lLine center and width calculate from a Gaussian fit to a non-Gaussian profile, see Johns-Krull & Herczeg (2007). | |||||||||
| mCorrected for optically-thin wind absorption | |||||||||