The onset of photoionization in Sakurai’s Object (V4334 Sgr)††thanks: Based on observations collected at the European Southern Observatory, Chile (programmes 71.D-0396, 75.D-0471, 77.D-0394).
We investigate the reheating of the very late thermal pulse (VLTP) object V4334 Sgr (Sakurai’s Object) using radio observations from the Very Large Array, and optical spectra obtained with the Very Large Telescope. We find a sudden rise of the radio flux at 5 and 8 GHz — from Jy and Jy in February 2005 to Jy and Jy in June 2006. Optical line emission is also evolving, but the emission lines are fading. The optical line emission and early radio flux are attributed to a fast shock (and not photoionization as was reported earlier) which occurred around 1998. The fading is due to post-shock cooling and recombination. The recent rapid increase in radio flux is evidence for the onset of photoionization of carbon starting around 2005. The current results indicate an increase in the stellar temperature to 12 kK in 2006. The mass ejected in the VLTP eruption is , but could be as high as , depending mainly on the distance and the clumping factor of the outflow. We derive a distance between 1.8 and 5 kpc. A high mass loss could expose the helium layer and yield abundances compatible with those of [WC] and PG1159 stars.
Key Words.:
Stars: individual: V4334 Sgr - Stars: mass loss - Stars: evolution - Planetary nebulae: general - dust, extinction1 Introduction
Helium shell flashes dominate many aspects of the evolution of AGB (Asymptotic Giant Branch) and post-AGB stars. Helium flashes (or thermal pulses) are common on the AGB but the effects on the surface properties are mitigated by the thick hydrogen envelope. Very late thermal pulses (VLTPs), which can occur after hydrogen burning has ceased, lead to large and rapid changes in the star and are the best way to constrain the physics of these thermonuclear eruptions. The VLTP in Sakurai’s Object (V4334 Sgr) has provided the first opportunity to observe such an event with modern instrumentation, and allows us to study poorly understood aspects, such as the post-VLTP mass loss and the mixing length theory (Hajduk et al. 2005).
Very few VLTP events have been observed: only V4334 Sgr (Duerbeck et al. 1997) and V605 Aql (Clayton et al. 2006; Lechner & Kimeswenger 2004) were discovered during their high-luminosity phase (respectively in 1996 and in 1918). CK Vul (in 1670) is suspected to represent a third case (Hajduk et al. 2007). FG Sge also shows evidence for current post-VLTP evolution but its status is uncertain (Jeffery & Schönberner 2006). Another five central stars of planetary nebulae (PNe) show evidence for historical VLTP eruptions, based on the presence of hydrogen-poor gas near the central star (Zijlstra 2002).
V4334 Sgr showed a high luminosity phase with a cool stellar atmosphere () within a few years after the VLTP, during which the star became hydrogen poor and carbon rich. The speed of evolution from the VLTP to maximum brightness was surprising as pre-Sakurai models predicted timescales of 100 yr. The much faster evolution has been explained as caused by suppressed convection under explosive conditions (Lawlor & MacDonald 2003; Hajduk et al. 2005). However, Miller Bertolami et al. (2006) find that the numerical time step is important, and that smaller time steps are sufficient to predict much faster evolution. The problem of convection is studied further by Herwig et al. (2006). The reheating timescale after maximum brightness is an important constraint to test the models. This evolution can be traced best by observing the ionization of the surrounding nebula. Eyres et al. (1999), Tyne et al. (2000), and Kerber et al. (2002) detected emission from atomic and ionized species around V4334 Sgr which is evidence for ionization. The existence of ionization was confirmed by Hajduk et al. (2005) based on radio observations. In this Letter, we present new radio and optical observations, showing that this early ionization was due to a fast shock. Evidence for the onset of photoionization of carbon is also found, indicating that this started around 2005. We present photoionization models of the ejecta and compare the results to various VLTP evolutionary tracks.
2 Observations
Radio emission
We have been monitoring the radio flux of V4334 Sgr to test the temperature evolution of the star. Observations were carried out with the VLA array between 2004 and 2006, at 5 GHz and 8 GHz. We observed in the hybrid BnC (2004) and AnB (2005, 2006) arrays. This reduced confusion with emission from the old, extended PN. Integration times were 3-5 hours, with 1331+305 as the flux calibrator and 1733130 as the phase calibrator. The assumed flux density of 1331+305 was 4.66 Jy at 5 GHz. Flux calibration was interpolated to V4334 Sgr. Observational parameters are summarized in Table 1. The resultant visibilities were Fourier transformed to the image plane and the dirty beam deconvolved. Convolution with a gaussian beam fitted to the dirty beam size gave images from which fluxes were measured. Natural weighting was used for the imaging. The FWHM of the gaussian beams are listed in Table 1.
Optical spectroscopy
Line emission from the central ejecta in the optical wavelength regime was first detected in 2001 by Kerber et al. (2002) using the FORS1 instrument on the VLT. We continued to monitor the object with FORS1/2 in subsequent years. Details are given in Table 2. We averaged observations taken within the same semester. The spectra were manually reduced in the standard way using iraf. Sky lines were removed using the part of the long slit spectrum outside the old PN. The old PN also contributes line emission: this is strongly dependent on position on the slit, and the old PN lines were removed by interpolation of the area around the central source. The response correction was done using various white dwarf flux standards. The line fluxes derived from the VLT spectra are listed in Table 2. The data were not corrected for reddening. The 2001 values are taken from Kerber et al. (2002).
3 Discussion
3.1 Extinction distance
The FORS long slit spectra were used to extract the spectrum of the old PN, taking care not to include any field stars or the recent ejecta. The H/H ratio gives the interstellar extinction. Assuming a case B ratio of 2.85, we derive , somewhat higher than found by Pollacco (1999). The extinction-distance diagram for stars within a few arcminutes from V4334 Sgr is derived by Kimeswenger & Kerber (1998): it shows a linear rise with distance up to 1.8 kpc, followed by a constant extinction of between 1.8 and 5 kpc.
This suggests that V4334 Sgr is located beyond 1.8 kpc. The previously used value of 1.9 kpc (e.g. Evans et al. 2006) can be considered a lower limit. Duerbeck et al. (2000) suggest –kpc based on the stellar luminosity. The line of sight reaches the scale height of the old disk at and this would provide a plausible distance.
3.2 Shock ionization
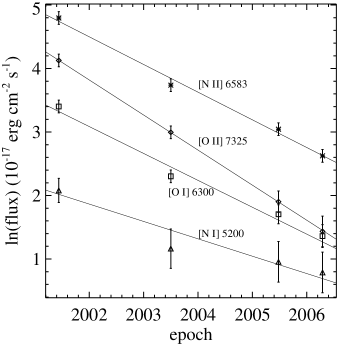
The line fluxes in Table 2 show a strong exponential decline with time (see also Fig. 1). The level of excitation is also decreasing, as the high excitation [O ii] lines are decreasing faster than lines of lower excitation. The e-folding times are 1.810.13 yr for [O ii] (the highest excitation line), 2.290.14 yr for [N ii], 2.40.2 yr for [O i], and 3.70.9 yr for [N i]. This is clearly inconsistent with photoionization by an increasingly hot central star (Kerber et al. 2002; Hajduk et al. 2005). The decrease in intensity as well as the level of excitation is consistent with a single shock that occurred somewhere before 2001 and then started cooling and recombining (cf. Kafatos 1973). The [N ii] line ratio in 2001 indicates an electron temperature K, depending on the electron density (Table 3). The [C i] ratio in 2003 indicates K. These low values indicate that cooling had already commenced by 2001.
| Date | Freq. | FWHM Beam, PA | flux | |
|---|---|---|---|---|
| [GHz] | [Jy/b] | [Jy] | ||
| 5 Feb 2004 | 8 | 1.30″1.14″, +48∘ | 10 | |
| 4 Feb 2005 | 5 | 1.37″0.96″, +68∘ | 16 | |
| 6 Feb 2005 | 8 | 0.78″0.54″, +76∘ | 14 | |
| 11 Jun 2006 | 8 | 0.73″0.65″, +46∘ | 17 | |
| 12 Jun 2006 | 5 | 1.43″1.05″, +2∘ | 19 |
| Line | 2001.44a | 2003.50b | 2005.48c | 2006.29d |
|---|---|---|---|---|
| [N i] 5198, 5200 | 8. | 3.2 0.5 | 2.6 0.5 | 2.2 0.7 |
| [N ii] 5755 | 2. | 2.1 0.7 | 1.5 | 2.2 |
| [O i] 6300 | 30. | 10. 1.5 | 5.5 0.8 | 3.9 0.8 |
| [O i] 6364 | 8. | 4. 1.2 | 2.5 0.6 | 2.1 0.7 |
| [N ii] 6548 | 40. | 15. 1.9 | 7.6 0.9 | 3.7 0.6 |
| [N ii] 6583 | 121. | 42. 4.2 | 21. 2.2 | 13.8 1.5 |
| [S ii] 6716 | 2.5 | 1.9 | 1.6 | 1.3 |
| [S ii] 6731 | 2. | 1.9 | 1.6 | 1.3 |
| [O ii] 7319, 7330 | 62. | 20. 2.1 | 6.7 1.6 | 4.2 1.0 |
| [C i] 8727 | OR | 13. 1.5 | 3.9 | 4.7 0.8 |
| [C i] 9824, 9850 | OR | 150. 15. | OR | OR |
a 300V+GG375, 4500 – 8000 Å. b 150I, 4900 – 10075 Å; 150I+OG590, 6200 – 10075 Å; 1200R+GG435, 5875 – 7365 Å. c 300V+GG435, 4800 – 8900 Å. d 600V+GG435, 4520 – 6850 Å; 600I+OG590, 6500 – 9200 Å.
The origin of the shock is not clear. No emission lines were seen during 1997. The earliest evidence for shock ionization is based on the He i recombination line, and dates from 1998 (Eyres et al. 1999; Tyne et al. 2000). High-velocity CO was seen starting late 1999 or early 2000 (Eyres et al. 2004), with an outflow velocity around 290 km s-1. Optical shock emission with velocities up to 350 / 200 km s-1 was first seen in 2001 (Kerber et al. 2002). The shock occurred close to the time of the onset of dust formation (Duerbeck et al. 2000). Neutral molecule chemistry is slow in a hydrogen-deficient environment, while ion-molecule chemistry is much faster (Woods et al. 2002). Hence UV radiation from the shock may have triggered dust formation elsewhere in the nebula through ionization of key molecular species. If the ejecta are bipolar, the dust formation could be taking place in the dense equatorial region (possibly an equatorial disk), while the shocks are internal to a fast polar outflow (Evans et al. 2006).
3.3 Photoionization
The radio flux was constant or decreased slowly between 2004 and 2005. This is consistent with the model of an early fast shock: the radio data trace the post-shock cooling and recombination of the shock and not a photoionized region. However, the 2006 observations show a strong increase in radio flux, by a factor of four within 16 months. The only optical line which appears to have strengthened is the [C i] 8727 line, but this is uncertain due to the low S/N of the 2005 data. The increase in radio flux in 2006 is therefore attributed to newly photoionized carbon which has the lowest ionization potential of all the major constituents in the gas. This process would not produce any noticeable changes in the optical or mid-IR spectrum.
We ran Cloudy models to investigate the origin of the radio flux using version c07.04.01 of the code, last described by Ferland et al. (1998). The basic models are similar to those described in Hajduk et al. (2005), with the following changes. (1) The angular diameter of the dust shell is discussed in Tyne et al. (2002) and Evans et al. (2006). Extrapolating their data to 2006 leads to an angular diameter of 100 mas. However, with such a small diameter the plasma would become optically thick at 5 GHz before the necessary emission measure could be reached. Based on the FORS2 1200R spectral image taken in 2003 (seeing 0.54″) we measured a deconvolved (gaussian) FWHM of 0.27″ for the [N ii] emitting region. This indicates that the true diameter must be 0.3 – 0.5 arcsec (van Hoof 2000). We modeled both limits of this range. (2) Abundances from Asplund et al. (1999, October 1996 values) were used, except for carbon where we used C/He = 0.1 by number (the value Asplund et al. (1999) used for their model atmospheres). (3) For the stellar spectrum we used the models of Castelli & Kurucz (2004). (4) We assumed a clumpy medium with a filling factor of 0.1 or 0.01, and a density distribution. (5) The total dust mass was the same in all models with the same distance (see Sect. 3.5). We list four models in Table 3. The implied gas-to-dust mass ratio is 580 for the kpc models and 870 for the kpc models. The ionization of carbon begins around . The radio flux (without the shock emission) as a function of is listed in Table 4. The observed radio flux is consistent with an increase in from 11 kK in 2005 to 12 kK in 2006.
3.4 Stellar evolution models
Three evolutionary tracks have been published which can fit the rapid post He-flash evolution. Herwig (2001) and Hajduk et al. (2005) proposed suppressed convection after the flash. Lawlor & MacDonald (2003) showed that with this assumption, the evolution could be closely matched; they first predicted the ’double loop’ evolution. Miller Bertolami et al. (2006) find that the initial fast changes can also be found in models with standard convection, by choosing a very small time step in the simulations. This raises the issue of the accuracy of the previous models. In all cases the initial fast evolution is caused by a hydrogen ingestion flash at the top of the helium layer.
| model 1 | model 2 | model 3 | model 4 | |
|---|---|---|---|---|
| [kpc] | 1.9 | 1.9 | 4.0 | 4.0 |
| [L⊙] | 2770 | 2770 | 12280 | 12280 |
| [arcsec] | 0.3 | 0.5 | 0.3 | 0.5 |
| 14.931 | 15.153 | 15.254 | 15.476 | |
| 15.630 | 15.852 | 15.953 | 16.175 | |
| 4.45 | 3.85 | 4.3 | 3.7 | |
| [ M⊙] | 1.95 | 1.95 | 8.65 | 8.65 |
| [ M⊙] | 1.05 | 1.22 | 6.92 | 8.05 |
| model 1 | model 2 | model 3 | model 4 | |
|---|---|---|---|---|
| 10000 | 4 | 4 | 4 | 3 |
| 11000 | 24 | 24 | 24 | 24 |
| 12000 | 340 | 330 | 350 | 340 |
| 13000 | 830 | 790 | 850 | 820 |
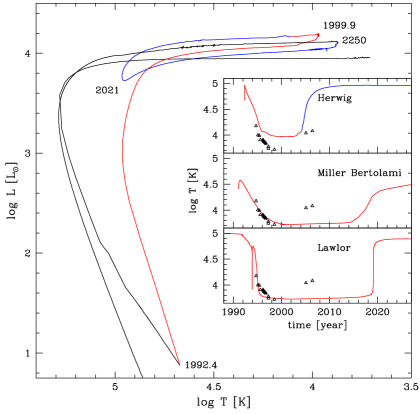
Fig. 2 shows the double-loop model of Herwig (2001) and Hajduk et al. (2005), with the top inset showing the temperature evolution during the first return. The middle inset shows the model of Miller Bertolami et al. (2006) and the lower inset shows a representative model of Lawlor & MacDonald (2003) (not necessarily their best-fitting one). The observational data points come from Duerbeck et al. (1997), Asplund et al. (1999), and Pavlenko & Geballe (2002). The last two points are from this paper. For broadband photometric data (including pre-discovery photometry), we have estimated temperatures from bolometric corrections. These corrections are based on normal giant photospheres and are therefore uncertain. The low temperature between 1995 and 2000 is caused by an expanding pseudo-photosphere (Duerbeck et al. 2000). The underlying star likely remained hotter. Such an expanding photosphere is difficult to model with a stellar evolution code and predictions for in this phase are therefore uncertain. However, this does affect the overall reliability of the track.
The three models differ in the predictions for the reheating timescale, but neither fully fits the current observations. Herwig’s model reheats faster, and the other two models considerably slower than the observations indicate. The reheating timescale in Herwig’s model can be adjusted by tuning the core mass or the mixing efficiency in the He-flash convection zone (Herwig 2001). There is a degeneracy between these two parameters and the effects of a smaller core mass and reduced mixing efficiency are to some degree interchangeable. The mass loss during the cool phase may also be an important missing ingredient in these models (Iben & MacDonald 1995).
3.5 Ejecta mass
The results from the Cloudy modeling can be summarized in the following formula for the ejected mass:
| (1) |
where is the diameter of the nebula and is the He/C mass ratio. The dominant uncertainty in the total ejecta mass comes from the distance, the volume filling factor, and the He/C mass ratio. In the Herwig models, the He/C ratio quickly evolves to a value of 2.5 after the star has reached the red end of the first loop. We take this value to determine the minimum ejecta mass, required by the photoionization models. Hence a very conservative lower limit to the ejecta mass is at kpc and at kpc assuming extreme clumping (). For a uniform outflow the lower limits would be a factor of 10 higher. The corresponding mass-loss rate over a period of roughly a decade is very high. It could be comparable to, or even exceed, the mass-loss rate during the superwind phase. A minimum ejecta mass of is sufficient to expose the intershell region (e.g. Fig. 3 in Iben & MacDonald 1995) where the C/He ratio reaches its peak value of 2.66 by mass. This would leave a central star with abundances compatible with those of [WC] and PG1159 stars. The linear momentum in the ejecta far exceeds that in the stellar radiation (even when considering multiple scattering), so that the ejecta must be energy driven. This suggests that the ejecta may have been lost instantaneously.
The dust mass determined from the continuum emission has been steadily increasing, starting in 1998 or early 1999 (Tyne et al. 2002). In June 2003, the total dust mass indicated by the sub-mm continuum was at kpc. Between January and June 2003 the dust mass increased by a factor of 1.7. The increase was used to derive a mass-loss rate of at kpc by 2003 (Evans et al. 2004). However, the concept of converting the dust growth rate to a mass-loss rate assuming a constant and high dust-to-gas ratio (1/75 by mass) can be questioned. The low observed dust temperature, in 2003 seems difficult to reconcile with the premise that half the dust was newly formed and therefore located close to the dust condensation radius. Instead, the increase in dust mass can represent a continuous dust formation or growth in a circumstellar disk (cf. Hajduk et al. 2007). Based on the flux in the Spitzer spectrum (Evans et al. 2006), we find a current dust mass at kpc, using opacities for graphite. The dust mass has increased fivefold between June 2003 and April 2005 (when the Spitzer data were taken). The average dust growth rate during this time was , a factor of 2 higher than in 2003.
4 Conclusions
The photoionization of carbon in the ejecta of V4334 Sgr has started around 2005. This is evident from a 4-fold increase in the 8 GHz radio flux observed in June 2006. Simultaneously the optical spectrum shows a continuing exponential decline, both in excitation and ionization. This indicates that the emission lines are formed in a shock which occurred around 1998 and is currently cooling and recombining. Based on the Balmer decrement in the spectrum of the old PN, we could determine that the distance to V4334 Sgr is in the range 1.8 – 5 kpc, with a preferred value 4 kpc. New Cloudy models of the photoionized region indicate that the total shell mass is at least M⊙, but could be as high as M⊙ (assuming and kpc), depending mainly on the assumed distance and clumping factor in the outflow. The models indicate that the star was at a temperature of 12 kK in 2006 and is currently evolving with a speed 1 kK yr-1. This confirms that V4334 Sgr not only displays a fast return to minimum temperature, but also a fast reheating. A comparison of the temperature evolution of the central star with observations shows that Herwig’s model reheats faster (Herwig 2001; Hajduk et al. 2005), and the other two models considerably slower than the observations indicate (Miller Bertolami et al. 2006; Lawlor & MacDonald 2003). The dust-to-gas mass ratio may be lower than hitherto assumed, depending mainly on the clumping factor of the gas. Our analysis indicates that dust formation and/or growth is slow and still ongoing.
Acknowledgments
PvH acknowledges support from the Belgian Science Policy Office (grant MO/33/017). MH acknowledges support from the Polish research grant No. N203 024 31/3879. We wish to thank R. Blomme and D. Jevremović for stimulating discussions.
References
- Asplund et al. (1999) Asplund, M., Lambert, D. L., Kipper, T., Pollacco, D., & Shetrone, M. D. 1999, A&A, 343, 507
- Castelli & Kurucz (2004) Castelli, F. & Kurucz, R. L. 2004, astro-ph/0405087
- Clayton et al. (2006) Clayton, G. C., Kerber, F., Pirzkal, N., et al. 2006, ApJ, 646, L69
- Duerbeck et al. (1997) Duerbeck, H. W., Benetti, S., Gautschy, A., et al. 1997, AJ, 114, 1657
- Duerbeck et al. (2000) Duerbeck, H. W., Liller, W., Sterken, C., et al. 2000, AJ, 119, 2360
- Evans et al. (2004) Evans, A., Geballe, T. R., Tyne, V. H., et al. 2004, MNRAS, 353, L41
- Evans et al. (2006) Evans, A., Tyne, V. H., van Loon, J. T., et al. 2006, MNRAS, 373, L75
- Eyres et al. (2004) Eyres, S. P. S., Geballe, T. R., Tyne, V. H., et al. 2004, MNRAS, 350, L9
- Eyres et al. (1999) Eyres, S. P. S., Smalley, B., Geballe, T. R., et al. 1999, MNRAS, 307, L11
- Ferland et al. (1998) Ferland, G. J., Korista, K. T., Verner, D. A., et al. 1998, PASP, 110, 761
- Hajduk et al. (2005) Hajduk, M., Zijlstra, A. A., Herwig, F., et al. 2005, Science, 308, 231
- Hajduk et al. (2007) Hajduk, M., Zijlstra, A. A., van Hoof, P. A. M., et al. 2007, MNRAS, in press
- Herwig (2001) Herwig, F. 2001, ApJ, 554, L71
- Herwig et al. (2006) Herwig, F., Freytag, B., Hueckstaedt, R. M., & Timmes, F. X. 2006, ApJ, 642, 1057
- Iben & MacDonald (1995) Iben, Jr., I. & MacDonald, J. 1995, in LNP Vol. 443: White Dwarfs, ed. D. Koester & K. Werner, p. 48
- Jeffery & Schönberner (2006) Jeffery, C. S. & Schönberner, D. 2006, A&A, 459, 885
- Kafatos (1973) Kafatos, M. 1973, ApJ, 182, 433
- Kerber et al. (2002) Kerber, F., Pirzkal, N., De Marco, O., et al. 2002, ApJ, 581, L39
- Kimeswenger & Kerber (1998) Kimeswenger, S. & Kerber, F. 1998, A&A, 330, L41
- Lawlor & MacDonald (2003) Lawlor, T. M. & MacDonald, J. 2003, ApJ, 583, 913
- Lechner & Kimeswenger (2004) Lechner, M. F. M. & Kimeswenger, S. 2004, A&A, 426, 145
- Miller Bertolami et al. (2006) Miller Bertolami, M. M., Althaus, L. G., Serenelli, A. M., & Panei, J. A. 2006, A&A, 449, 313
- Pavlenko & Geballe (2002) Pavlenko, Y. V. & Geballe, T. R. 2002, A&A, 390, 621
- Pollacco (1999) Pollacco, D. 1999, MNRAS, 304, 127
- Tyne et al. (2002) Tyne, V. H., Evans, A., Geballe, T. R., et al. 2002, MNRAS, 334, 875
- Tyne et al. (2000) Tyne, V. H., Eyres, S. P. S., Geballe, T. R., et al. 2000, MNRAS, 315, 595
- van Hoof (2000) van Hoof, P. A. M. 2000, MNRAS, 314, 99
- Woods et al. (2002) Woods, P. M., Millar, T. J., Zijlstra, A. A., & Herbst, E. 2002, ApJ, 574, L167
- Zijlstra (2002) Zijlstra, A. A. 2002, Ap&SS, 279, 171