Constraints on secondary 10-100 EeV gamma ray flux in the minimal bottom-up model of Ultra High Energy Cosmic Rays.
Abstract
In a recently proposed model the cosmic rays spectrum at energies above EeV can be fitted with a minimal number of unknown parameters assuming that the extragalactic cosmic rays are only protons with a power law source spectrum [1]. Within this minimal model, after fitting the observed HiRes spectrum with four parameters (proton injection spectrum power law index, maximum energy, minimum distance to sources and evolution parameter) we compute the flux of ultra-high energy photons due to photon-pion production and e+e- pair production by protons for several radio background models and a range of average extragalactic magnetic fields.
The “ankle” in the Ultra-high Energy Cosmic Ray (UHECR) spectrum can be interpreted as an absorption “dip” at energies EeV [1], due to the propagation of extragalactic protons over large distances in the cosmic microwave background (CMB) [2]. This would agree with the indication of a transition from heavy to light primary nuclei observed by the HiRes collaboration at energies close to 5 eV [3]. In this case the UHECR HiRes spectrum [4], in which the GZK cutoff [5] is present, can be fitted with a minimal number of unknown parameters assuming the extragalactic cosmic rays are only protons with a power law source spectrum with [1]. This is a minimal model of UHECR.
The GZK process produces pions. From the decay of we obtain photons, which we call “GZK photons”. Previously we studied in detail the GZK photon flux dependence on different unknown parameters of the source spectrum and distribution and the intervening cosmological backgrounds [6]. Below we breafly discuss the perspectives for photon detection in the minimal UHECR model (for more details see Ref. [7]).
We use a numerical code developed in Ref. [8, 6] to compute the flux of GZK photons produced by a homogeneous distribution of sources emitting originally only protons. This is the same numerical code as in Ref. [6], with a few modifications described in details in ref. [7].
As it is usual, we take the spectrum of an individual UHECR source to be of the form:
| (1) |
where provides the flux normalization, is the spectral index and is the maximum energy to which protons can be accelerated at the source. The source density is defined by
| (2) |
where parameterizes the source density evolution ( corresponds to non-evolving sources with constant density per comoving volume) and and are respectively the redshifts of the closest and most distant sources. Sources with have a negligible contribution to the UHECR flux above eV. The value of is connected to the density of sources and influences strongly the shape of the “bump” produced by the pile-up of protons which loose energy in the GZK cutoff and the strength of the GZK suppression [10, 11, 12]. Here we fix and consider three values for , namely 0, 0.005 and 0.01 in Eq. (2).
The main energy loss mechanism for photons with eV is pair production on the radio background and cascade electron and positrons losses in the Extra Galactic Magnetic Fields (EGMF). Here we assume either the minimal intervening radio background of Clark et al. [13]) and EGMF G or the largest radio background of Protheroe and Biermann [14]) and EGMF G, and many different source models.
We consider many different proton spectra resulting from changing the slope and the maximum energy in Eq. 1 within the ranges and eV and the source evolution parameter in Eq.(2) within the range . We fit the observed spectrum UHECR [4] at energies EeV with these models, which requires a steaply falling source proton spectra with . For such injected proton spectra the GZK photons reaching us are subdominant at all energies. Details of the fiting procedure can be found in Ref. [7].
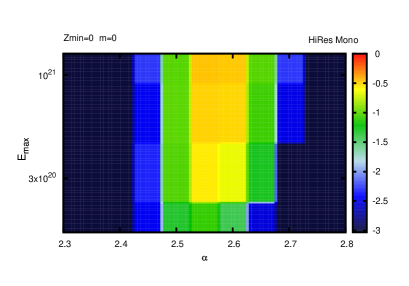
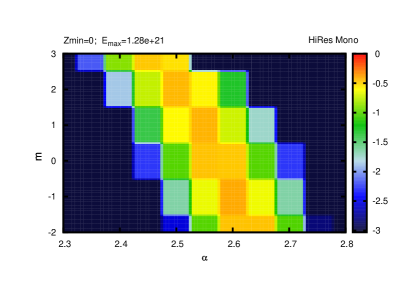
In Fig. 1 and Fig. 2 we show the logarithm of the -value in a color coded scale, from best () to worse ( close to zero), which measures the consistency level of the predicted UHECR proton flux with the HiRes data, for different parameter ranges.
We can see from the figures that fitting the UHECR data at EeV and above, requires the initial proton spectrum to be relatively hard, with in Eq.(1). Fig. 1 shows that this range does not depend strongly on for a continuous distribution of sources. In Ref. [7] it is shown that if instead there are no sources within a distance of Mpc, i.e. if , the HiRes observed spectrum is not fitted as well anymore, and a relatively high maximum energy eV is required for a reasonable fit.
The low energy part of the predicted spectrum depends mostly on the power law index and source evolution index . In Fig. 2 we show the goodness of fit -value as function of and for eV for . This figure cleary shows the degeneracy between the parameters and : as increases from to 3 the value of of the best fits decreases from to .
Let us now discuss the secondary photon fluxes. The main difference between the minimal model we are concentrating on here and other models (see Ref. [6]) is that in the minimal model one fits the UHECR data with extragalactic protons from low energies EeV, what requires a hard spectrum with index (see Figs. 1 and 2). In this case, as mentioned above, the GZK photon flux is always sub-dominant, at all energies.
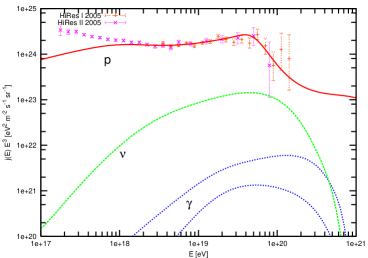
As an example, in Fig. 3 we show the possible range of GZK photon fluxes for the same proton spectrum. Here we do not deal with neutrinos in any detail, but just to compare the photon and neutrino fluxes produced in the same GZK processes, in Fig. 3 we also plotted the cosmogenic neutrino flux per flavor for the same model. Even if the neutrino flux is much higher than the photon flux, its detection may be even more difficult due to the strongly reduced probability of neutrinos to produce air-showers.
In Fig. 3 one can see that the best energy range to find GZK photons is EeV. At higher energies, the small event statistics will not allow to find a 1% fraction of photons in the UHECR flux, while at lower energies the photon fraction is strongly reduced.
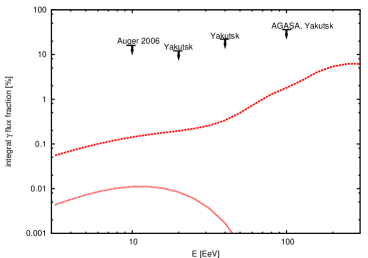
In Fig. 4 we show the GZK photon fraction given in percentage of the integrated UHECR flux above the energy as function of , for the whole parameter space we consider (i.e. maximum source proton energy eV, source evolution parameter , power law index and minimum redshift of the sources ). Present limits on the photon fraction from Auger [20], Yakutsk [21] and combined AGASA/Yakutsk [22] data are also shown in the figure. It is clear that, contrary to the case of top-down models (which are restricted already by present bounds on the GZK-photon fraction [6]) the present limits are well above the expected the GZK photon fraction in the minimal UHECR model by a factor of 10 to 100 depending on the energy (see Fig. 4). The detection of GZK photons in this model will remain as a task for the future.
We find that the expected photon fraction of the integrated flux above EeV in the minimal UHECR models, is to independently of the unknown
The South site of the Pierre Auger Observatory after several years of data taking will probably be able to reach a photon fraction sensitivity of the order of in the integrated flux close to EeV. As can be seen in Fig. 4 this is the level of the largest GZK photon fraction expected in the minimal UHECR model. Larger future observatories like Auger North plus South [23] and EUSO [24] could probe lower photon fractions if they are able to collect statistics a factor of 5-10 larger than Auger South and have thresholds around eV (provided these experiments are sensitive to photon primaries).
We have assumed that the sources emit only protons, however our predictions for GZK photon fractions shown in Fig. 4 would not change too much if nuclei primaries were present too, as assumed in the so called “mixed models” [25]. The reason is that even in mixed models, primary protons dominate the UHECR flux at high energies EeV, i.e. in the energy region where the primary protons produce secondary GZK photons.
As a final remark let us mention that even if the GZK photon fluxes considered here are very small, much larger fluxes are possible in more general models, which are not restricted by the condition that all the UHECR spectrum from energies eV to the largest is explained with extragalactic protons [6].
References
- [1] V. Berezinsky, A. Gazizov and S. Grigorieva, Phys. Rev. D 74, 043005 (2006).
- [2] C. T. Hill and D. N. Schramm, Phys. Rev. D 31, 564 (1985); V. S. Berezinsky and S. I. Grigorieva, Astron. Astrophys. 199 (1988) 1.
- [3] R. U. Abbasi et al. [HiRes Collaboration], Astrophys. J. 622, 910 (2005).
- [4] D. R. Bergman (HiRes Collaboration), 29th ICRC, Pune (2005) 00, 101-104.
- [5] K. Greisen, Phys. Rev. Lett. 16, 748 (1966); G. T. Zatsepin and V. A. Kuzmin, JETP Lett. 4, 78 (1966) [Pisma Zh. Eksp. Teor. Fiz. 4, 114 (1966)].
- [6] G. Gelmini, O. Kalashev and D. Semikoz, arXiv:astro-ph/0506128.
- [7] G. Gelmini, O. Kalashev and D. Semikoz, arXiv:astro-ph/0702464.
- [8] O.E. Kalashev, V.A. Kuzmin and D.V. Semikoz, astro-ph/9911035; Mod. Phys. Lett. A 16, 2505 (2001) [astro-ph/0006349]. O.E. Kalashev Ph.D. Thesis, INR RAS, 2003.
- [9] A. Mucke et al., Comput. Phys. Commun. 124, 290 (2000).
- [10] M. Kachelriess, D. V. Semikoz and M. A. Tortola, Phys. Rev. D 68, 043005 (2003).
- [11] P. Blasi and D. De Marco, Astropart. Phys. 20 (2004) 559.
- [12] M. Kachelriess and D. Semikoz, Astropart. Phys. 23, 486 (2005).
- [13] T. A. Clark, L. W. Brown, and J. K. Alexander, Nature 228, 847 (1970).
- [14] R. J. Protheroe and P. L. Biermann, Astropart. Phys. 6, 45 (1996) [Erratum-ibid. 7, 181 (1997)]
- [15] F. Stecker, M. Malkan and S. Scully, Astrophys. J. 648, 774 (2006).
- [16] G. Gelmini, O. Kalashev and D. Semikoz, (in preparation).
- [17] Z. Fodor, S. D. Katz and A. Ringwald, Phys. Rev. Lett. 88, 171101 (2002) and JHEP 0206, 046 (2002).
- [18] G. Cowan “Statistical data analysis”, Oxford University Press, 1998, Section 9.4.
- [19] S. Baker and R.D. Cousins, Nucl. Instrum. Methods 221, 437 (1984); Particle Data Group’s Statistics Review (2004).
- [20] J. Abraham et al. [Pierre Auger Collaboration], Astropart. Phys. 27, 155 (2007).
- [21] A. V. Glushkov et al. arXiv:astro-ph/0701245.
- [22] G. I. Rubtsov et al., Phys. Rev. D 73, 063009 (2006).
- [23] Auger North web-site can be found here: http://www.augernorth.org/.
- [24] EUSO: http://www.euso-mission.org; JEM/EUSO: I. Inoue and E. Ebisuzaki, 6th COSPAR Scientific Assembly. Held 16 - 23 July 2006, Beijing, China., p.2902.
- [25] D. Allard, E. Parizot and A. V. Olinto, Astropart. Phys. 27, 61 (2007).
- [26] P. G. Tinyakov and I. I. Tkachev, arXiv:astro-ph/0612359.