A Spectroscopic Study of the Algol-type Binaries S Equulei and KO Aquilae: Absolute Parameters and Mass Transfer††thanks: Based on observations collected at the Catania Astrophysical Observatory (Italy)
Abstract
We present and analyze high-resolution optical spectra of two Algol binaries, namely S Equ and KO Aql, obtained with the ech lle spectrograph at Catania Astrophysical Observatory. New accurate radial velocities for the hotter primary components are obtained. Thanks to the cross-correlation procedure, we were able to measure, for the first time to our knowledge, radial velocities also for the cool secondary components of S Equ and KO Aql. By combining the parameters obtained from the solution of the radial velocity curves with those obtained from the light curve analysis, reliable absolute parameters of the systems have been derived. The rotational velocity of the hotter components of S Equ and KO Aql has been measured and it is found that the gainers of both systems rotate about 30% faster than synchronously. This is likely due to mass transfer across the Lagrangian point from the cooler to the hotter component. The lower luminosity of the mass-gaining components of these systems compared to normal main-sequence stars of the same mass can be also an effect of the mass transfer. The H profiles were analyzed with the “synthesis and subtraction” technique and reveal clear evidence of mass transfer and accretion structures. In both systems, especially before the primary eclipses and afterwards, we clearly observed extra-absorption lines. From the integrated absorption and the radial velocity variations of these features, we found that the mass accretion is very dense around the impact region of the hotter components. A double-peaked emission in the spectra of S Equ was seen outside the eclipses. One of these peaks is likely originated in a region between the center of mass and the cooler component, which is occupied by the flowing matter. Furthermore, the H difference spectra of S Equ and KO Aql display also emission features, which should be arising from the magnetic activity of the cooler components.
keywords:
stars: binaries: eclipsing - stars: mass transfer - stars: individual: S Equ, KO Aql1 Introduction
Algol systems are close, interacting binaries, which consist of a cool, giant or subgiant secondary star of F-K spectral type that fills in its own Roche lobe and transfers mass and angular momentum to a hot and more massive B-A type main-sequence primary star. They are an important astrophysical laboratory for the study of different phenomena such as mass transfer and accretion, magnetic activity in the late-type companion, angular momentum and orbit evolution. A crucial need for the study of all these processes is the knowledge of the basic stellar and orbital parameters. In the last decades, the number of Algol-type binaries with reliable fundamental parameters has considerably increased due to the availability of high-resolution spectroscopic data analyzed with new powerful techniques (e.g. cross-correlation, Popper Jeong, 1994) to measure radial velocities, and to the accurate analysis of multi-band (from visible to near-IR wavelength) light curves with sophisticated spot models (e.g., Lázaro et al. 2004).
Observational evidences of mass transfer activity and accretion structures in Algols are: (i) the variations of the light and color curves, (ii) distortions of the radial velocity curves of the primary components, (iii) the mass-gainer hotter components rotating faster than synchronously, and (iv) extra emission and/or absorption features in strong spectral lines such as H and H. Some theoretical works have tackled the problem of Roche overflow and mass transfer, predicting the path of the gas stream and the accretion structures around the primary component (see, e.g., Prendergast & Taam 1974, Lubow & Shu 1975, Peters 1989).
In more recent years, different spectral behaviors (especially extra H emission and/or absorption features) have been observed for short- and long-period Algol systems and have been attributed to different effects of mass transfer due to its strength and to the system geometry (Richards & Albright 1999). In long-period systems (P > 6 days), the gas stream misses the primary component and give rise to a "permanent accretion disk", because the size of the mass gainer is very small relative to the binary separation. The mass transfer and accretion process is more complex in short-period Algols (P 6 days). In this case, the stream particles mostly impact the primary’s photosphere due to the large size of the primary relative to the separation of the components. The accretion structure is called a "transient accretion disk" in Algols with orbital periods in the range 4.5–6 days (Kaitchuck Honeycutt 1982) and an "accretion annulus" in the systems with Porb < 4.5 days (Richards et al., 1996). A wide spectroscopic survey of short- and long-period Algol systems aimed at the study of mass transfer has been performed by Richards Albright (1999) and Vesper et al. (2001). The two Algol systems studied by us in the present work are both short-period ones.
S Equulei (BD +04°4584, HD 199454, HIP 103419, V4) is a semidetached Algol-type eclipsing binary with an orbital period of P = 3.4361 days. The hotter and cooler components have been classified as B9.5 V and F9 III-IV, respectively, by Plavec (1966) and Plavec Polidan (1976).
The first complete light curve was presented by Catalano & Rodonò (1968) who also obtained the light curve solution. They found the system to be partially eclipsing and observed some peculiarities in the light curve. In particular, they noticed a decrease in luminosity, especially in light (about ), occurring near 0.9 phase. They interpreted this anomaly as due to the gaseous stream. Piotrowski et al. (1974) have discussed the distortions of the light curves of some semi-detached systems, including S Equ with the Catalano & Rodonò data. They ascribed the brightening observed in several systems just after the primary minimum to emission from the gas stream that is observed along its axis, in the direction of higher optical depth. The luminosity decrease observed before the primary minimum is attributed to absorption by electron scattering produced by the stream itself that is projected against the disk of the hotter component at these phases. A more recent light curve solution (Zola, 1992) suggests a third light comparable to the contribution of the cooler component to the total flux of the system.
Richards Albright (1999), Vesper et al. (2001), and Richards (2001) have studied S Equ spectroscopically and found single-peaked H emission features with additional weak double-peaked emission at some epochs, indicating mass transfer activity and a transient disk structure around the primary component. Doppler tomography based on the H differences spectra displays extra-absorption and/or emission due to the gas stream, accretion structures, and chromospheric activity associated with the cooler component.
A detailed O–C analysis of the times of minima of S Equ was recently performed by Soydugan et al. (2003). They found an increase in the orbital period of the system with a rate of 0.102 s yr-1, requiring a mass transfer rate M☉ yr-1 from the secondary to the primary component.
KO Aquilae (BD +10°3655, HD 92177, V4) is also a classical Algol-type binary. Its variability was discovered by Hoffmeister (1930) and its orbital period was determined as 2.864071 days by Plaut (1932). Sahade (1945) estimated the spectral type of the primary component as A0. Blanco Cristaldi (1974) and Mader Angione (1996) analyzed the light curves of the system and determined the stellar parameters. In the latter study, an orbital period increase with a rate of 0.375 s yr-1 was also determined and explained as due to the mass transfer process. Sahade (1945) published the radial velocity curve and orbit solution of the primary component using plate spectra. He was not able to detect any sign of the cool component in his spectra. Vesper et al. (2001) obtained only one spectrum in the H region, at the orbital phase 0.611, and observed extra absorption and emission attributed to accretion structures around the primary component.
The basic orbital and physical parameters of S Equ and KO Aql, as compiled from the literature, are reported in Table 1.
In this work, we present the results of the analysis of new high-resolution echélle spectra of S Equ and KO Aql. The observations and data reduction are described in §2. We report the radial velocity measurements and the first complete orbit solutions for the components of S Equ and KO Aql in §3. The projected rotational velocities of the hotter components are discussed in §4. The results of the application of synthetic spectra to reproduce the photospheric contribution of both components, to refine the spectral classification, and to study the H extra-absorption and emission features are presented in §5 and §6. Finally, the results are discussed in §7 and summarized in §8.
| System | Spectral | Porb | i | T1 | T2 | r1 | r2 | Ref. |
|---|---|---|---|---|---|---|---|---|
| Type | (days) | (deg) | (K) | (K) | (=R1/a) | (=R2/a) | ||
| S Equ | B8-9.5V + F9III-IV | 3.436128 | 87.25 | 11200 | 5255 | 0.185 | 0.219 | 1, 2 |
| KO Aql | A0 + … | 2.863965 | 77.86 | 9900 | 4425 | 0.144 | 0.277 | 3, 4 |
-
1Zola (1992), 2Kreiner (2004), 3Sahade (1945), 4 Mader Angione (1996)
2 Observations and Data Reduction
The spectroscopic observations have been performed at the Catania Astrophysical Observatory with the ech lle spectrograph (FRESCO), which is fiber-linked to the 91-cm telescope. The data were obtained during two observing runs, with observing nights spread from 12 September to 19 November 2003 and from 12 April to 29 July 2004. The spectra were obtained using the ech lle configuration based on a 300 lines/mm echellette grating as cross-disperser element and an echelle grating with 79 lines/mm. A CCD camera with a thinned back-illuminated SITe chip of 10241024 pixels (pixel size 24 m) refrigerated to C by liquid nitrogen was used to acquire the data. The spectra have a resolution R 21 000 and cover the wavelength range from 4300 to 6650 separated into 19 orders. We have obtained 27 and 37 spectra for S Equ and KO Aql, respectively. The integration times for the variables were in the range 40–55 minutes, and the S/N ratio reached was typically between 50 and 80 at the continuum near the H, depending on the weather conditions. More information about the observations can be found in Table 2.
In addition to S Equ and KO Aql, we also observed some reference stars, whose spectral types are similar to those of the components of the variables. We have chosen the non-active and slowly-rotating standard stars 10 Tau (F9 IV-V) and Boo (K1.5 III) to mimic the cooler components of S Equ and KO Aql, respectively. The bright, slowly-rotating stars, Vega (A0 V, V km s-1), Vir (F9 V, V km s-1), 5 Ser (F8 III-IV, V km s-1) and Boo (K1.5 III, V km s-1) have been chosen as templates for the radial velocity measurements of the hotter and cooler components and have been observed several times during each run.
The data reduction was performed by using the ECHELLE task of IRAF111IRAF is distributed by the National Optical Astronomy, which is operated by the Association of University for Research in Astronomy, inc. (AURA) under cooperative agreement with the National Science Foundation. package following the standard steps: background subtraction, division by a flat field spectrum given by a halogen lamp, wavelength calibration using the emission lines of a Thorium-Argon lamp, and normalization through a polynomial fit to the continuum.
| Observing | Number | Exposure | Number | |
| System | Runs∗ | of nights | time (s) | of spectra |
| S Equ | 1 | 8 | 2400–3300 | 11 |
| 2 | 15 | 2400–3300 | 16 | |
| KO Aql | 1 | 10 | 2400–3300 | 11 |
| 2 | 20 | 2400–3300 | 26 | |
| Standard Stars | ||||
| Vega (A0V) | 1 | 8 | 15–30 | 8 |
| 2 | 19 | 15–30 | 20 | |
| 10 Tau (F9IV-V) | 1 | 2 | 600 | 2 |
| Vir (F9V) | 2 | 10 | 300–600 | 10 |
| 5 Ser (F8III-IV) | 2 | 2 | 720 | 2 |
| Boo (K1.5III) | 2 | 30 | 20–30 | 35 |
-
∗Run 1: 12 September – 19 November 2003
Run 2: 12 April – 29 July 2004
The red part of the spectra is affected by many water vapor and O2 telluric lines. We have removed these lines at the H wavelengths using the spectra of Altair (A7 V, km s-1) and Leo (B7 V, km s-1) acquired during the observing runs. These spectra have been normalized, also inside the very broad H profile, to provide valuable templates for the water vapor lines. Applying an interactive method that is described by Frasca et al. (2000), the telluric lines were cleaned from the spectra of S Equ and KO Aql.
3 Radial Velocities and Orbit Solutions
The cross-correlation technique (CCT) has been widely and successfully used, after the advent of electronic detectors, for the measurements of radial velocity (RV) reaching precisions as small as a few tens of m s-1 in particular cases, leading to the detection of giant planets around solar-type stars (e.g., Mayor & Queloz, 1995).
By means of CCT, RVs of many binary systems were obtained with better precision and, in several single-lined binaries, the signal of the previously unseen companion has been detected. In the case of Algol-type binaries, the RV measurement of the cooler components is normally hampered by the strong luminosity contrast between the primary and secondary stars. The CCT has been proven to be very powerful for detecting the RVs of the secondary components of Algol systems (e.g., Holmgren 1988, Hill 1993, Khalesseh & Hill 1992, Maxted & Hilditch 1995).
In the present work, RVs of both components of S Equ and KO Aql were derived by means of the CCT using the IRAF task FXCOR (e.g. Tonry & Davis 1979, Popper & Jeong 1994). The wavelength ranges were selected to exclude Balmer and Na i D2 lines, which strongly broaden the cross-correlation function (CCF) with their wings and can also be contaminated by the mass transfer and chromospheric activity. The spectral regions heavily affected by telluric absorption lines (e.g. the O2 band 6276-6315) were not used. The RVs of the components of S Equ and KO Aql, listed in Tables 3 and 4 together with their standard errors, are the weighted averages of the values obtained from the cross-correlation of each order of the target spectra with the corresponding order of the standard star spectrum. The weight Wi = 1/ has been given to each measurement. The standard errors of the weighted means have been calculated on the basis of the errors () in the RV values for each order according to the usual formula (e.g., Topping, 1972). The values are computed by FXCOR according to the fitted peak height as described by Tonry & Davis (1979).
Spectra of the RV standard stars Boo (K1.5 III) and Vir (F9 V) have been used as templates for deriving the radial velocity of the secondaries of KO Aql and S Equ, respectively. An average high-S/N spectrum of Vega was instead used as template for the measurement of the RV of the primaries. As pointed out by Griffin (1999), it is not easy to achieve very accurate radial velocity measurements (accuracy better than 100 m s-1) for early type stars, due to the small number of suitable lines spread in a wide wavelength range and to other factors affecting the early-type line spectra. She found that real stellar spectra can be used as RV templates, because they are free from uncertainties in the tabulated wavelengths and have line shapes and intensities that are actually encountered. From cross-correlation of several high-resolution spectra of Vega with an average template built up with Sirius spectra, she found RV errors of about 250–350 m s-1. These errors, possibly systematic, could be related to the known low-amplitude Scuti-type variability of Vega (e.g., Samus et al. 2004) but are much smaller than the standard errors on the individual RVs of the primary components of S Equ and KO Aql (typically from 1 to 7 km s-1), and so they can be neglected.
3.1 S Equ
The RV curve of the primary component of S Equ has been obtained by Plavec (1966) based on plate spectra, which were taken by Petrie and Thackeray at Dominion Astrophysical Observatory and Radcliffe Observatory. The orbital solution obtained by them and, subsequently, by Lucy Sweeney (1971) on the same very scattered data is characterized by a relatively large eccentricity (). This rather high value is not supported by the light curves with equally spaced minima of the same duration observed by Catalano & Rodonò (1968) and Zola (1992). Our RV data definitely exclude an eccentricity larger than about 0.02, and so a circular orbit was assumed in the following analysis. Up to now, there has been no published RV curve of the secondary component, to our knowledge.
| HJD | Orbital | Vh | Vc |
|---|---|---|---|
| 2 450 000+ | Phase | (km s-1) | (km s-1) |
| 2895.4598 | 0.1907 | 2.6 | 15.5 |
| 2896.4473 | 0.4781 | 3.0 | – |
| 2910.4581 | 0.5556 | 6.9 | – |
| 2922.3630 | 0.0202 | 5.6 | 3.8 |
| 2922.4364 | 0.0416 | 6.5 | 4.2 |
| 2923.4058 | 0.3237 | 9.1 | 7.1 |
| 2924.4177 | 0.6182 | 4.9 | 4.7 |
| 2933.3604 | 0.2207 | 7.1 | 4.7 |
| 2934.2877 | 0.4906 | 5.1 | 15.0 |
| 2934.3345 | 0.5042 | 3.8 | 10.8 |
| 2934.3619 | 0.5122 | 4.6 | 8.1 |
| 3155.5306 | 0.8779 | 1.3 | 2.9 |
| 3157.5783 | 0.4738 | 2.0 | – |
| 3158.5586 | 0.7591 | 1.9 | 3.4 |
| 3160.5341 | 0.3340 | 2.6 | 3.5 |
| 3166.5869 | 0.0955 | 1.9 | 3.1 |
| 3167.5542 | 0.3770 | 1.4 | 2.6 |
| 3168.5489 | 0.6665 | 2.3 | 3.7 |
| 3170.5519 | 0.2494 | 1.7 | 3.7 |
| 3171.5905 | 0.5517 | 1.9 | 8.0 |
| 3185.5247 | 0.6069 | 2.5 | 4.5 |
| 3186.4374 | 0.8725 | 1.7 | 3.8 |
| 3202.5972 | 0.5754 | 1.5 | 5.2 |
| 3203.4302 | 0.8178 | 1.6 | 4.0 |
| 3213.4549 | 0.7353 | 1.9 | 5.0 |
| 3214.4695 | 0.0290 | 1.6 | 2.9 |
| 3214.5830 | 0.0636 | 1.7 | 2.2 |
In Figure 1, the measured RVs and the associated error bars of the components of S Equ are plotted as a function of the orbital phase. Filled and open circles represent the primary and secondary components, respectively. The orbital solution (dashed line for the cooler and solid line for the hotter component) was determined, assuming circular orbits, by a least-squares fit which reproduces very well all the observed RVs. We report in Table 5 the orbital parameters of the system derived from the solution of our radial velocity curves and compare them with with the values derived by Plavec.
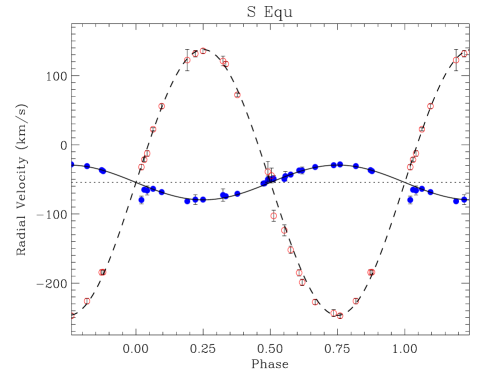
In the orbital solution of Plavec (1966) given in Table 5, the systemic velocity, , and the semi–amplitude of the RV curve, , were found to be km s-1 and km s-1, respectively.
3.2 KO Aql
Sahade (1945) obtained the first RV measurements and orbital solution for the primary component of KO Aql based on low-resolution spectra. He was not able to detect the secondary component due to its very low contribution to the spectrum of the system observed at blue wavelengths. Then, Lucy Sweeney (1971) performed a new orbital solution for the primary component with results similar to those of Sahade (1945). We have obtained high-resolution spectra that allowed us to determine the orbital parameters of the cooler component for the first time and those of the hotter one with a better precision than in previous studies. The RVs were measured from the observed spectra using the cross-correlation technique as described above. Two template spectra, Vega for primary component and Boo for secondary component, have been used for the CCT. The final RVs for KO Aql are listed in Table 4. The larger errors in the velocities of the secondary (up to 3–4 times the primary’s ones) are due to the very low contribution of the secondary star to the observed spectrum and to its high rotational velocity that broaden and weaken its spectral lines. The fit of an eccentric solution to the observed RVs of both components provided very low, not-significant values of eccentricity (). Thus, a circular orbit was assumed for the fit of the observed RV curves, obtaining the elements reported in Table 5, where the ephemeris was adopted from Kreiner (2004).
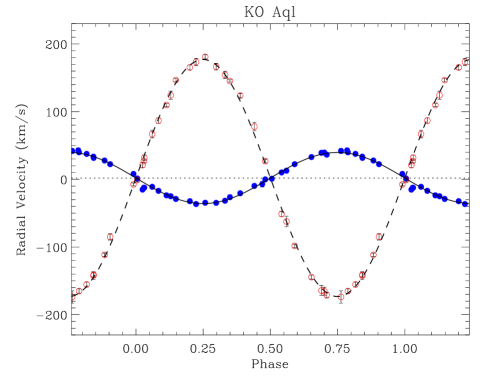
A plot of the observed RVs together with the fitted RV curves is shown in Fig. 2. The orbital solutions determined by Sahade (1945) for only the primary component and that obtained in this work (see Table 5 for comparison) agree very well with each other.
| HJD | Orbital | Vh | Vc |
|---|---|---|---|
| 2 450 000+ | Phase | (km s-1) | (km s-1) |
| 2895.4293 | 0.4696 | 4.2 | – |
| 2896.3330 | 0.7851 | 3.4 | – |
| 2910.3800 | 0.6897 | 2.1 | 7.2 |
| 2922.2714 | 0.8416 | 0.3 | 5.8 |
| 2923.2988 | 0.2003 | 1.2 | 3.6 |
| 2924.3282 | 0.5598 | 1.1 | 7.8 |
| 2925.3135 | 0.9038 | 1.5 | 4.7 |
| 2933.3237 | 0.7006 | 1.5 | 6.1 |
| 2934.2506 | 0.0242 | 1.5 | 3.8 |
| 2959.2777 | 0.7625 | 3.8 | 9.1 |
| 3125.5480 | 0.8164 | 1.5 | 3.6 |
| 3126.4985 | 0.1483 | 1.3 | 2.7 |
| 3127.5205 | 0.5051 | 1.1 | – |
| 3137.5032 | 0.9906 | 2.2 | 2.1 |
| 3137.5437 | 0.0047 | 2.1 | 2.8 |
| 3138.5306 | 0.3493 | 3.4 | 1.7 |
| 3139.5625 | 0.7096 | 1.4 | 4.3 |
| 3140.4825 | 0.0308 | 1.4 | 3.9 |
| 3140.5669 | 0.0603 | 1.4 | 5.7 |
| 3143.4979 | 0.0837 | 1.5 | 4.0 |
| 3143.5831 | 0.1134 | 1.5 | 2.2 |
| 3152.4905 | 0.2235 | 1.1 | 5.4 |
| 3152.5880 | 0.2575 | 1.1 | 3.1 |
| 3155.5687 | 0.2892 | 0.9 | 4.9 |
| 3156.5837 | 0.6526 | 1.0 | 3.0 |
| 3158.5267 | 0.3310 | 0.9 | 5.4 |
| 3161.5530 | 0.3877 | 1.5 | 3.3 |
| 3166.5406 | 0.1291 | 1.2 | 6.0 |
| 3167.4317 | 0.4403 | 1.9 | 6.2 |
| 3167.5478 | 0.4808 | 0.7 | 2.7 |
| 3168.4281 | 0.7882 | 1.3 | 3.3 |
| 3168.5833 | 0.8423 | 0.9 | 3.1 |
| 3170.5860 | 0.5416 | 0.7 | 3.7 |
| 3171.5641 | 0.8831 | 0.9 | 2.6 |
| 3183.4394 | 0.0294 | 0.9 | 2.2 |
| 3216.5501 | 0.5901 | 1.0 | 2.7 |
| S Equ | KO Aql | |||||||
| Parameter | Plavec (1966) | This study | Sahade (1945) | This study | ||||
| T0 (HJD) | 2437568.345 | 2452503.08611footnotemark: 1 | 2426585.442 | 2452501.70711footnotemark: 1 | ||||
| Porb (day) | 3.4360726 | 3.43612811footnotemark: 1 | 2.863844 | 2.86406811footnotemark: 1 | ||||
| 0.14 | 22footnotemark: 2 | 0.02 | 22footnotemark: 2 | |||||
| (km s-1) | 0.5 | 1.9 0.1 | ||||||
| K1 (km s-1) | 23.4 | 25.1 0.6 | 37.8 | 37.8 0.2 | ||||
| K2 (km s-1) | 192.1 1.2 | 175.1 0.9 | ||||||
| a1 sin i (106 km) | 1.06 | 1.19 0.03 | 1.5 | 1.49 0.01 | ||||
| a2 sin i (106 km) | 9.08 0.06 | 6.90 0.03 | ||||||
| M1 sin3 i (M☉) | 3.23 0.06 | 2.36 0.03 | ||||||
| M2 sin3 i (M☉) | 0.42 0.01 | 0.51 0.01 | ||||||
| q (=M2/M1) | 0.131 0.003 | 0.216 0.002 | ||||||
The ephemeris was adopted from Kreiner (2004).
22footnotemark: 2 was assumed.
4 Rotational Velocities
The synchronization time is shorter than the duration of the semi-detached phase for Algol-type binaries by two or three orders of magnitude. In this case, one should expect that the number of Algol systems with a non-synchronous rotation must be much smaller than that of synchronous systems (Glazunova 1999). However, the measured rotation rates of the primary components of Algol systems indicate that most of them are rotating faster than in the case of synchronization (Van Hamme & Wilson 1990). The mass transfer process from the secondary components to the primary ones can cause a strong increases in the rotational velocity of the mass-gaining components because the matter flowing through the L1 Lagrangian point also transfers angular momentum (see, e.g., Giuricin et al. 1984, De Greve at al. 2006, Van Resbergen et al. 2006).
Van Resbergen et al. (2006) have stated that a “conservative” evolution (without loss of mass and angular momentum) fails to explain the observed mass-ratios (–1) while models with some mass and angular momentum loss from these systems can better explain the observed mass-ratios. They have proposed a scenario in which the gainer is spun up by the incoming mass from the donor. The gainer spins up - sometimes up to the critical velocity - and spins also down due to tidal interaction. Even when the gainer has the critical velocity this kinetic energy is not sufficient to drive mass out of the system, as a consequence of the virial theorem. The extra-energy needed is given by the accretion luminosity which is created in a hot spot of the gainer’s surface. As a consequence, they found that, in massive Algol systems (with a donor starting with an initial mass ), the combined action of rapid rotation and accretion luminosity can overrun the binding energy of material on the gainer’s surface. The less-massive Algol systems (like, e.g., RZ Cas) are instead likely obtained through an evolution without loss of mass but with a considerable loss of angular momentum (e.g. due to magnetic braking).
Therefore, the of the accreting components represents observational evidence for mass transfer and accretion phenomena. Moreover, the values of are needed to produce correct synthetic spectra.
We measured the projected rotational velocity () of the “mass gainers” (i.e. hotter components) of S Equ and KO Aql by using the CCF analysis. For this purpose, we obtained a calibration relation between the full width at half maximum (FWHM) of the CCF peak and the with artificially broadened spectra of slowly-rotating B9-A0 stars (Vega, 21 Peg, and HR 6096) that were acquired in the same observing runs and with the same instrumental setup of S Equ and KO Aql observations. Then, the rotation velocities of the hotter components of the systems were determined by converting the FWHM of its CCF peaks into through the aforementioned calibration. We found, as weighted averages of all measurements, 4.4 km s-1 and 41.0 2.0 km s-1 for S Equ and KO Aql, respectively. The rotational velocity for S Equ is in agreement, within the errors, with the value of 1.4 km s-1 determined by Mukherjee et al. (1996).
We have also calculated the rotational velocities of both components of the systems in the hypothesis of synchronous rotation, finding km s-1 and 30 km s-1 for the hotter components of S Equ and KO Aql, respectively (see, Table 9). The measured values for the gainers indicate that they are spinning faster than the synchronous rate.
5 Synthetic Spectra and H Difference Profiles
The emission and absorption features produced by accretion around the hotter component in short-period Algol systems are generally weak relative to the continuum flux of the spectra. In order to emphasize the effect of mass transfer (and/or other physical processes such as magnetic activity in cool components) in H, it is necessary to remove the strong photospheric contribution of both components from the observed spectra. Hence, we have produced synthetic spectra for the hotter components built up with Kurucz (1979) model atmospheres. Standard stars’ spectra have been used for the cooler components. For this purpose, the low-activity stars 10 Tau (F9 IV-V) and Boo (K1.5 III) for S Equ and KO Aql, respectively, were observed in the same observing runs and with the same instrumental setup.
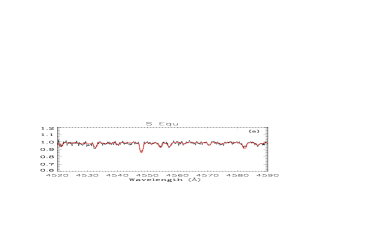
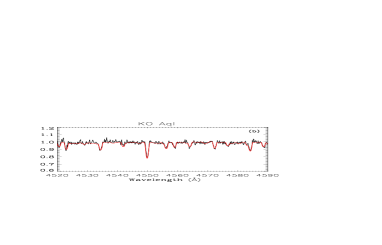
Before forming the difference profiles (observed - synthetic) for the H line, we have checked the physical parameters (Teff and ) of the hotter components reported in the literature. This task was accomplished by fitting Kurucz (1979) model atmosphere spectra to the observed ones in spectral regions where hot components overwhelm the secondary ones and mass transfer effects are not visible. We have chosen the blue region around 4500 Å and H. We have also taken into account the small contribution (from 3 to 7 %) of the cooler components at these wavelengths by adding observed spectra of cool standard stars properly weighted, broadened and Doppler-shifted. The temperature of the primary component of S Equ found using this method, K, is only slightly higher (300 K) than that given by Zola (1992). For KO Aql, we find the same temperature ( K) found by Mader & Angione (1996).
The stellar parameters resulting from these fits are listed in Table 6, which contains also other parameters used to create the synthetic spectra for S Equ and KO Aql. Some examples of observed and synthetic spectra are displayed in Fig. 3. Then, we have formed the composite synthetic spectra in the H region to be compared with the observed ones and to produce difference profiles. Effective temperatures and absolute radii (in Table 9) were used to calculate the contribution of primary and secondary components, whose spectra were also rotationally broadened and wavelength Doppler-shifted, before being summed. The synthetic profiles were then subtracted from the observed ones, and the resulting difference profiles were examined.
| Hot Component | Cool Component | ||||||
| System | T | log g | Standard | ||||
| (K) | (km s-1) | (km s-1) | |||||
| S Equ | 11500 | 4.1 | 52 | 10 Tau (F9 IV) | 48 | ||
| KO Aql | 9900 | 4.3 | 41 | Boo (K1.5 III) | 58 | ||
6 H Extra-Emission and Absorption
The H residual profiles of Algol systems generally display extra absorption and/or emission features commonly interpreted as the result of Roche-lobe overflow, accretion structures around the hotter components, and/or due to the chromospheric activity of the cooler components. In short-period systems the contribution of the active chromosphere of the rapidly-rotating cooler components can produce significant effects on the H line profile (Richards Albright 1999). The two Algol systems with relatively short periods and with late-type secondary components that we are studying present both effects, namely mass transfer and chromospheric activity.
6.1 S Equ
The H difference profiles of S Equ display extra absorption and emission that are variable with orbital phase. These spectral features originate from accretion structure around the primary, flowing gas in the region between the two stars and by the impact of the gas stream on the primary component (Richards Albright 1999, Vesper et al. 2001, Richards 2004). H emission closely associated with the late-type secondary component and attributed to chromospheric activity has been also detected by Richards (2001) in the H tomogram of S Equ.
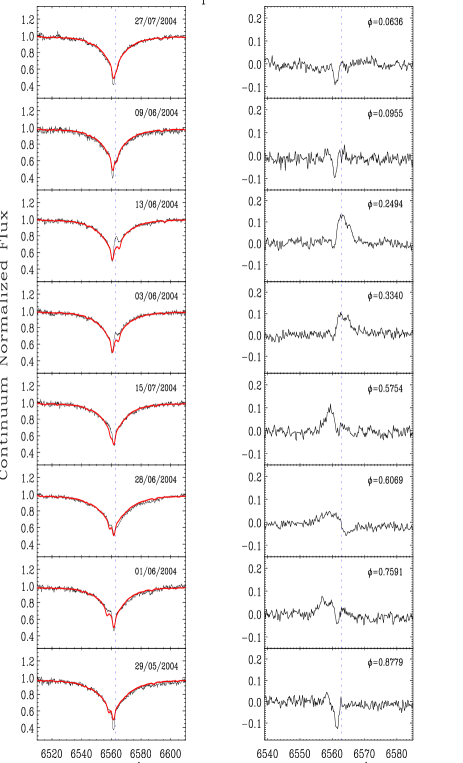
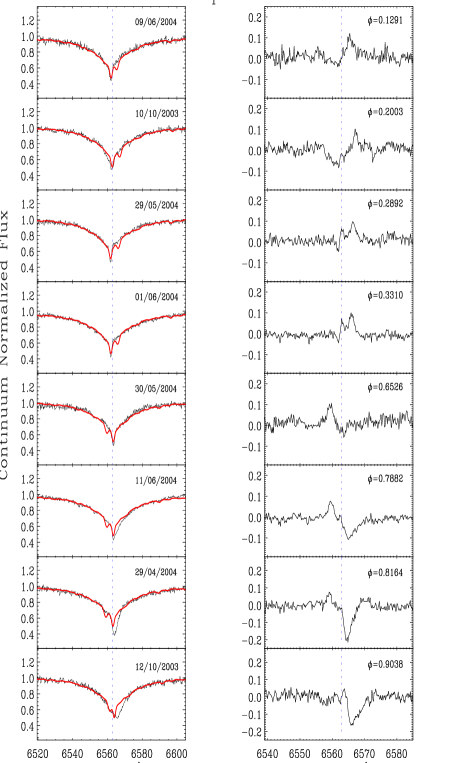
In this work, we have analyzed H difference profiles by selecting the spectra with higher S/N ratio. Examples of the observed, synthetic and difference H profiles of S Equ are shown in Fig. 4. Several features could be readily noted. Some extra emission is present at nearly all phases except near primary eclipse. These emission components with single or double peaks are more clearly visible around the quadratures and the stronger peaks, which are red shifted, can be seen near phase 0.25. Although the shape of the features at phase 0.75 is similar, the strength is slightly weaker. The extra-absorption is more prominent just before and after primary eclipse and it is still present at other phases though with a decreasing strength.
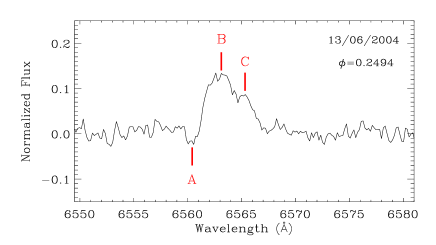
Considering all the residual profiles obtained at different orbital phases, a general structure, consisting of a weak absorption (A) and broad, single- or double-peak emission (B and C), is met (see Fig. 5).
With the aim of determining the sources of such features, we measured the equivalent widths (EWs) and radial velocities (RVs) for the absorption and emission components in the difference profiles by means of multiple Gaussian fits. These values are reported in Table 7. Moreover, in some spectra we have detected other features which seem to be unrelated to the ones already identified as A, B, and C, on the basis of their RV. These unidentified features are referred to simply as “absorption” or “emission” in Table 7.
The EW and RV values for the A, B, and C features are plotted versus orbital phase in Fig. 6 with asterisks, plus signs, and triangles, respectively. The RV curves of the primary and secondary stars are also over-plotted in the same figure with full and dotted lines, respectively. The sinusoidal fit of the RV variation of the B emission feature is displayed by a dashed line.
|
1 The features labeled as and have different RV variations from those listed as A, B and C.
Extra Absorption Feature (A). The visibility and velocity information, which can be deduced from EW and RV variations, provide constraints about the location of sources. H extra absorption is clearly visible just before and after primary eclipse (Fig. 4). It can be also easily followed in Fig. 5, which shows the EWs and RVs of the A-absorption feature. The EWs indicate that the absorption is absent at phases far from the primary eclipse. The RVs of this extra-absorption feature closely follow the RV curve of the hotter component suggesting that it may be connected with the mass-gainer component (Fig. 6a). This feature could be the result of circumstellar matter arising from the interaction between the gas stream and the environment around the hotter star. The EW variations also indicate that the matter should be denser around the impact point, where the gas stream interacts with the primary star, which is more visible around primary eclipse. The strong extra-absorption observed just before the primary minimum could also be the effect of the gas stream itself that is projected against the disk of the hotter component at these phases. However, the extra-absorption observed just after primary minimum and its RV variation make the impact region the more likely source of this feature. This would also explain the light deficit observed by Catalano & Rodonò (1968) near 0.9 phase.
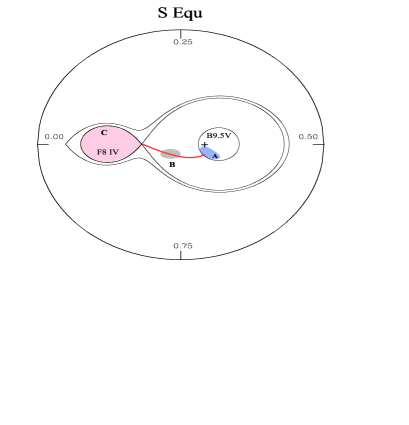
Extra Emission Feature (B). The EWs show that the emission profile (B) is not seen during the eclipses, while it is more prominent around the quadratures (see Figs. 4 and 6b). Therefore, it may be related to the circumstellar matter located in the space between the primary and secondary star, that is occulted at both eclipses (see Fig. 7). As shown in Fig. 6a, the RVs of the B emission feature follow the orbital motion of the cooler component without any significant phase shift but with a smaller amplitude. In the hypothesis that the emitting region is at rest in the rotating reference frame of the system, we can deduce that it lies between the center-of-mass of the system (CM) and the secondary star and we can also evaluate its location, analogously to what done for HR 7428 by Marino et al. (2001). The projected distance of the region from the CM can be found as , where is the semi-major axis of the cool star orbit and and are the mass ratio and system separation, respectively. Here, and are the semi-amplitudes of the RV variations for the cool star and for the emitting region, respectively. Using the orbital solution of S Equ given in Table 5 and the semi-amplitude of the RV variation of the B emission feature estimated as km s-1, we find that the emitting region should be located at about 3 km from the barycenter toward the cool component. Thus, feature B could be part of the gas stream (see Fig. 7).
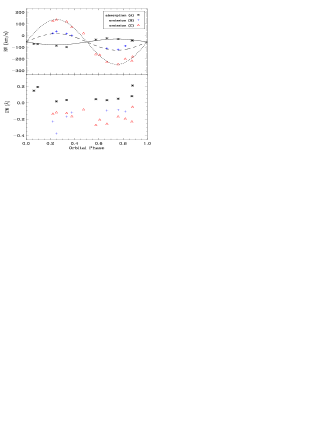
Extra Emission Feature (C). Although the emission profile (C) is visible at nearly the same orbital phases where the B-type emission is observed, its narrower width (Fig. 5) and its RV variation (Fig. 6a) clearly indicate that its origin is different. The velocity of the C feature follows the RV curve of the secondary companion. Therefore, the emission seems to be closely related to the cool component and it could be produced by its chromosphere.
A schematic representation of the S Equ system with the Roche-lobe geometry, the gas stream, and the extra-emission/absorption regions is shown in Fig. 7.
6.2 KO Aql
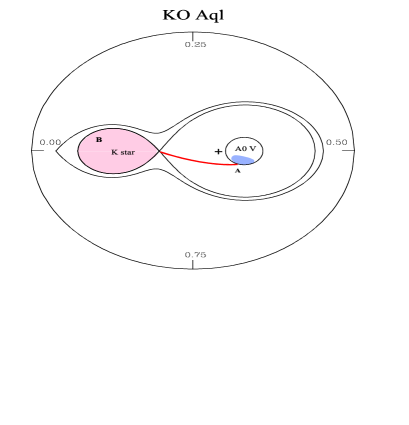
We have subtracted the synthetic spectrum from each KO Aql spectrum using the method described in the previous section in order to produce residual H profiles to be analyzed. A sample of H profiles is shown in Fig. 8. In the residual profiles is apparent an absorption feature (A), which is stronger around the primary eclipse, and an emission profile (B) clearly seen around the two quadratures. We have measured EWs and RVs of these features to get information about their origin, as we did for S Equ. These values are listed in Table 8 and are plotted against the orbital phase in Fig. 9. However, features with RV not consistent with A and B are visible in a few spectra. The EWs and RVs for these features are not plotted in Fig. 9, but their values are reported in Table 8 and simply labeled as or features.
Although the RV of the extra-absorption (A) seems to follow the RV curve of the mass-gainer (hotter) component at some phases (such as between 0.25 and 0.35), it displays a much larger amplitude of RV variation compared to the primary star, especially just before and after primary eclipse (see Fig. 9). The EWs indicate that the absorption feature becomes stronger from phase 0.7 to 0.9 and is visible until phase 0.2. The maximum value of equivalent width, EW 0.6 Å, is observed just before primary eclipse, at about 0.9 phase. This suggests that the absorption is likely produced by circumstellar matter around the primary component or to the gas stream itself that is projected onto the hotter star and would give rise to a red-shifted absorption at these phases, as it is observed. However, this cannot explain the blue-shifted absorption observed at about 0.1 phase. Anyway, the variability and the visibility of the absorption feature (A) indicate that the source of this extra-absorption may be connected with the stream-star impact region.
|
1 The features labeled as and have different RV variations from those listed as A, B and C.
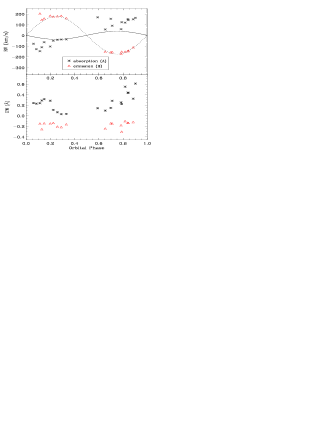
To estimate the location and the origin of the extra-emission feature (B), we examine the variation of its RVs and EWs in Fig. 9. The EWs have a value of about 0.2 Å and no relevant change with orbital phase. The RV of this emission feature closely follows that of the secondary star, indicating a possible chromospheric origin. Unlike S Equ, for KO Aql there is no clear evidence of a broad extra-emission feature attributable to the mass transfer phenomenon. A schematic representation of the KO Aql system with the Roche-lobe geometry, the gas stream, and the extra-emission/absorption regions is shown in Fig. 10.
7 Discussion
According to the catalogue compiled by Budding et al. (2004), the number of Algol-type binaries with RV curves for both components and solved orbits is very limited. Accurate values of stellar and orbital parameters for as many binaries as possible are strongly needed for the study of several phenomena such as mass transfer and accretion, magnetic activity on late-type components, and angular momentum evolution.
In this study, we have presented new radial velocity curves for the hotter primary components of S Equ and KO Aql with much better precision and phase coverage than previous works. Moreover, we have obtained the first RV curves for the late-type secondary components of both systems.
Thus, the first complete orbital solutions and mass determination have been made for both systems. From the photometric and spectroscopic elements given in Tables 1 and 5, respectively, we derived the absolute parameters of S Equ and KO Aql, which are listed in Table 9. The masses are determined to better than 2, and the radii with a 4 precision.
From the effective temperatures and radii we have calculated the luminosities of the components of both systems and their absolute bolometric magnitudes, adopting for the Sun =4.74 (Cox, 2000). The absolute magnitudes in the band, , were calculated from the bolometric magnitudes by applying the bolometric corrections appropriate for the temperatures of our stars (Flower 1996). The combined absolute magnitude (including both components) is for S Equ and for KO Aql. We have also calculated the combined color expected from the sources by means of the calibration versus provided by Flower (1996), finding for S Equ and for KO Aql.
From the absolute and apparent magnitudes we can easily derive the distance modulus, if we know the reddening to the sources.
For S Equ, we have used the outside-of-eclipse values , (ESA 1997), that lead to a color excess and an extinction , with (Savage & Mathis, 1979). A distance of 390 40 pc is found, in excellent agreement with the astrometric determination of 400 210 pc from the Hipparcos mission (ESA, 1997).
For KO Aql, with and (ESA 1997), we find and . The distance derived in the same way is 240 20 pc, in good agreement with the astrometric distance of 265 75 pc from the Hipparcos mission (ESA, 1997).
|
|||||||||||||||||||||||||||||||||||||||||||||||||||||||||||||||||||||||||||||||||||||||||||||||||||||||||||||||||||||||
aZola (1992), bMader & Angione (1996).
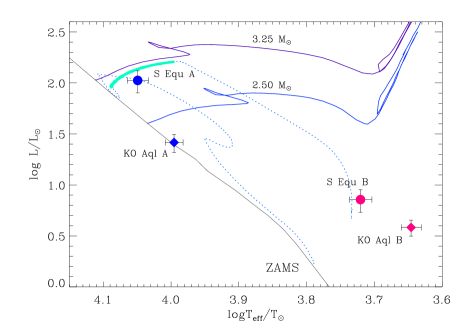
The positions of the primary and secondary components of S Equ and KO Aql on the Hertzsprung-Russel (HR) diagram are shown in Fig. 11, together with the theoretical evolutionary tracks for the more massive components, as computed by Girardi et al. (2000), and with the conservative evolutionary track for the mass-gainer star belonging to a system with a total mass of and an initial orbital period of 1.2 days calculated by De Loore & Van Rensbergen (2005)222http://we.vub.ac.be/astrofys/binarytracks/index.html.
İbanoǧlu et al. (2006) have pointed out that semi-detached systems (SDBs) display relevant differences compared to the detached binaries (DBs). The primary components, mass-gainers of SDBs, seem to be normal main-sequence stars. The cooler ones, the losers, are instead stars evolved off the main sequence which are all oversized and over-luminous for their masses. A relevant difference between the primary components of SDBs and DBs has been found by İbanoǧlu et al. (2006) who determined the mass-luminosity relation (MLR). They have taken into account 74 DBs and 61 SDBs with well-determined absolute parameters and derived for the primaries of SDBs a MLR relation L, while the luminosities of the primaries of DBs are correlated with their masses as M. These relations show that the hotter components of SDBs are under-luminous relative to the main-sequence stars of the same-mass.
This trend is also followed by the hotter components of S Equ and KO Aql which are clearly underluminous compared to normal main-sequence stars of the same mass (Fig. 11). This behaviour is not dependent on the theoretical tracks, because we find exactly the same results by adopting the evolutionary tracks of Pols et al. (1998), and so the trend could be due to the mass that is being acquired by these stars by Roche-lobe overflow from the donor.
Indeed, the evolutionary track of the mass-gaining component for an Algol system with (dotted line in Fig. 11) shows that, if the mass-transfer is still ongoing, the position of the hotter component can be significantly different from that of a normal main-sequence star with the same mass. Unfortunately, De Loore & Van Rensbergen (2005) did not calculate evolutionary tracks for systems with the same total mass as S Equ (3.66) and KO Aql (3.03), but this result indicates that the luminosity discrepancy could be explained by an evolutionary effect.
S Equ and KO Aql are members of the group of short-period Algols (Porb < 5–6 days), in which the mass transfer and accretion process are more complicated than in the long-period Algols (Porb > 5–6 days) because the gas stream from the donor to the gainer directly strikes the star. This stream-star interaction results in a variety of accretion features. Generally, an accretion structure in these systems, which is called an accretion annulus (Richards et al. 1996), can be produced. This structure is an asymmetric, sometimes clumpy distribution of gas around the primary component (Richards 2001). The observed properties of the mass transfer and circumstellar material in short-period Algols have been mostly found from spectroscopic studies, especially from variations of Balmer-line profiles. The identified regions include the gas stream (Richards et al. 1995), a transient accretion disk (Kaitchuck & Honeycutt 1982), and a denser region near the impact site called a localized region (Richards 1992, Richards et al. 2000).

The type of accretion structures can be predicted by using the ballistic calculations of Lubow & Shu (1975) and the diagram, a plot of radius of the mass gainer versus the mass ratio () of the system (Peters 1989). Two curves ( and ) can be drawn onto the diagram, where defines the fractional radius of the outer disk and represents the minimum distance between the stream and the center of the primary star.
We have constructed the diagram (Fig. 12) for all the SDBs from the list of İbanoǧlu et al. (2006), taking and from the catalog of Budding et al. (2004). The positions of the gainers of S Equ and KO Aql are marked with big dots. The short-period systems (Porb < 5–6 days) are located above the curve; the gas stream strikes the primary directly, resulting into an impact region and possibly a transient disk or annulus because the orbital separation of two components is too small to form a stable disk. Conversely, the systems falling under the curve are long-period ones with a small fractional radius and can form a classical accretion disk because the stream does not hit the primary. For the systems lying between the two curves, the accretion structure around the primary is very unstable and transient (Peters 1989, Richards & Albright 1999). S Equ and KO Aql belong to this group, thus they should contain transient, unstable disks or an accretions annulus around the gainers and show evidence of impact regions.
Indeed, our H difference profiles suggest accretion structures more closely connected to the gas stream or to the impact region of the stream on the outer atmosphere of the hot star rather than to disks. The extra-absorption observed in the S Equ spectra follows the motion of the hotter component and is close to the star-stream impact site, as already found by Richards (2004) who also found evidence of a circum-primary equatorial ‘bulge’ centered on the velocity of the primary star. The emission component (B) found by us displays instead a different behaviour, being likely located between the two stars and possibly connected to the gas stream itself or to the interaction between the stream and a transient disk. This seems to indicate a variability of the mass-transfer process in this system, in agreement with the observation of Algol systems that alternate between stream-like and disk-like states (Richards 2004). The chromospheric emission of the cool component of S Equ is also detected in our spectra, as already found by Richards (2001). We have detected similar features in the residual H spectra of KO Aql, with the exception of the excess B emission between the two components. In addition, the extra-absorption displays larger velocity variations compared to S Equ.
In Algol systems, the rotational velocity of the mass-gaining components is an indicator of mass transfer, which acts as a spin-up mechanism (Olson & Etzel 1994, Mukherjee et al. 1996). Thus, when one sees a primary component rotating faster than expected from tidally-induced synchronism, one can argue that mass transfer has been taking place. However, this is not a direct proof for an ongoing mass flow. By the cross-correlation of the spectra of S Equ and KO Aql with slowly-rotating templates, we have measured, with a rather good accuracy (2–4 km s-1), the rotational velocities of the hotter components of both systems and found that these components are rotating about 30% faster than the synchronized velocity which is likely the result of the accretion of gas with high angular momentum.
The mass transfer rates in Algols can be estimated assuming a conservative mass and angular momentum transfer, i.e. without losses from the system. In such hypothesis, a monotonic increase of the orbital period is expected. An increasing has been indeed found for S Equ (Soydugan et al. 2003) and KO Aql (Soydugan & Soydugan 2007). The analysis of the orbital period changes has allowed us to calculate the mass transfer rates for S Equ and for KO Aql. Considering that Algols are mostly in the slow phase of mass transfer with rates (Richards Albright 1999), the mass transfer rates for S Equ and KO Aql are among the highest occurring in these systems, thus explaining the strong H extra-absorption and/or emission features shown by these systems.
8 Conclusions
We have observed spectroscopically the classical Algol-type binaries S Equ and KO Aql with the aim of determining the physical parameters of the components and to study the mass transfer and accretion structures around the hotter components by analyzing H difference profiles.
Our detailed spectroscopic analysis has yielded the first precise determinations of the absolute parameters of the systems and, in particular, the stellar masses, thanks to the first radial velocity curves of the cooler secondary components. We found that the hotter, mass-gaining components of both systems are underluminous compared to normal main-sequence stars of the same mass. We show that this behaviour can be explained by the Roche-lobe overflow.
We have also found clear evidence for mass transfer, accretion structures, and chromospheric activity of late-type components in our spectra. In particular, we have detected in S Equ a broad H extra-emission component that is observed red-shifted at phases around 0.25 and blue-shifted at phases near 0.75. This feature is not observed during the eclipses and its RV variation is consistent with an accretion structure (mass flow or interaction between the stream and a transient disk) located between the two stars at about 3 km from the barycenter toward the cool component. Similar features were also observed by Vesper et al. (2001) in some short-period Algol binaries such as SS Cet, U CrB, Per, and S Equ itself. However, we did not observe a similar behaviour in KO Aql.
Our H spectra also display, for both S Equ and KO Aql, extra-absorption features which get stronger around phase 0 and whose radial velocities are consistent with those of the hotter components. They are very likely produced by the impact region between the stream and the primary. Analogous features were already observed in other short-period Algols such as Per (Richards 1993), SW Cyg (Hunt 1997) and RW Mon (Vesper & Honeycutt 1999).
In the difference profiles of both systems we have also detected emission lines which closely follow the radial velocity curves of the late type secondaries and, as such, they very likely arise from their chromospheres.
Acknowledgements. We are grateful to the referee, Dr. Mercedes Richards, for several helpful comments and a careful reading of the manuscript. F. Soydugan would like to thank all the staff of Catania Astrophysical Observatory for the kind hospitality, the allocation of telescope time, and the precious help during the observations. He is also grateful to the Scientific and Technical Research Council of Turkey (TÜBİTAK) for their financial support. We are grateful to Dr. Walter Van Rensbergen for very useful suggestions. This research has been partially supported by INAF (Istituto Nazionale di Astrofisica) and Italian MIUR (Ministero dell’Istruzione, Università e Ricerca). This research has made use of SIMBAD database.
References
- (1) Blanco C., Cristaldi S., 1974, PASP, 86, 187
- (2) Budding E., Erdem A., Çiçek C., Bulut İ., Soydugan F., Soydugan E., Bakış V., Demircan O., 2004, A&A, 417, 263
- Catalano & Rodonò (1968) Catalano S., Rodonò M., 1968, Mem. Soc. Astron. Ital., 39, 617
- Cox (2000) Cox, A. N., 2000, Allen’s Astrophysical Quantities, Springer-Verlag
- de Greeve et al. (2006) De Greve J.-P., De Loore C., Van Rensbergen W., 2006, Binary Stars as Critical Tools and Tests in Contemporary Astrophysics, IAU Symp. 240, 530
- De Loore & Van Rensbergen (2005) De Loore C., Van Rensbergen W., 2005, Ap&SS, 296, 353
- (7) ESA, 1997, Hipparcos and Taycho Catalogues, ESA SP-1200, Noordwijk: ESA
- (8) Flower P.J., 1996, ApJ, 469, 335
- (9) Frasca A., Freire Ferrero R., Marilli E., Catalano S., 2000, A&A, 364, 179
- Girardi et al. (2000) Girardi L., Bressan A., Bertelli G., Chiosi C., 2000, A&AS, 141, 371
- (11) Giuricin G., Mardirossian F., Mezzetti M., 1984, A&A, 131, 152
- (12) Glazunova L.V., 1999, AstL, 25, 467
- (13) Griffin R. E. M., 1999, in J. B. Hearnshaw, C. D. Scarfe, eds, Precise Stellar Radial Velocities, ASP Conf. Ser. 185, IAU Coll. 170, p. 52
- (14) Hill G., 1993, in Leung J.C. and Nha I.-S., eds., New Frontiers in Binary Star Research, ASP Conf. Ser. Vol.38, p.127
- (15) Hoffmeister C., 1930, AN, 240, 193
- (16) Holmgren D. E., 1988, Ph.D. thesis, University of Victoria
- (17) Hunt T. D., 1997, Ph.D. thesis, University of Indiana
- (18) İbanoǧlu C., Soydugan F., Soydugan E., Dervişoǧlu A., 2006, MNRAS, 373, 435
- (19) Kaitchuck R. H., Honeycutt R. K., 1982, ApJ, 258, 224
- (20) Khalesseh B., Hill G., 1992, A&A, 257, 199
- (21) Kreiner, J. M., 2004, AcA, 54, 207
- (22) Kurucz R. L., 1979, ApJS, 40, 1
- Lazaro et al. (2004) Lázaro C., Martínez-Pais I.G., Arévalo M. J., 2004, MNRAS, 351, 707
- (24) Lubow S. H., Shu F. H., 1975, ApJ, 198, 383
- (25) Lucy L. B., Sweeney M. A., 1971, AJ, 76, 544
- (26) Mader J. A., Angione R. J., 1996, PASP, 108, 404
- (27) Marino G., Catalano S., Frasca A., Marilli E., 2001, A&A, 375, 100
- Mayor & Queloz (1995) Mayor M., Queloz D., 1995, Nature, 378, 355
- (29) Maxted P. F. L., Hilditch R. W., 1995, A&A, 301, 149
- (30) Mukherjee J., Peters G. J., Wilson R. E., 1996, MNRAS, 283, 613
- (31) Olson E. C., Etzel P. B., 1994, in Shafter A.W., ed, Interacting Binary Stars, ASP Conf. Ser., Vol.56, p. 13
- (32) Peters G. J., 1989, Space Sci. Rev., 50, 9
- Piotrowski et al. (1974) Piotrowski S. L., Rucinski S. M., Semeniuk I., 1974, AcA, 24, 389
- (34) Plaut L., 1932, AN, 244, 289
- (35) Plavec M. J., 1966, BAICz, 17, 295
- (36) Plavec M. J., Polidan R. S., 1976, in Eggleton P., Mitton S., and J. Whelan, eds., Structure and Evolution of Close Binary Systems, IAU Symp. 73, Dordrecht: Reidel, p. 289
- (37) Pols O. R., Schroder K. P., Hurley J. R., Tout C. A., Eggleton P. P., 1998, MNRAS, 298, 525
- (38) Prendergast, K. H., Taam, R. E., 1974, ApJ, 189, 125
- Popper & Jeong (1994) Popper D.M., Jeong Y.-C., 1994, PASP, 106, 189
- (40) Richards M.T., 1992, ApJ, 387, 329
- (41) Richards M.T., 1993, ApJSS, 86, 255
- (42) Richards M.T., 2001, in Boffin H.M.J., Steeghs D., and Cuypers J., eds., Astrotomography, Indirect Imaging Methods in Observational Astronomy, Lecture Notes in Physics, vol. 573, p. 276
- (43) Richards M.T., 2004, AN, 325, 229
- (44) Richards M. T., Albright G. E., 1993, ApJS, 88, 199
- (45) Richards M. T., Albright G. E., 1999, ApJS, 123, 537
- (46) Richards M. T., Albright G. E., Bowles L. M., 1995, ApJ, 438, L103
- (47) Richards M. T., Jones R. D., Swain M. A., 1996, ApJ, 493, 326
- (48) Richards M. T., Koubský P., Šimon V., Peters G. J., Hirata R., Skoda P., Masuda S., 2000, ApJ, 531, 1003
- (49) Sahade J., 1945, ApJ, 102, 470
- (50) Samus N. N., Durlevich O. V., 2004, Combined General Catalogue of Variable Stars
- Savage & Mathis (1979) Savage B. D., Mathis J. S., 1979, ARA&A, 17, 73
- (52) Soydugan F., Soydugan E., 2007, in O. Demircan, S.O. Selam and B. Albayrak, eds., Solar and Stellar Physics Through Eclipse, ASP Conference Series, in press.
- (53) Soydugan F., Demircan O., Soydugan E., İbanoǧlu C., 2003, AJ, 126, 393
- (54) Tonry J., Davis M., 1979, AJ, 84, 1511
- (55) Topping J., 1972, Errors of Observation and Their Treatment (Chapman and Hall Ltd.), 89
- (56) Van Hamme W., Wilson R.E., 1990, AJ, 100, 1981
- Van Resnbergen et al. (2006) Van Rensbergen W., De Loore C., Jansen K., 2006, A&A, 446, 1071
- Vesper & Honeycutt (1999) Vesper D.N., Honeycutt K., 1999, AJ, 118, 2378
- (59) Vesper D., Honeycutt K., Hunt T., 2001, AJ, 121, 2723
- (60) Zola S., 1992, AcA, 42, 93