The massive expanding molecular torus in the planetary nebula NGC 6302
Abstract
Aims. We measure the mass and kinematics of the massive molecular torus in the planetary nebula NGC 6302. The nebula is the proto-typical butterfly nebula. The origin of the wing-like morphology is disputed: determining the mass-loss history of the confining torus is an important step in understanding the formation of this structure.
Methods. We performed submillimeter observations with JCMT and the SMA interferometer. The continuum emission as well as the J=2–1 and 3–2 transitions of 12CO and 13CO are analysed at arcsecond resolution.
Results. The CO emission indicates a mass of the torus of MM⊙. The 12CO and 13CO emission matches the dark lane seen in absorption in the H image of the object. The CO torus is expanding with a velocity of km s-1, centred at . The size and expansion velocity of the torus indicates that the torus was ejected from yr to yr ago, with a mass-loss rate of . We also see a ballistic component in the CO images with a velocity gradient of 140 km s-1 pc-1.
Conclusions. The derived mass-loss history of the torus favours binary interaction as the cause of the ejection of the torus. We predict the existence of a companion with an orbital period month.
Key Words.:
Stars: AGB and post-AGB; planetary nebulae: general; planetary nebulae: individual: NGC63021 Introduction
Asymptotic Giant Branch (AGB) stars lose between 50% and 80% of their stellar mass at mass-loss rates up to . About 80% of planetary nebulae (NP), i.e. the visible part of the ionized gas ejected by AGB stars, show elliptical and/or bipolar morphologies (e.g. Manchado 1997). Bipolar PN are believed to form when a fast wind from the now post-AGB star ploughs into the earlier slow AGB wind, amplifying an initial equatorial density enhancement (Kwok et al. 1978, Balick et al. 1987; Frank & Mellema 1994, Zijlstra et al. 2001). Some 15% of PNe show strong morphological evidence for such an equatorial enhancement of cold gas around the central star (Corradi & Schwarz 1995). Detailed studies of these equatorial structures can then give direct insights on the formation of bipolar PNe. Related to bipolar nebulae, butterfly PNe do not show well collimated outflows, but have thicker expanding equatorial torii. The complex morphology of their outflows has been attributed to an interaction between the fast wind and a warped disk (Icke 2003).
NGC 6302 is the proto-typical ‘butterfly’ nebula. It is located at a distance kpc (Meaburn et al., 2005). A broad central absorption lane at its centre is suggestive of a massive circumstellar torus. The nebula is driven by one of the highest temperature PN central stars known (Casassus et al. 2000), although due to the high extinction of the absorption lane, it has not been directly detected. Previous CO observations suggest a mass for the torus of M⊙ (Gomez et al. 1989; Huggins & Healy 1989). However, recently Matsuura et al. (2005a) measured a total gas mass of M⊙ from observations of the submillimetre dust continuum emission. This extremely high mass, especially when compared to the M⊙ estimated for the central star (Casassus et al. 2000), prompted us to reexamine the CO emission from this source and study of the kinematics of the circumstellar gas.
2 Observations
2.1 JCMT observations
NGC 6302 was observed with the James Clark Maxwell Telescope (JCMT)111The James Clerk Maxwell Telescope is operated by The Joint Astronomy Centre on behalf of the Particle Physics and Astronomy Research Council of the United Kingdom, the Netherlands Organisation for Scientific Research, and the National Research Council of Canada. in Hawaii as observing program S04AU08 on 26 May, 18 and 19 June 2004 using the facility 230 GHz and 345 GHz receivers. We observed 12CO J and J, as well as the corresponding transitions of 13CO. The data were taken with a velocity resolution of km s-1 for all the transitions, but was rebinned to 0.4 km s-1 for analysis.
We raster-mapped the region around NGC 6302 in the J and J transitions of 12CO. Extended emission components were seen at some velocities, but the main emission component corresponding to NGC 6302 was found to be unresolved at 230 GHz and only slightly resolved at 345 GHz. We subsequently took 13CO spectra pointing towards the 12CO J emission peak position, taken to be , (J2000).
All observations were made by position-switching to an off position (0′′,+300′′) from this central position. This off position was carefully checked from emission which may have contaminated the source observations, but no emission with a peak temperature of greater than 0.2 K (with a line width of 1 km/s or more) was found at the frequency of either the J or J transitions. The telescope pointing was regularly checked during the observations and was found to be constant to within ′′. A linear baseline has been removed from each of the spectra. The main beam efficiency of the JCMT is 0.69 and 0.63 at the frequency of the J and J respectively. The observational parameters are summarised in Table 1.
| Transition | Frequency | Telescope | Resolution | Beam |
|---|---|---|---|---|
| (GHz) | (km s-1) | (arcsec) | ||
| 12CO J | 220.398 | JCMT | 0.4 | 20 |
| SMA | 0.3 | |||
| 13CO J | 230.538 | JCMT | 0.4 | 20 |
| SMA | 4.4 | |||
| 12CO J | 345.796 | JCMT | 0.5 | 13 |
| 13CO J | 330.587 | JCMT | 0.5 | 13 |
2.2 SMA observations
NGC 6302 was observed at a wavelength of 1.3 mm with the SMA222The Submillimeter Array is a joint project between the Smithsonian Astrophysical Observatory and the Academia Sinica Institute of Astronomy and Astrophysics, and is funded by the Smithsonian Institution and the Academia Sinica. on 26 June 2005. We used all 8 antennas in the compact configuration, with a maximum of baseline of 70 m. The six shortest baselines range in length from 16.5 to 32 m. The phase center was RA(2000)=17hh13m44.2s Dec(2000)=-37∘06′15.9′′. The central frequency of the upper side band was set to 230.538 GHz with a total bandwidth of GHz (i.e. covering the frequency range to GHz). The lower side band was centered at GHz (i.e. covering to GHz). The correlator was configured to provide a velocity resolution of km s-1 for the CO J line and km s-1 for the 13CO J line. Weather conditions were good for 230 GHz observations with a relative humidity of 20%, atmospheric opacity at zenith and K.
The phase and amplitude were calibrated by observing SgrA∗ for 5 minutes around every 20 minutes of integration on NGC 6302. The angular separation between SgrA∗ and NGC 6302 is . The passband calibration was done using Callisto, 3C279 and 3C454.3. The flux calibration was performed using Callisto assuming a brightness temperature of 120 K at 229.45 GHz. The absolute astrometric positional accuracy in the observations is found to be better than 0.3′′based on observations of the quasars 1911201 and 1924292.
The visibility data were reduced using the SMA version of the Miriad software package. Applying natural weighting, the final maps have a synthesized beam of 6.2′′3.2′′with P.A.=6.9∘. The rms noise in the continuum image obtained by averaging the LSB and USB data is mJy. The rms noise in the CO channel maps, at 1 km s-1 resolution, is mJy.
3 Continuum emission
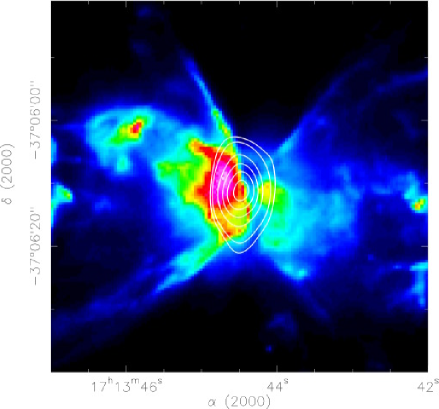
The SMA 1.3 mm continuum map is shown in Fig. 1. To avoid molecular line contamination of our continuum data, the CO emission, on which the the correlator bandwidth was centred, has been removed. This continuum map reveals a single source elongated in the North-South direction. The angular resolution provided by the SMA spatially resolves the structure. The position, size and flux are given in Table 2, together with the integrated flux measured inside the 5 contour ( mJy/beam).
The 1.3 mm continuum flux contains contributions from dust emission and thermal free–free emission. The free-free contribution is % of the total flux (see Fig. 13 of Matsuura et al. 2005a), leaving Jy from the dust continuum emission. Assuming a mean dust temperature ranging from 30 K to 120 K (Kemper et al. 2002), a dust to H2 mass ratio of 1, a typical dust opacity for protostellar disks of 2 cm2 g-1 (Beckwith et al. 1990), and a distance kpc (Meaburn et al., 2005), we infer a total (dust plus gas) mass ranging from 0.8 M⊙ to 3.9 M⊙. However, the temperature range given by Kemper et al. (2002) corresponds to two different components, a cold one with T 30 to 60 K, and a hot one with T 100 to 120 K. As discussed later (see Sect. 5.3), the bulk of the mass comes from the cold component, meaning that 0.8 M⊙ is rather a lower limit to the mass. Taking 60 K as the average temperature, we find a mass of 1.8 M⊙. Uncertainties due to temperature and dust opacity are at least a factor of 2 in each way. Comparing this mass estimate to the one from Matsuura et al. (2005a) obtained from single dish observations, we conclude that there is almost no missing dust continuum flux in our SMA data, as confirmed later in Sec. 5.1 through our molecular line data set. Because the SMA is not sensitive to extended emission larger than approximately 20′′ the lack of missing flux confirms then the compact nature of the NGC 6302 torus.
The peak of the millimetre map is slightly offset, i.e. ′′, from the centre of the dark lane. Two effects explain this offset. First, the contribution from the free-free emission seen at 6 cm (Matsuura et al. 2005a) shifts the 1.3 mm peak toward the location of the free-free emission peak. Second, the dust absorption is tracing only the foreground part of the dusty torus, whilst the 1.3 mm emission traces it entirely. A slight tilt of the torus results in the 1.3 mm emission appearing offset from the absorption.
| Tracer | Coordinates | Speak | Sint | FWHM |
|---|---|---|---|---|
| (J2000) | (Jy/beam) | (Jy) | (arcsec) | |
| Cont. 1.3mm | 17:13:44.45 37:06:11.1 | 0.62 | 1.26 | |
| CO J | 17:13:44.47 37:06:08.0 |
4 Line data
4.1 Averaged spectrum
The JCMT data show a compact CO structure approximately coincident with the continuum emission, which traces the molecular content. The CO spectra for all four transitions, at the central position, are shown in Fig. 2. The spectra show several broad components, with emission ranging between and , using local standard of rest (LSR) velocities. In addition, several narrow components are seen in 12CO only, and are better seen in J than in J. These components are at , and . The relative strengths of these features suggest they trace gas which has a high 12CO/13CO ratio, and may be spatially extended.
The SMA has both higher resolution, and as an interferometer it is not sensitive to very extended emission. This allows us to identify interstellar emission components, which will be absent from the SMA maps. The averaged 12CO J obtained with the SMA is shown in Fig. 3 333We have applied a conversation factor of 0.8 K/Jy, which takes into account the frequency and the size of the beam, to convert the SMA line observations to a main beam temperature scale.. Two of the narrow components are absent, but the one at is seen, suggesting this gas is associated with the molecular torus. Its weakness at J in the JCMT data can be attributed to an off-centre position combined with the smaller beam at this frequency. The narrow components at and , non observed on our SMA data, may be unrelated interstellar gas, or possibly associated with the extended (8 arcmin) emission of the planetary nebula.
Based especially on the averaged spectrum, we define three broad velocity components, at km s-1, km s-1 and a feature/wing at to km s-1. These features are present in all four spectra, but are best defined at 12CO J. The same three components are also seen in the CO J of Gomez et al. (1989). The low velocity feature is much stronger in the SMA integrated spectrum than in the J JCMT spectrum, indicating it is located off-centre. It is absent from the J JCMT spectrum.


4.2 SMA 12CO J and 13CO J maps
The SMA channel maps allow us to define the precise velocity ranges for each of the three broad components. These range from km s-1 to km s-1 for the low velocity component, from km s-1 to km s-1 for the medium velocity component, and from km s-1 to km s-1 for the high velocity component. The relative intensity of these components varies from position to position, resulting from a complex velocity structure in the source.
The 13CO J transition is optically thinner, and then is a better tracer of the mass distribution and kinematics than the 12CO J. In the following we then discuss further the 13CO J emission. Figure 4 displays the full integrated 12CO J (colour scale) and 13CO J (contours) emission observed with the SMA. We can see that the 13CO J emission is more structured and elongated than the 12CO J one. Comparing with the continuum emission, we see that the line emission is more extended, and peaks three arcseconds to the North of the continuum peak (see Table 2). The lower contour levels also show extensions to the South and East which are not as strong in the continuum. Part of the difference may be caused by the free-free contribution to the continuum.
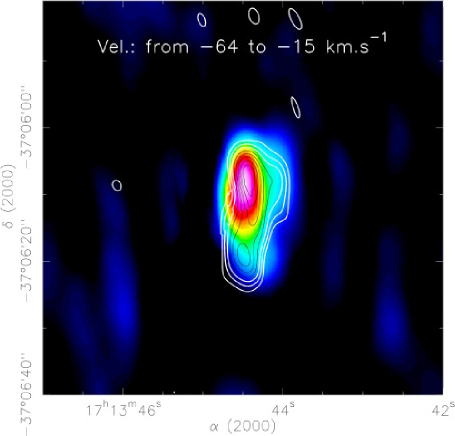
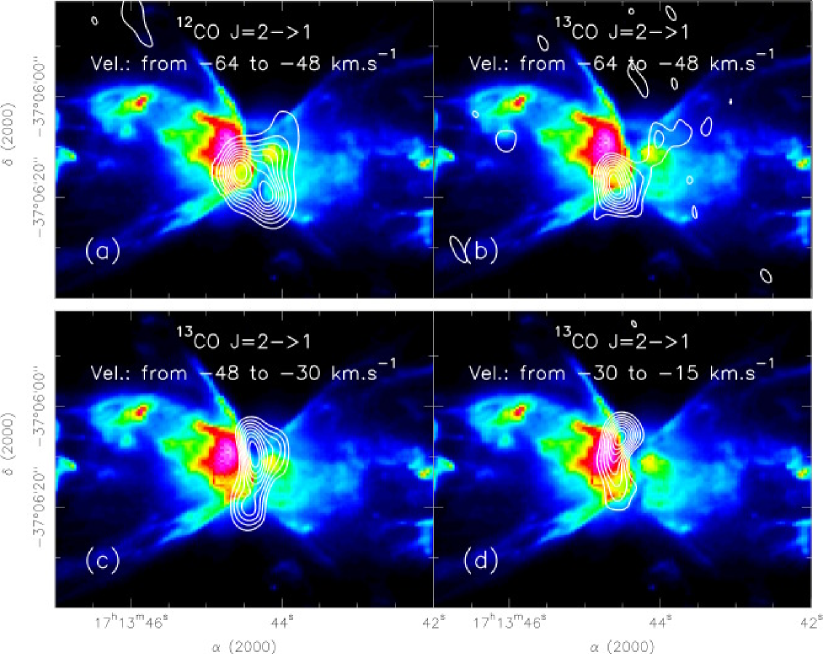
Fig. 5 shows the low velocity interval of the 12CO J (a) and 13CO J (b), as well as the medium and high intervals of the 13CO J line (b and d). The low velocity component (Fig. 5a and b) differs significantly from one line to another. The 13CO shows only one clear component, which is offset to the South-East compared to the brighter (and closest) 12CO component. The missing emission peak in the 13CO is likely too weak to have been detected in these observations which have a one noise level of K km s-1. Its weakness indicates a lower opacity for this clump, which is not apparent in 12CO J where both clumps are optically thick. The cause for the position shift is less clear, but it may indicate a difference between the location of the temperature peak, traced by the optically thick 12CO peak, and the column density peak, traced by the optically thin 13CO peak.
The medium velocity component (Fig. 5c) matches the dark lane seen in the H map better than the 12CO, and leaves little doubt about its association with the dark lane. We note also a slightly curved shape of this component. The high velocity component (Fig. 5d) is more extended than its 12CO counterpart, and is curved in the opposite direction to the medium velocity component. The lack of evidence for dust extinction associated with this strong CO component suggests it is located behind the H emitting material. The medium and high velocity peaks are situated on either side of the continuum peak, but shifted North by a few arcseconds. The location and velocity of these two components suggests they belong to an expanding, toroidal structure, but the northward shift suggests the torus may be weaker or incomplete towards the South.
In the next section we will discuss the mass of this torus based on CO observations
5 Mass determination
| Source Name | Velcocity range | ||||
|---|---|---|---|---|---|
| (km s-1) | (K km s-1) | (K km s-1) | (K km s-1) | (K km s-1) | |
| low vel. comp. | -64 to -48 | 20.0 (2.4) | 12.5 (1.4) | 1.8 (0.3) | 2.6 (0.2) |
| medium vel. comp. | -48 to -30 | 56.1 (2.6) | 27.3 (1.5) | 17.4 (0.3) | 8.7 (0.2) |
| high vel. comp. | -30 to -15 | 40.7 (2.4) | 15.4 (1.4) | 6.2 (0.3) | 3.0 (0.2) |
In order to determine the total molecular mass of the torus we estimate the excitation temperature and opacity of the CO lines using two methods. These both rely on a good knowledge of the observed 12CO and 13CO line ratios.
Since our JCMT 12CO observations only barely resolve the torus, even in the J transition, we assume that the central JCMT spectra contains all the emission from the torus and so we can use these spectra alone to determine the total molecular mass. However, note that this is not true for the low velocity component which is not part of the torus, as this component peaks at 7′′ South-East.
Table 3 gives the JCMT main beam integrated intensities of the four transitions, 12CO J, 12CO J, 13CO J, and 13CO J, integrated over the three velocity components identified in our SMA data. As noted above the CO J intensity is likely underestimated for the low velocity component. The JCMT beam filling factors can be calculated quite accurately for each velocity component using the source size measured in our SMA observations. These beam filling factors are listed in Table 4 assuming that the size of the source is the same for both CO species and both transitions. The filling factor corrected line ratios are given in Table 5. Also, the comparison of the JCMT and SMA 12CO J integrated flux shows that the SMA observations recover of the JCMT flux, demonstrating once again the compact nature of NGC 6302.
| Source Name | BFF CO J | BFF CO J |
|---|---|---|
| low vel. comp. | 0.62 | 0.93 |
| medium vel. comp. | 0.43 | 0.64 |
| high vel. comp. | 0.31 | 0.57 |
| Source Name | / | / | / | / |
|---|---|---|---|---|
| low vel. comp. | 1.07 (0.25) | 0.46 (0.11) | 11.11 (3.18) | 4.81 (0.91) |
| medium vel. comp. | 1.38 (0.14) | 1.34 (0.05) | 3.22 (0.21) | 3.14 (0.24) |
| high vel. comp. | 1.35 (0.22) | 1.12 (0.13) | 6.56 (0.70) | 5.13 (0.81) |
5.1 Analytical estimates of the kinetic temperature and opacity
The ratio of two different transitions of the same molecule constrains the excitation temperature, as given by Eq.(3) of Levreault (1988), assuming that the beam filling factors and the opacities of the transitions are known. For simplicity, we assume that the excitation temperature is uniform along the line-of-sight and that the transitions are thermalized, which allows us to infer the opacity of one transition given the opacity of the other one.
For the NGC 6302 case, we know that the 13CO lines are not optically thick (i.e. ). So assuming an opacity of 0.5 for the 13CO J line we find a kinetic temperature of K for the high velocity component and K for the medium velocity component. For the low velocity component we find K, but because of the missed flux in the 13CO J spectrum (Sec. 5) we consider this value underestimated by a factor of and believe that kinetic temperature of K is more realistic for this component.
With this range of kinetic temperatures inferred from the 13CO ratio, it
is then possible to infer the opacity of the 12CO lines. We find a
maximum opacity for the 12CO J transition of unity for every
velocity component, taking into account the
uncertainties on the observed ratio.
The opacity and kinetic temperature can also be inferred from the line ratio of two isotopic substituted molecules for the same transition. This method does not require the knowledge of the beam filling factor, if the filling factor is the same for both species, but it does require knowledge of the relative abundance of the species used. Assuming that the beam filling factor is the same for both transitions, that the excitation temperature is the same for both transitions, and also that the linewidth is the same in both transitions, the ratio of the integrated intensities is given by Eq.(3) of Myers et al. (1983).
Although the terrestrial value of , the abundance ratio /, is , for PNe (Balser et al. 2002), and 15 is a lower limit for NGC 6302 (Sec. 5.2). For the observed 12CO(2-1)/13CO(2-1) ratios lead to a 12CO J line opacity of 3 for the high and low velocity components and 5.5 for the medium velocity component, with a typical uncertainty of . The corresponding opacities for the 12CO J transitions are then and for the high and medium velocity components, respectively. The opacity inferred for the low velocity component is , well below the one inferred from the J transitions. This is likely due to the issue with the 13CO J already mentioned in the previous section. The corresponding opacities in the 13CO transitions are thus 15 times smaller, that is for the low velocity component, 0.2 for the high velocity component, and for the medium velocity component, with a typical uncertainty of . For an abundance ratio rather than 15, the opacities are approximately doubled.
The 12CO opacities inferred through this method are 3 to 15 times higher than the ones inferred using two transistions of the same species. Such differences in the opacity estimates lead to a similar dispersion in the mass estimates and indicate the need for a more complete model.
5.2 A two phase model: A hot inner edge and a cold outer part
The most likely explanation for the discrepancy between the two analytical methods discussed above is the presence of opacity and temperature gradients within the beam (Levreault 1988). Given the presence of a luminous, hot stellar remnant in the centre of NGC 6302, such gradients would not be unexpected.
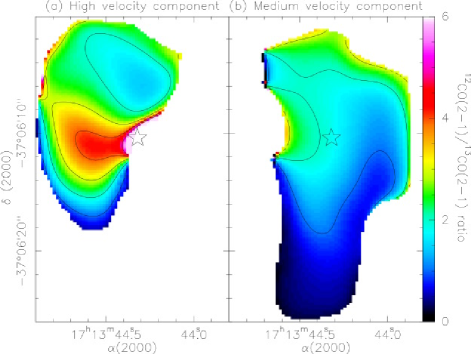
Figure 6 shows maps of the ratio 12CO(2-1)/13CO(2-1) for the medium and high velocity components. For both components this ratio is far from uniform over the structure. The high velocity component shows higher values of this ratio than does the medium velocity component; the peak is located in the central part, close to the proposed location of the central star (Matsuura et al. 2005a). Direct or indirect energy input by the central star appears to be responsible for a temperature gradient within the molecular structure, making the gas hotter in the inner part and colder in the outer part.
Figure 6 suggests an inner, marginally optically thin, warm component, seen directly through the high velocity component, and an outer, optically thicker, cold part, obscuring the warm component associated with the medium velocity component. This is consistent with the interpretation above that the high velocity component is located behind the star, while the medium velocity component is in front of star (Sec. 4.2).
The highest value of the 12CO(2-1)/13CO(2-1) ratio, found for the low velocity component, gives a lower limit to the abundance ratio of 15.
To account for the observed non-uniform physical conditions we have modelled the CO emission assuming it arises from two phases with different temperatures. Using the 1D radiative transfer code RADEX (Schöier et al. 2005) we have constructed a grid of models varying the kinetic temperature and the column density of the CO. The volume density, the linewidth and the background temperature were fixed to cm-3, 10 km s-1 and 2.73 K, respectively. We used two different values, 15 and 30, for the abundance ratio between 12CO and 13CO. Four grids of models were constructed, one for each transition, 12CO J, 12CO J, 13CO J, and 13CO J. Each individual model within these grids gives the resulting radiation temperature for a medium with a different column density and kinetic temperature. The 12CO column density was varied from cm-2 to cm-2 in steps of cm-2, and the kinetic temperature was varied from 10 K to 300 K in steps of 5 K. In order to simulate a two-phase medium we mixed each point on each grid with every other point, adopting a contribution of each phase to the observed spectra ranging from 10 to 90 in steps of 10.
This procedure generated almost different two component models. We then built for each model, the four line ratios, i.e. 12CO(3-2)/12CO(2-1), 13CO(3-2)/13CO(2-1), 12CO(3-2)/13CO(3-2), and 12CO(2-1)/13CO(2-1). A analysis on these grids yields the models which best fit the observed ratios for each of the three velocity components.
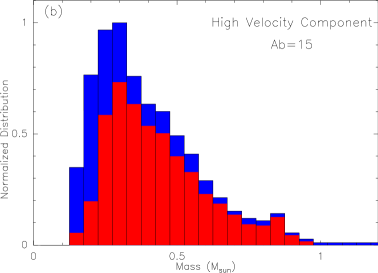
Figure 7 shows the results of the radiative transfer modelling for high velocity component. These plots only shows the model ratios fall within the uncertainties of the observed ratios (Table 5), for the preferred abundance ratio of 15. We can clearly see on Fig 7a that two different phases are needed to reproduce the observed ratios, one cold phase, with a kinetic temperature K and a warmer phase, with a kinetic temperature ranging from 80 K to 300 K, depending on the model.
Figure 7b shows the mass distribution of these models. For each mass bin we show in red and blue the relative percentage of hot and cold material, respectively. Here, hot means a kinetic temperature of K and cold means K. The most likely mass for the high velocity component is M⊙ and this mass is largely dominated by hot molecular gas. This is consistent with the fact that the high velocity component exhibits the hot inner part of the torus.
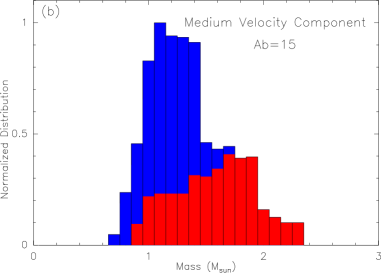
Figure 8 shows the same plots for the medium velocity component. We see that the temperature distribution is quite similar to that of the high velocity component, but the mass distribution is very different. The most likely mass for the medium velocity component is M⊙ and this mass is this time largely dominated by cold material. This is consistent with our picture of NGC 6302 since the medium velocity component shows the cold outer part of the torus. Using an abundance of 30 increases the best fit masses by roughly a factor of 2, but we did not find any model for the medium velocity component fitting within the uncertainties of the four line ratios, suggesting 15 is a better choice value for the abundance ratio.
The derived mass of the medium velocity component is almost four times higher than the mass of the high velocity component. This can be explained by the optical depth effects: the bulk of the cold phase of the high velocity component is hidden by the hot optically thick material in front of it, and thus, does not appear in our mass estimate of the high velocity component. However this cold component actually dominates the total mass of the toroidal structure. This discrepancy shows the limits of our simple two phase model. Although the total mass of the molecular content resulting from our models is 1.4 M⊙, geometrical symmetry suggests that the actual mass is closer to 2 M⊙, with an estimated uncertainty of 1 M⊙ given the mass distribution of the fit models (Fig. 7b and 8b). This value is in very good agreement with the mass estimate from the dust continuum emission (see Sect. 3).
We tried to estimate the mass of the low velocity component in the same way, but excluding the somewhat unreliable 13CO J data for this component did not allow us to identify a clear mass limit. For this component we have estimated a lower limit on the mass by assuming a temperature T K, LTE, and using the opacity of the 13CO J line, (obtained in a same way as for the 12CO J opacity; cf Sect. 5.1). Combining equations (9) and (19) from Goldsmith & Langer (1999), and using the 13CO J integrated intensity in Table 3 we find a lower limit of 0.06 M⊙ for the mass of the low velocity component. All these mass estimates are summarized in Table 6.
| Component | N | N | Mass |
|---|---|---|---|
| (1016 cm-2) | (1021 cm-2) | (M⊙) | |
| high velocity | 2.9 | 4.4 | 0.3 |
| medium velocity | 10.7 | 16.1 | 1.1 |
| low velocity | 0.3 | 0.5 | 0.06 |


6 Kinematics
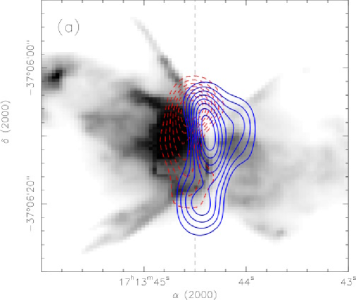
The molecular structure surrounding the central star of NGC 6302 is elongated in the North-South direction (see Fig. 4 and 5) and is coincident with the elongated structure previously seen in absorption on the H image (Matsuura et al. 2005a). When we overlay the high and medium velocity components observed in CO with the SMA (see Fig. 9a and c), we see that these two compoments appear to form the farside and nearside parts of a thick disk-like shaped structure surrounding the central star. Based on the angular size observed in 13CO J (see Fig. 9c) we can estimate the physical diameter and thickness of this structure. Considering that NGC 6302 is located at kpc (Meaburn et al. 2005), we infer a diameter for the disk-like structure of D pc, and a thickness pc. However although the morphology is similar to a disk, the velocity structure is clearly not.
6.1 The torus velocity structure
Considering the medium and high velocity CO components as tracing a disk-like structure, the velocity channel marking the limit between the two should correspond to the systemic velocity of NGC 6302. This velocity is found to be about km s-1. This is in remarkable agreement with the value of km s-1 derived by Meaburn et al. (2005) given the very different methods used.
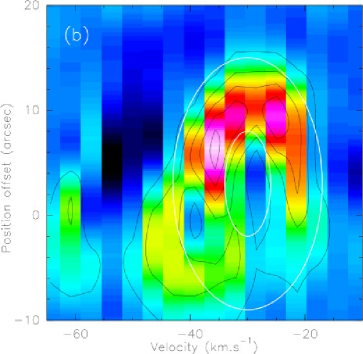
For the 13CO J transition, Fig. 9b displays the position-velocity (PV) diagram constructed along a North-South axis (dashed lines) passing through the center of NGC 6302. In this PV diagram we see the presence of a ring-shape structure centered at the systemic velocity, km s-1, and at the position (2000)=-37d06′12.5′′. A similar PV diagram is observed in 12 CO. The low velocity component on the left part of the 13CO J PV diagrams as a fainter peak. The ring-shape structure observed in the PV diagrams does not suggest rotation as it would be the case for a rotating disk. Compared to the systemic velocity the high velocity component, the rear part of the structure, is red shifted, while the medium velocity component is blue shifted. This configuration clearly suggests expanding motion. Rather than a disk, the molecular structure seen around the central star of NGC 6302 is more like an expanding molecular torus.
For a complete, uniform expanding torus seen edge-on, the PV diagram constructed along the torus should ideally reveal an ellipse whose extent along the velocity axis directly gives its expansion velocity. Actually, the shape and overlap of the front and back parts of the torus (see Fig. 9a), as well as the previous measurements of the NGC 6302 outflow angle compared to the plane of the sky (i.e. 18∘; Meaburn et al. 2005) show that this torus is seen nearly, but not exactly, edge-on. In Fig. 9b we plot an ellipse which delimitates the molecular emission. This ellipse fits quite well the ring-like shape structure, although we note that there is emission missing in the southern part of the red shifted emission (i.e. the high velocity component is less extended than the medium one; cf Fig. 9a). From these ellipses we can infer the mean projected expansion velocity of 9 km s-1. Since we know the angle of the outflow axis to the plane of the sky, 18∘, we can, assuming that the torus axis has the same angle, correct the expansion velocity from the projection. But since this correction corresponds to only 0.5 km s-1 which is comparable to the uncertainties, we adopt V km s-1. If there was some rotation (or overall velocity gradient) associated with the torus the ellipse in the PV diagram would be inclined and possibly twisted. Although difficult to accurately constrain without a detailed model, Fig. 9b indicates that any such gradient has a magnitude of km s-1 pc-1.
The analysis of the lowest velocity CO component is more problematic. The emission from this component is less similar in the 12CO J and 13CO J transitions than is the case for the torus emission. However its greater velocity from the systemic velocity of the sources leads us to interpret this component as associated with the outflow from the source. Interestingly this component is projected onto the source in the region where the torus emission is weakest, perhaps suggesting this may material being accelerated out of the torus.
6.2 Position-offset diagrams: ballistic flow
To uncover the general velocity pattern, we determine for each velocity channel the position and flux of the brightest pixel. The radial offset of this pixel from the stellar position is measured. We assume the star to be located at the position proposed by Matsuura et al. (2005a; cf Fig.6). This technique reduces drastically the amount of information contained in the images, but has been found to provide a powerful tool, used, e.g., in maser studies of circumstellar envelopes.

We apply this method to the SMA 12CO J data, which shows best signal to noise ratio. The result is shown in Fig. 10. We select all channels with peak flux above 1 mJy/beam. The left panel shows the positions of these peaks. The stellar position is taken as (0,0). Different symbols indicate the velocity ranges. Larger symbols are used for stronger peak fluxes. The distribution is reasonably well fitted with a tilted ring, with a radius of 5.5′′, an inclination of 18∘ (Meaburn et al. 2005), rotated to a position angle of ∘.
The right panel of Fig. 10 shows the velocity versus the angular separation between the peak and the assumed stellar position. Such diagrams can distinguish between expanding shells and polar flows (Zijlstra et al. 2001). Both are present here. The solid line is our model for the ring, where the best fit is found for a central velocity and an expansion velocity . These differ slightly from the earlier fits but are within the uncertainties. The symbols clustering around the drawn line shows that part of the CO emission is well derscribed by an expanding ring. In the following sections we consider the values inferred from the best fit model as the reference ones.
On Fig. 10 (right) we also notice that at higher and lower velocity two linear features appear. These show velocity linearly increasing with distance from the star. This is indicative of polar flows. The ballistic nature of these can be understood as due to the interaction of a slow and a fast wind, where the swept-up interface moves at a constant but direction-dependent velocity. This gives rise to a ballistic flow pattern (Zijlstra et al. 2001), seen in bipolar OH/IR stars.
The velocity range of this component is small in NGC 6302, compared to typical for bipolar OH/IR stars. The gradient is . But it shows a considerable spatial extent, 2-3 times the size of the ring. The linear flows are seen on either side of the star, and both approaching and receding components with respect to the systemic velocity, are present.
7 Discussion
7.1 Comparison with other objects
Molecular gas is relatively common among planetary nebulae. It is seen among the youngest objects where the high density material traps the dissociation and ionization fronts within the nebulae. As the nebula expands and dilutes, the molecular regions will be overrun (Huggins et al. 1996, Woods et al. 2005). In the most recent and the most sensitive survey, Huggins et al. (2005) detect CO emission for 40 nebula out of a sample of 110, although only a few are as bright as NGC 6302.
CO torii are known for a number of objects in a similar evolutionary phase. M 1-16 (Huggins et al. 2000) has an extensive envelope of 0.12 M⊙, around a very compact ionized region. NGC 7027 also has a high-mass () CO shell, but its ionized nebula is elliptical and lacks the butterfly shape. A closer optical morphological analogy is NGC 2346, which is also a butterfly nebula: it shows CO distributed in a clumped expanding ring with an estimated mass of 0.1 M⊙ (Bachiller et al. 1989).
During the preceding phase of the post-AGB nebulae, where the star has ceased its mass loss and left the AGB, but the star is still too cool to cause significant ionization, CO is always present. Such objects tend to show strong bipolarity; CO velocities up to 200 km s-1 are seen (Bujarrabal et al. 2001) although the spectra are dominated by more sedate material. In some cases a Keplerian disk is present (e.g. Bujarrabal et al. 2005). Woods et al. (2005) show that two distinct classes of objects exist in this phase, one rich in different molecules and the other only showing a small subset, but both types show CO emission. The molecule rich class (objects such as CRL 618, OH 231.8+4.2) shows the highest density torii, similar to that in NGC 6302.
However, NGC 6302 differs from the other objects in the class, in that it is more evolved, with a much hotter central star and a high mass for the molecular torus. The full line width of 50 km s-1 is typical for planetary nebulae, althought about half the line width is due to the bipolar, ballistic flow first detected in the SMA data.
7.2 Torus properties
The CO emission in NGC 6302 comes predominantly from a compact, expanding torus centred on the exciting star. This CO emission requires that there are at least two different temperature components of the CO. These components are similar in temperature to those identified in the dust emission from this source by Kemper et al. (2002) suggesting that both dust components are associated with the torus rather than the outflow lobes as Kemper et al. suggested for the warmer dust. The properties of the CO emission have a number of important implications for the origin and evolution of this system.
The best estimate of the mass of the torus is M⊙ assuming a 13CO to 12CO abundance ratio of 15. This mass is similar to that inferred from the submillimetre continuum observations of Matsuura et al. (2005a), but significantly higher than those estimated from previous observations of CO, e.g. Huggins & Healy (1989). This discrepancy probably results from a combination of previous underestimates of both the integrated intensity of the CO J line and opacity of the transition. In addition to the molecular material traced by the CO, previous observations have identified 0.05M⊙ of ionised HI (Gomez et al. 1989), and 0.25M⊙ in low excitation atomic gas traced by CII (Castro-Carrizo et al. 2001) (all scaled to the assumed 1 kpc distance) associated with the source. The CO torus therefore completely dominates the mass of the circumstellar material associated with NGC 6302.
The high mass of the CO torus means that NGC 6302 has the highest mass of inner circumstellar material of any PN or proto-planetary nebula (PPN) known. The survey of PPNe, likely models for the progenitor to NGC 6302, by Bujarrabal et al. (2001) found only two objects with masses of circumstellar comparable or larger than found in NGC 6302, but both these objects, AFGL2343 and IRAS+10420, are classified as yellow hypergiants with broad CO lines without a clear line core-wing separation, unlike the PPN sources. However it is has been suggested that that the distance to these sources have been overestimated, consequently with much lower masses of circumstellar material (Josselin & Lèbre 2001).
As mentioned above, the lowest velocity CO component is not part of the expanding torus. Spatially it appears close to the region where the torus emission is incomplete, suggestive of it being part of the torus which has been distrupted and accelerated by the outflow from the central star. Evidence that this may be occurring comes from the high excitation lines detected by Feibelman (2001). These lines peak at velocities between km/s and km s-1 which would associate them with this most blueshifted CO material. Meaburn et al. (2005) also finds significantly blueshifted forbidden Nii emission at close to the position of the lowest velocity CO component. This clump of CO material therefore appears to the source of at least some of the material seen in the ionised outflow. The velocity of these UV and optical lines is quite different from the km s-1 to km s-1 velocities of the IR recombination lines and low excitation atomic lines (Casassus et al. 2000; Castro-Carrizo et al. 2001), which in light of the CO torus would appear kinematically to originate from within the CO torus.
7.3 Age
The size and velocity of the CO torus can be used to infer a number of timescales associated with the system. The radius of the outer edge of the torus is 13′′, corresponding to AU. With the best fit model expansion velocity of km s-1 this implies that the event which initiated the expansion of the torus occurred 7500 years ago. From the apparent thickness of the torus, i.e. 8000 AU, the event which produced the torus lasted for about 4600 years; the event ended years ago. These timescales assume that the limits of the current CO emission trace the full extent of the original material of the torus and that the apparent inner edge marks the end of the ejection event.
The ballistic flow cannot be dated as its inclination angle with respect to the plane of the sky is not known. If we assume it dates from the time after the torus ejection, we find from the velocity gradient (140 km s-1 pc-1) that degrees, where is the angle with the line of sight.
Meaburn et al. (2005) find a younger age from the expansion profile of the north-western optical lobe, 1.7 arcmin from the star. They date the lobe to an age of 1900 yr. Within the uncertainties, this may be similar to the end of the torus ejection (as seen in NGC 6537, a similar nebula to NGC 6302: Matsuura et al. 2005b). However, the bipolar lobes may also have formed later.
7.4 Progenitor star
Combining the total mass of the circumstellar material currently associated with the nebula, M⊙ , with the estimated current mass of the central star, 0.7-0.8M⊙ (Casassus et al. 2000) gives an absolute lower limit on the mass of the progenitor of the system of M⊙. The upper mass limit is 8 M⊙, based on the fact that stars more massive than this do not become post-AGB stars, but instead ignite their carbon core. This mass limit is consistent with the M⊙ progenitor required to produce the high temperature, high-mass stellar remnant. Intriguingly, this means that the bulk of the inital mass of the system is still present close to the star.
Bipolar planetary nebulae have on average higher-mass progenitors, based on their smaller Galactic scale height of bipolar nebulae (Corradi & Schwarz 1995; Stanghellini et al. 2002). This is consistent with the high derived progenitor mass. The formation of bipolar nebulae has been linked to binary progenitors (Soker 1998a) and the angular momentum in such a system could easily drive the mass loss needed to generate the torus. Based on IUE observations, Feibelman (2001) has claimed that NGC 6302 is a binary system with a GV secondary, however the extensive circumstellar material and the extremely high extinction towards the central star makes this questionable. The UV flux more likely represents scattered light from the central star (see the discussion in Meaburn et al. 2005).
An infrared excess seen at the position of the star (Matsuura et al. 2005a) possibly represents a very compact circumstellar nebula. The excess can be free-free emission (as in Be stars) or very hot dust. The presence of circumstellar material located within the central cavity can be related to binarity (as in post-AGB stars with disks: van Winckel 2002). However, this is indicative only, and the binary nature of the central star remains suspected but unproven.
Casassus et al. (2000) noted that NGC 6302 does not show any evidence for a hot wind or wind blown cavity.This is surprising given the evidence for the ballistic flow, and the much faster flows in the ionized gas (Meaburn et al. 2005). The kinematics of the nebula makes it likely that a fast stellar wind did exist in the past.
7.5 Mass Loss and Evolution
For the progenitor to eject 2 M⊙ of material over period of 4600 years (based on the thickness of the torus) implies an average mass-loss rate of M⊙ yr-1, concentrated towards the equatorial plane. Even adopting the outer radius only of the torus to estimate the timescale and reducing the mass to minimum measured, 1.4M⊙ only reduces the mass-loss rate to M⊙ yr-1. This mass loss rate is consistent with those measured towards PPNe, although a factor of a few larger than typical (Bujarrabal et al. 2001). Interestingly the mass-loss rate for NGC 6302 is very similar to that infered from the similarly massive, but more spatially extended, CO shell around the hot PN NGC 7027 (Masson et al. 1985), although its shell is much less equatorially condensed.
Models show that mass-loss rates can only approach these values during the late AGB stage of evolution. However values as high as that seen for NGC 6302 are difficult to produce in the models, even for short periods. The NGC 6302 mass-loss rate exceeds any value obtained in models by Vassiliadis & Wood (1993) and is barely reached at the very tip of the distribution of the models by Bloecker (1995).
Mass loss on the AGB is assumed to be driven by radiation pressure on the dust. The achievable rates are limited by the available momentum in the stellar radiation field: this limit can be exceeded by a factor of two if multiple scattering of photons is taking into account (Vassiliadis & Wood 1993). Using the lower limit to the mass-loss rate, the expansion velocity derived above and a stellar luminosity , we find that the ratio between the momentum in the torus and the one available in the stellar radiation, is in NGC 6302 :
Considering that the mass loss is concentrated towards the equatorial plane, while the stellar radiation is isotropic, worsens the discrepancy. We conclude that, despite the low , the mass-loss history of the torus is difficult to achieve by standard radiation-pressure-driven mass loss. A similar argument, but with much larger discrepancies, is presented by Bujarrabal et al. (2001). On the other hand, the low expansion velocity is as expected from a dust–driven wind at very high (Habing et al. 1994).
In contrast, the energy requirements are relatively easily satisfied using a hypothetical binary companion. If we assume a 1 M⊙ companion in a 1 AU orbit, and that the envelope of a 3 M⊙ primary star is at the same radius at the onset of mass loss, a reduction of the secondary orbital radius to AU, whilst the mass of the primary reduces from 3 to 1 M⊙, will suffice to provide the energy to eject the torus. In the final configuration, the orbital period of the hypothetical binary will be days. We conclude that binary interaction can be a possible explanation for the ejection of the torus. A prediction of this would be the existence of a companion with an orbital period month.
The only butterfly-type nebula with a known binary nucleus is the above-mentioned NGC 2346, with a period of 16 days. This object also has a CO ring, albeit with considerable lower mass than seen in NGC 6302. It has an unusal period: almost all other known planetary nebulae with close binary central stars show much shorter periods, requiring common envelope evolution (Zijlstra 2006). A period of 16 days requires binary interaction (as the final orbit is smaller than the AGB star) whilst avoiding common envelope evolution which would lead to shorter orbits. However, whether this is common for the butterfly nebulae is not known.
8 Summary
High angular resolution observations of 12CO J and 13CO J have detected a massive torus centred on the exciting star. The observations indicate a lower limit of 15 for the abundance ratio 12CO/13CO and so by implication, 12C/13C. A detailed analysis of the emission in the J and J transitions of 12CO and 13CO indicates that the emission arises from material at two different temperatures. In total the torus contains M M⊙ of material, a very similar mass to that previously derived from observations of the dust continuum emission from the source. From our best fit model, this torus is expanding with a velocity of 8 km s-1 which leads to a dynamical age of the torus of 7500 yr, with the inner edge of the torus being ejected years ago. This ejection may have coincided with the eruptive event proposed to have formed the systems bipolar lobes. We speculate that the ejection of the inner edge of the torus also terminated the fast CO outflow which, while typical in the PPN progenitors of PN, is not detected in NGC 6302. The current mass within the PN implies that the progenitor of the system had a mass of M⊙ and during the formation of the torus sustained a mass loss rate of
The derived mass-loss history is difficult to fit using mass loss driven by radiation pressure. We find that binary interaction is a plausible mechanism leading to the ejection of the torus.
Ultimately the torus is likely to become photoionised by the central star, as is happening to the CO shell around NGC 7027. The photon dominated region where the UV from the star penetrates the CO torus, which is traced by the warm CO component observed here and the low excitation atomic lines observed by Castro-Carrizo et al. (2001), is likely to support a rich and complex chemistry, making NGC 6302 an interesting target for further molecular line observations.
References
- Bachiller et al. (1989) Bachiller, R., Planesas, P., Martin-Pintado, J., Bujarrabal, V., Tafalla, M. 1989. A&A, 210, 366
- Balick (1987) Balick, B. 1987, AJ, 94, 671
- Balick et al. (1987) Balick, B., Preston, H. L., & Icke, V. 1987, AJ, 94, 1641
- Balser et al. (2002) Balser, D. S., McMullin, J. P., & Wilson, T. L. 2002, ApJ, 572, 326
- Beckwith et al. (1990) Beckwith, S. V. W., Sargent, A. I., Chini, R. S., & Guesten, R. 1990, AJ, 99, 924
- Bloecker (1995) Bloecker, T. 1995, A&A, 297, 727
- Bujarrabal et al. (2001) Bujarrabal, V., Castro-Carrizo, A., Alcolea, J., & Sánchez Contreras, C. 2001, A&A, 377, 868
- Bujarrabal et al. (2005) Bujarrabal, V., Castro-Carrizo, A., Alcolea, J., & Neri, R. 2005, A&A, 441, 1031
- Casassus et al. (2000) Casassus, S., Roche, P. F., & Barlow, M. J. 2000, MNRAS, 314, 657
- Castro-Carrizo et al. (2001) Castro-Carrizo, A., Bujarrabal, V., Fong, D., Meixner, M., Tielens, A. G. G. M., Latter, W. B., & Barlow, M. J. 2001, A&A, 367, 674
- Corradi & Schwarz (1995) Corradi, R. L. M., & Schwarz, H. E. 1995, A&A, 293, 871
- Goldsmith & Langer (1999) Goldsmith, P. F., & Langer, W. D. 1999, ApJ, 517, 209
- Feibelman (2001) Feibelman, W. A. 2001, ApJ, 550, 785
- Frank & Mellema (1994) Frank, A., & Mellema, G. 1994, A&A, 289, 937
- Gomez et al. (1989) Gomez, Y., Rodriguez, L. F., Moran, J. M., & Garay, G. 1989, ApJ, 345, 862
- Habing et al. (1994) Habing, H. J., Tignon, J., Tielens, A. G. G. M., 1994, A&A, 286, 523
- Huggins & Healy (1989) Huggins, P. J., & Healy, A. P. 1989, ApJ, 346, 201
- Huggins et al. (1996) Huggins, P. J., Bachiller, R., Cox, P., & Forveille, T. 1996, A&A, 315, 284
- Huggins et al. (2000) Huggins, P. J., Forveille, T., Bachiller, R., & Cox, P., & 2000, ApJ, 544, 889
- Huggins et al. (2005) Huggins, P. J., Bachiller, R., Planesas, P.;, Forveille, T., & Cox, P., 2005, ApJS, 160, 272
- Icke (2003) Icke V., 2003, A&A, 405, L11
- Josselin & Lèbre (2001) Josselin, E., & Lèbre, A. 2001, A&A, 367, 826
- Kemper et al. (2002) Kemper, F., Molster, F. J., Jäger, C., & Waters, L. B. F. M. 2002, A&A, 394, 679
- Kwok et al. (1978) Kwok, S., Purton, C. R., & Fitzgerald, P. M. 1978, ApJ, 219, L125
- Levreault (1988) Levreault, R. M. 1988, ApJS, 67, 283
- Manchado (1997) Manchado, A. 1997, IAU Symp. 180: Planetary Nebulae, 180, 184
- Masson et al. (1985) Masson, C. R., et al. ApJ, 292, 464
- Matsuura et al. (2005a) Matsuura, M., Zijlstra, A. A., Molster, F. J., Waters, L. B. F. M., Nomura, H., Sahai, R., & Hoare, M. G. 2005a, MNRAS, 359, 383
- Matsuura et al. (2005b) Matsuura, M., Zijlstra, A. A., Gray, M. D., Molster, F. J., Waters, L. B. F. M., 2005b, MNRAS, 363, 628
- Meaburn et al. (2005) Meaburn, J., López, J. A., Steffen, W., Graham, M. F., & Holloway, A. J. 2005, AJ, 130, 2303
- Myers et al. (1983) Myers, P. C., Linke, R. A., & Benson, P. J. 1983, ApJ, 264, 517
- Pauldrach et al. (1988) Pauldrach, A., Puls, J., Kudritzki, R. P., Mendez, R. H., & Heap, S. R. 1988, A&A, 207, 123
- Payne et al. (1988) Payne, H. E., Phillips, J. A., & Terzian, Y. 1988, ApJ, 326, 368
- Siess & Livio (1999) Siess, L., & Livio, M. 1999, MNRAS, 304, 925
- Stanghellini et al. (2002) Stanghellini, L., Villaver, E., Manchado, A., & Guerrero, M. A. 2002, ApJ, 576, 285
- Schöier et al. (2005) Schöier, F.L., van der Tak, F.F.S., van Dishoeck, E.F., & Black, J.H. 2005, A&A 432, 369
- Soker (1998a) Soker, N. 1998a, ApJ, 496, 833
- Soker (1998b) Soker, N. 1998b, MNRAS, 299, 1242
- van Winckel (2002) van Winckel, H., 2002, ARA&A, 41, 391
- Vassiliadis & Wood (1993) Vassiliadis, E., & Wood, P. R. 1993, ApJ, 413, 641
- Woods et al. (2005) Woods, P. M., Nyman, L.- ., Schöier, F. L., Zijlstra, A. A., Millar, T. J., & Olofsson, H., 2005, A&A, 429, 977
- Zijlstra et al. (2001) Zijlstra, A. A., Chapman, J. M., te Lintel Hekkert, P., Likkel, L., Comeron, F., Norris, R. P., Molster, F. J., & Cohen, R. J. 2001, MNRAS, 322, 280
- Zijlstra (2006) Zijlstra A. A., 2006, in ’Evolution and chemistry of symbiotic stars and related objects’, Baltic Astronomy, in press (astro-ph/0610558)