Incoherent mid-infrared charge excitation and the high energy anomaly in the photoemission spectra of cuprates
Abstract
On the basis of a semi-phenomenological model, it is argued that the high energy anomaly observed in recent photoemission experiments on cuprates is caused by interaction with an overdamped bosonic mode in the mid-infrared region of the spectrum. Analysis of optical conductivity allows to connect this excitation to the incoherent charge response reported for the majority of high Tc materials and some other perovskites. We show that its large damping is an essential feature responsible for the “waterfall” dispersion and linewidth of the spectral weight.
pacs:
74.72.-h,79.60.-i, 74.25.JbThe “high energy anomaly” (HEA) in the angle resolved photoemission spectra of hole and electron doped cuprates has been reported recently in a number of works Graf -Pan . The anomaly is characterized by the presence of high energy kink in the dispersion derived from angle resolved photoemission spectroscopy (ARPES) at about eV below the Fermi surface followed by a puzzling “waterfall” structure at larger energies. The latter is highly incoherent and follows an almost vertical dispersion around the point extending till eV. When measured along the main symmetry directions of the Brillouin zone such broad linewidth remains roughly constant along the waterfall Graf ; Pan . The momentum distribution of the spectral weight at a fixed energy above the kink resembles a diamond shape (e.g. for in BISCO 2212 with the corner at and side center at ). At even higher energies the spectrum recovers the parabolic dispersion reminiscent of the “bare” band. Several mechanisms responsible for the observed behavior have been proposed, such as disintegration of the quasiparticles into a spinon and holon Graf , polaronic effects Xie , spin fluctuations whose spectrum can reach the relevant energy scale Valla ; Macridin ; Markiewicz , coherence-incoherence crossover Pan ; Chang ; Byczuk . However a controversy also exists in experimental data, e.g. regarding the role of matrix element effects in ARPES (KordyukBorisenko ; Alexandrov ; Chang ). The fixed energy slices of the incoherent tails reveal the existence of a “grid-like” structure when the spectral weight maxima are aligned to the directions and suppressed in the diagonal directions. It was suggested that selfenergy effects may therefore not be a cause of the anomaly which instead should be related to the presence of one dimensional structure. On the other side some experiments on magneto-optics spanning a broad frequency window (4000 cm-1) are apparently inconsistent with magnetic excitation scenario LeeSegawa ; DordevicHomes .
In Ref. HwangNicol the optical conductivity spectra have been analysed by a method allowing to extract the electron selfenergy within apparently general assumptions about the spectrum. However, no indication of the HEA has been found, while the well known low energy kink (LEK) and the above mentioned feature at eV are reproduced in good agreement with ARPES. On the other side, the analysis based on fermion-boson concept in Ref.Norman before the discovery of HEA has revealed that optical data do indicate the existence of a high energy cutoff of the boson spectrum at around meV. Also in several other earlier papers treating electron-boson scenario it has been demonstrated that taking into account the finite linewidth of the boson is important for the faithful description of the ARPES spectra Cap ; Carb ; Dogan . In particular, the LEK is well reproduced if the linewidth of the boson (phonon) is about of its energy. In this paper we show that the qualitatively new features of the HEA can be accounted for by assuming the “overdamped” regime for the “boson”, i.e., that the linewidth of this excitation is significantly larger than the characteristic energy. This assumption is motivated by the ubiquity of such incoherent excitations in the mid-infrared (MIR) frequency range of the optical spectra in cuprates as revealed, e.g., by Drude-Lorentz analysis. As explained below, although the bare frequency of such excitation is larger than the high energy kink, the scale that actually characterizes its effect on electron excitations falls in the relevant energy range. We consider the selfenergy effects within a simple model of electrons interacting with a bosonic mode in the form of damped oscillator. The parameters of the oscillator are chosen to match the known experimental data, in particular those from ARPES. As for instance, its coupling as extracted from the slope of single particle spectrum in the region preceding the HEA (e.g. for BISCO 2212 and LBCO is ), momentum and energy location of the observed structures etc. Valla ; KulicDolgov . Calculations show that the constraints set by the model and experimental data are rather restrictive so that the choice of parameters can not be reduced to simple fitting. For instance, it is not possible to obtain a vertical dispersion by choosing a small damping parameter and varying the others. We show that, indeed, the key component of the oscillator that accounts for the main anomalies like the “waterfall” and the large width of the ARPES tails, is the damping parameter. We further find quantitative similarities between the parameters of the oscillator and data available from optical experiments on different high Tc materials, namely, the incoherent excitation spectrum in the MIR region. It is known that this mid-gap incoherent part of the spectral weight emerges more quickly than the ”coherent” Drude part upon doping Nakano . Unfortunately, optical data can be related only to the long wave limit () of the “overdamped boson”, as there are no experimental probes available to study its dispersion characteristics. Therefore for our model calculations we have neglected the dispersion of this MIR oscillator. Nevertheless, we discuss some features reported in experiments that can be accounted for by considering an anisotropic dispersion.
In the Table I we have summarized the experimental data for the Lorentz oscillator component in the relevant MIR region of energies extracted from optical conductivity for the Drude-Lorentz representation of the dielectric function
| (1) |
The Drude component with damping and weight determined by the plasmon frequency ( eV) is centered at the frequency and damping of the discussed excitation are further denoted by and the “effective” frequency is explained below. The values of the oscillator strength corresponding to can be found in the listed papers, but are generally comparable to the weight of the Drude part of the dielectric function at optimal doping. It should be noted that data in the table are both doping and temperature dependent and that respective multi-component analysis in terms Drude-Lorentz oscillators depends on the number of components chosen. In particular, physical arguments suggest that an oscillator in the phononic frequency range of the MIR should be distinguished from the oscillator singled out in the table. Such a fitting procedure can be formalized, for instance, in the Kramers-Kronig constrained variational analysis, e.g. Heumen ; Kuzmenko . The obvious deficiency of such analysis is the absence of frequency dependence in the mass and relaxation rate of the Drude component (generalized Drude model) DordevicBasov . However for the energies of interest in the present context it is not expected to dramatically alter the estimations. Indeed, the generalized Drude model is appropriate for the lower energy part of the spectrum characterized by a single scattering mechanism, but is insufficient to account for the higher energy scale related to the HEA. For the estimates discussed in the present paper we assume that these scales can be treated independently in calculating the electronic selfenergy. As already mentioned, the long wavelength values of characteristic frequencies in the Table should be viewed as an estimate for the actual frequency of the overdamped charge excitation for our model since its value at finite momentum is not known.
We introduce the retarded bosonic propagator in the form of damped oscillator Mahan with spectral density :
| (2) |
The choice of (2) in our model is motivated by its compliance with the generic form of the response functions frequently used in analyzing experimental data that, in turn, corresponds to physical requirements, such as Kramers-Kronig relations. Coupling to electron excitations is considered in the second order of perturbation theory, i.e. non-selfconsistently. The scale of the boson frequency is assumed to still allow the adiabatic approximation to be reasonable at least for evaluation purposes (see Danylenko for a recent discussion). Although the vertex corrections and selfconsistent treatment are beyond the scope of the paper, their analysis certainly deserves a special consideration. Using the spectral representation for the Matsubara Green function, after carrying out the frequency summation and analytic continuation to real frequencies one obtains the second order expression for the retarded electron selfenergy, e.g. Marsiglio ; Dogan ,
| (3) |
where is the coupling constant and are Boson, Fermion distribution functions. The linewidth of the electronic spectral function is neglected, and a tight binding parametrization of the band dispersion is used as explained above, that allows to focus on the scattering mechanism due to the “boson”. If also the linewidth of is neglected, the expression (3) transforms into the one that has been often employed in describing the LEK ( see, e.g.ZhouCuk ) and results in the usual logarithmic singularity of Re at the boson frequency. To study the effect of the broad linewidth on electron spectrum we neglect the dispersion in spectral function (2) and in the coupling Then the selfenergy becomes a local function
| (4) |
where is the electronic density of states, is the dimensionless coupling constant. The coupling constant determined from the slope of Re is slightly different from . The band width of is taken as the energy unit in numerical calculations.
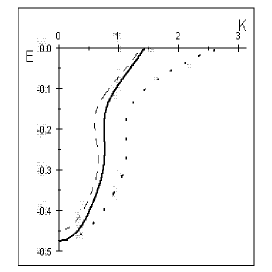
The spectral density of the damped oscillator (2) is peaked at the frequency where . It is clear that the effective frequency is significantly lower than due to a large damping typical for the MIR oscillator. As seen from the Fig.1, it is this effective frequency that sets the location of the high energy kink. In the figure we plot the Re and Im together with the “boson” spectral function to make the correlation between the peaks clearly visible. The slope of the Re corresponds to the coupling constant and the ratio of was taken to model the LSCO band . One can also see that the follows a at low energies and its inflection point corresponds to After reaching its maximum at higher energy follows an almost flat region until it starts decreasing closer to the band bottom. Such behavior has been reported in Graf ; Chang for the linewidth of the ARPES spectral function. In our calculations we clearly see the feature mentioned in HwangNicol and related to the finite bandwidth when the renormalized dispersion curve crosses with bare one. The crossing occurs at certain nonzero frequency within the waterfall region where Re
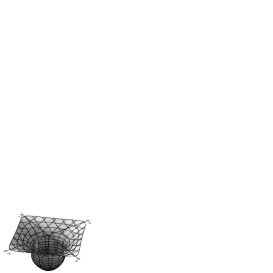
The calculated dispersion of the spectral function peak along the two main symmetry directions of the Brillouin zone are presented in Fig.2 for doping and band structure of BISCO 2212. The dashed curve shows the evolution of the curve at larger doping, for the diagonal direction. The HEA is close to at ( eV), the “waterfall” is superceded by parabolic dispersion at (eV). The momentum of HEA decreases with doping. These results qualitatively agree with experimental data Graf ; Valla and appear to suggest that the band structure is of primary importance for the location and doping dependence of the HEA, as the doping dependence of follows the shrinking of the Fermi surface. However, it should be taken into account that also the parameters of the MIR oscillator depend on doping. In particular, the quantitatively weaker dependence of observed in experiments could be related to the decrease of with doping. We are not aware of the doping dependence of the linewidth of the spectral function in the waterfall region, but our calculation (not shown) indicates its decrease with doping. The temperature dependence of is very weak in the relevant region of energies. We find a broader linewidth in the and directions as compared to the diagonal in agreement with the measurements presented in Pan . Fig.3 shows the calculated three dimensional dispersion of the spectral density peak within the Brillouin zone obtained by neglecting the dispersion of the damped oscillator that agrees with the results reported in Graf . However, as noted, the ARPES measurements presented in some other papers KordyukBorisenko ; Valla ; Chang show an anisotropic structure of the HEA. These results can be described within the present model by introducing the anisotropy into the parameters of the oscillator. For instance, the difference in energy of the kink for momentum cuts along different directions of the Brilouin zone found in Chang can be explained by a larger value of along the diagonal direction. In a different context, it has been noted that the MIR peak in optics is affected by lattice oscillations Piekarz . It has also been suggested CCM that the anomalous softening of the bond-stretching in plane phonon mode is related to an overdamped charge excitation in the same MIR part of the spectrum and that the behavior of this mode could serve as an energy-momentum resolved probe for the charge excitation. This raises an intriguing possibility that the same overdamped excitation is responsible for the phonon anomaly and the HEA. One of its characteristics implied from the phonon analysis is the anisotropy of the charge response at finite momentum in the energy range that matches the grid-like pattern mentioned in KordyukBorisenko . Namely that anomalous phonon softening occurs in the directions and a much smaller effect is observed in the direction. This anisotropy is related to a larger charge response located at lower energies for the orthogonal direction as compared to more dispersive and weaker response along the diagonal. The strength of the anisotropy depends on the material and doping. Interestingly, in the papers Valla ; Chang the energy of the kink (in absolute value) in was found to decrease significantly away from the diagonal direction of the Brillouin zone. This behavior is also in agreement with the MIR charge “boson” scenario proposed here. The broad incoherent spectrum above the high energy kink emerges due to the composite nature of electronic excitation (in itself a source of finite linewidth) with emission of an “overdamped boson”. This explains the qualitative difference between the high and low energy kinks. In the latter case the linewidth of the boson is not more than of its energy scale, while in the case of MIR it is an order of magnitude larger. At the same time, for a comparable coupling constant, such linewidth accounts for the verticality of the dispersion and linewidth of the waterfall. As we have seen, the Im remains almost flat in this region. At energies around eV the Im starts to decrease and the dispersion recovers the bare band parabolic shape, albeit shifted to higher energies. It should be mentioned that the optical conductivity data have served only for estimations and, as discussed above, one needs to have a probe for momentum resolved charge excitations in the eV range to characterize the “overdamped boson”.
In [Graf, ] several other types of materials have been scrutinised for HEA, but no evidence has been found. It follows from the proposed scenario that HEA should exist in the ARPES of other perovskite materials where the incoherent MIR excitation has been observed (and vice versa). For instance, in the paper Sun the ARPES analysis is focused on the LEK at meV in bilayer manganite However, also the data for higher energies are presented, where the existence of the other kink at around eV is clearly visible. It would also be interesting to carry out a similar search for the HEA in ARPES experiments on a non-magnetic perovskite such as with a relatively high Tc that is also known to have an incoherent charge excitation in the MIR about eV Kaufmann ; Ahmad ; Puchkov as well as anomalous softening of the bond-stretching phonon mode Braden .
References
- (1) J. Graf, G.-H. Gweon, K. McElroy, S. Y. Zhou, C. Jozwiak, E. Rotenberg, A. Bill, T. Sasagawa, H. Eisaki, S. Uchida, H. Takagi, D.-H. Lee, and A. Lanzara, Phys. Rev. Lett. 98, 067004 (2007).
- (2) B. P. Xie, K. Yang, D. W. Shen, J. F. Zhao, H. W. Ou, J. Wei, S. Y. Gu, M. Arita, S. Qiao, H. Namatame, M. Taniguchi, N. Kaneko, H. Eisaki, Z. Q. Yang and D. L. Feng, cond-mat/0607450.
- (3) T. Valla, T. E. Kidd, Z. -H. Pan, A. V. Fedorov, W. -G. Yin, G. D. Gu and P. D. Johnson, cond-mat/0610249.
- (4) W. Meevasana, X.J. Zhou, S. Sahrakorpi, W.S. Lee, W.L. Yang, K. Tanaka, N. Mannella, T. Yoshida, D. H. Lu, Y.L. Chen, R.H. He, Hsin Lin, S. Komiya, Y. Ando, F. Zhou, W.X. Ti, J.W. Xiong, Z. X. Zhao, T. Sasagawa, T. Kakeshita, K. Fujita, S. Uchida, H. Eisaki, A. Fujimori, Z. Hussain, R. S. Markiewicz, A. Bansil, N. Nagaosa, J. Zaanen, T.P. Devereaux, Z.-X. Shen, cond-mat/0612541.
- (5) J. Chang, S. Pailhes, M. Shi, M. Ma nsson, T. Claesson, O. Tjernberg, J. Voigt, V. Perez-Dieste, L. Patthey, N. Momono, M. Oda, M. Ido, A. Schnyder, C. Mudry, J. Mesot, cond-mat/0610880.
- (6) Z.-H. Pan, P. Richard, A.V. Fedorov, T. Kondo, T. Takeuchi, S.L. Li, Pengcheng Dai, G.D. Gu, W. Ku, Z. Wang, H. Ding, cond-mat/0610442.
- (7) R. S. Markiewicz, S. Sahrakorpi, M. Lindroos, H. Lin, and A. Bansil, Phys. Rev. B 72, 054519 (2005).
- (8) A. Macridin, M. Jarrell, T. Maier, and D. J. Scalapino, cond-mat/0701429.
- (9) K. Byczuk, M. Kollar, K. Held, Y.-F. Yang, I. A. Nekrasov, Th. Pruschke, D. Vollhardt, Nature Physics 3, 168 (2007).
- (10) A. S. Alexandrov, K. Reynolds, cond-mat/0702609.
- (11) A. A. Kordyuk, S. V. Borisenko, D. Inosov, V. B. Zabolotnyy, J. Fink, B. Buechner, R. Follath, V. Hinkov, B. Keimer, H. Berger, cond-mat/0702374.
- (12) S. V. Dordevic, C. C. Homes, G. D. Gu, W. Si, and Y. J. Wang, Phys. Rev. B 73, 132501 (2006).
- (13) Y. S. Lee, Kouji Segawa, Z. Q. Li, W. J. Padilla, M. Dumm, S. V. Dordevic, C. C. Homes, Yoichi Ando, and D. N. Basov, Phys. Rev. B 72, 054529 (2005).
- (14) J. Hwang, E.J. Nicol, T. Timusk, A. Knigavko, and J.P. Carbotte, cond- mat/0610488.
- (15) M.R. Norman and A.V. Chubukov, Phys. Rev. B 73, 140501R (2006); cond- mat/0511584.
- (16) E. Cappelluti and L. Pietronero, Phys. Rev. B 68, 224511 (2003).
- (17) J. P. Carbotte, E. Schachinger, and J. Hwang, Phys. Rev. B 71, 054506 (2005).
- (18) F. Dogan and Marsiglio, cond-mat/0603635 (2006).
- (19) M. Kulic and O. Dolgov, cond-mat/0610549.
- (20) H. Nakano, Y. Takahashi, M. Imada, cond-mat/0701735.
- (21) M. A. Quijada, D. B. Tanner, R. J. Kelley, M. Onellion, H. Berger, and G. Margaritondo, Phys. Rev. B 60, 14917 (1999).
- (22) N. L. Wang, P. Zheng, T. Feng, G. D. Gu, C. C. Homes, J. M. Tranquada, B. D. Gaulin, and T. Timusk, Phys. Rev. B 67, 134526 (2003).
- (23) S. Uchida, T. Ido, H. Takagi, T. Arima, Y. Tokura, and S. Tajima, Phys. Rev. B 43, 7942 (1991).
- (24) J. Kircher, M. Cardona, A. Zibold, H.-P. Geserich, E. Kaldis, J. Karpinski, and S. Rusiecki, Phys. Rev. B 48, 3993 (1993).
- (25) E. van Heumen, R. Lortz, A.B. Kuzmenko, F. Carbone, D. van der Marel, X. Zhao, G. Yu, Y. Cho, N. Barisic, M. Greven, C.C. Homes, S.V. Dordevic, Phys. Rev. B 75, 054522 (2007).
- (26) F. Carbone, A. B. Kuzmenko, H. J. A. Molegraaf, E. van Heumen, V. Lukovac, F. Marsiglio, D. van der Marel, K. Haule, G. Kotliar, H. Berger and S. Courjault, P. H. Kes and M. Li, Phys. Rev. B 74, 064510 (2006).
- (27) J. Orenstein, G.A. Thomas, D.H. Rapkine, C.G. Bethea, B.F. Levine, R.J. Cava, E.A. Rietman, and D.W. Johnson, Jr., Phys. Rev. B 36, 729 (1987).
- (28) A. B. Kuzmenko, Rev. Sci. Instrum. 76, 083108 (2005).
- (29) S.V. Dordevic and D. N. Basov, Ann. Phys. (Leipzig) 15, 545 (2006).
- (30) G. D. Mahan, Many-Particle Physics (Plenum, New York, 1990).
- (31) O.V. Danylenko and O.V. Dolgov, Phys. Rev. B 63, 094506 (2001).
- (32) F. Marsiglio, M. Schossmann, and J. P. Carbotte, Phys. Rev. B 37, 4965 (1988).
- (33) X. J. Zhou, T. Cuk, T. Devereaux, N. Nagaosa, and Z.-X. Shen, Treatise of High Temperature Superconductivity, edited by J. Robert Schrieffer (2006), cond-mat/0604284.
- (34) P. Piekarz and T. Egami, Phys. Rev. B 72, 054530 (2005).
- (35) S. Cojocaru, R. Citro, and M. Marinaro, Phys. Rev. B 75, 014516 (2007).
- (36) Z. Sun, Y.-D. Chuang, A. V. Fedorov, J. F. Douglas, D. Reznik, F. Weber, N. Aliouane, D. N. Argyriou, H. Zheng, J. F. Mitchell, T. Kimura, Y. Tokura, A. Revcolevschi, and D. S. Dessau, Phys. Rev. Lett. 97, 056401 (2006).
- (37) H. J. Kaufmann, O. V. Dolgov, and E. K. H. Salje, Phys. Rev. B 58, 9479 (1998).
- (38) J. Ahmad and H. Uwe, Phys. Rev. B 72, 125103 2005).
- (39) A. V. Puchkov, T. Timusk, M. A. Karlow, S. L. Cooper, P. D. Han and D. A. Payne, Phys. Rev. B 54, 6686 (1996).
- (40) M. Braden, L. Pintschovius, T. Uefuji, and K. Yamada, Phys. Rev. B 72, 184517 (2005).