First performance studies of a prototype for the CASTOR
forward calorimeter at the CMS experiment
X. Aslanoglou1, A. Cyz2, N. Davis3, D. d’Enterria4, E. Gladysz-Dziadus2,
C. Kalfas5, Y. Musienko6, A. Kuznetsov6, A. D. Panagiotou3
1 University of Ioannina, PO Box 1186, 45110 Ionnanina, Hellas 2 Institute of Nuclear Physics, Radzikowskiego 152, 31342 Krakow, Poland 3 University of Athens, Phys. Dept. 15701 Athens, Hellas 4 CERN, PH Dept., 1211 Geneva 23, Switzerland 5 NRC “Demokritos” INP, PO Box 60228, 15310 Ionnanina, Hellas 6 Northeastern University, Dept. of Physics, Boston, MA 02215, USA
Abstract
We present results on the performance of the first prototype of the CASTOR quartz-tungsten sampling calorimeter, to be installed in the very forward region of the CMS experiment at the LHC. This study includes geant Monte Carlo simulations of the Čerenkov light transmission efficiency of different types of air-core light guides, as well as analysis of the calorimeter linearity and resolution as a function of energy and impact-point, obtained with 20-200 GeV electron beams from CERN/SPS tests in 2003. Several configurations of the calorimeter have been tested and compared, including different combinations of (i) structures for the active material of the calorimeter (quartz plates and fibres), (ii) various light-guide reflecting materials (glass and foil reflectors) and (iii) photodetector devices (photomultipliers and avalanche photodiodes).
KEYWORDS: CASTOR, CMS, LHC, forward, electromagnetic calorimeter, hadronic calorimeter, quartz, tungsten, sampling calorimeter, Čerenkov light.
1 Introduction
The CASTOR (Centauro And Strange Object Research) detector is a quartz-tungsten
sampling calorimeter that has been proposed to study the very forward rapidity
(baryon-rich) region in heavy ion collisions in the multi-TeV range at the LHC castor1
and thus to complement the heavy ion physics programme, focused mainly in the baryon-free
midrapidity region ptdr . CASTOR will be installed in the CMS experiment at 14.38 m from the
interaction point, covering the pseudorapidity range 5.2 6.6 and will, thus,
contribute not only to the heavy ion program, but also to diffractive and low- physics
in pp collisions castor_forw . The CMS and TOTEM experiments supplemented by the
CASTOR detector will constitute the largest acceptance system ever built at a hadron
collider, having the possibility to measure the forward energy and particle flow up to
= 6.6. With the design specifications for CASTOR,
the total and the electromagnetic energies in its acceptance range (180 TeV
and 50 TeV respectively according to hijing hijing PbPb simulations
at 5.5 TeV) can be measured with a resolution better than 1% and, therefore,
“Centauro” and/or strangelets events with an unusual ratio of electromagnetic to total
(hadronic) energies Gladysz-Dziadus:2001cq can be well identified.
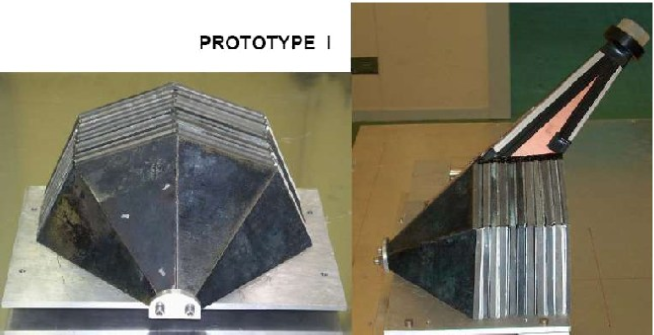
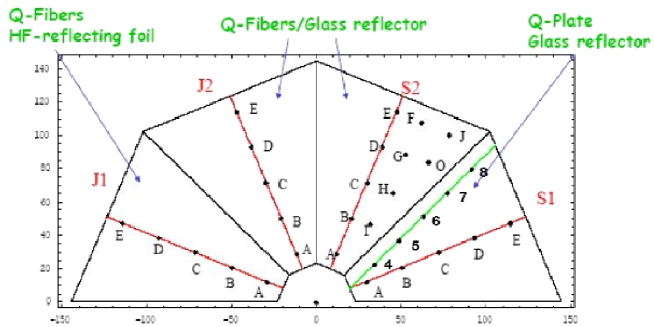
A calorimeter prototype has been constructed and tested with electron beams at CERN/SPS in the summer 2003. The purpose of this beam test was to investigate and compare the performance of different component options (structure of the quartz active material, choice of the light guides/reflectors and photodetector devices), rather than to obtain precise quantitative results of the response of the final detector setup. The general view of the prototype is shown in Figure 1. The different detector configurations considered in this work are shown schematically in Figure 2. Preliminary results of the analysis have been presented at different CMS meetings castor_meetgs . Here we present a more quantitative analysis, including the beam profile data.
2 Technical description
The CASTOR detector is a Čerenkov-effect based calorimeter with tungsten (W) absorber and quartz (Q) as sensitive material. An incident high-energy particle will shower in the tungsten volume and produce relativistic charged particles that will emit Čerenkov light in the quartz plane. The Čerenkov light is then collected and transmitted to photodetector devices through air-core light-guides. The different instrumentation options, investigated in this work, are shown in Figure 2. In section 2.1 we describe the various arrangements of the active (quartz) and passive (tungsten) materials of the calorimeter considered. Section 2.2 discusses the light transmission efficiency of different light-guide geometries, section 2.3 compares two different light-guide reflecting materials, and section 2.4 summarizes the characteristics of the photodetectors (photomultipliers and avalanche photodiodes) tested.
2.1 Tungsten - Quartz
The calorimeter prototype is azimuthally divided into 4 octants and longitudinally segmented into 10 W/Q layers (Fig. 1). Each tungsten absorber layer is followed by a number of quartz planes. The tungsten/quartz planes are inclined at 45∘ with respect to the beam axis to maximize Čerenkov light output111The index of refraction of quartz is for wavelengths = 600-200 nm. The corresponding Čerenkov threshold velocity is , and therefore, for 1 the angle of emission is .. The effective length of each W-plate is 7.07 mm, being inclined at 45∘. The total length is calculated to be 0.73 and 19.86, taking a density for the used W-plates of 19.0 g/cm3 and ignoring the contribution of the quartz material.
The calorimeter response and relative energy resolution were studied for quartz fibres (Q-F) and quartz plates (Q-P) (see Section 3). We have tested four octant readout units of the calorimeter, arranged side-by-side in four azimuthal sectors. Each readout unit consisted of 10 sampling units. Each sampling unit for sectors J1, J2, and S2 (see Fig. 2) is comprised of a 5 mm thick tungsten plate and three planes of 640 m thick quartz fibres. The quartz fibres were produced by Ceram Optec and have 600 m pure fused silica core with a 40 m polymer cladding and a corresponding numerical aperture NA = 0.37 (in general, an optical fibre consists of the core with index of refraction , and the cladding with index , and NA = ). The sampling unit for sector S1 consisted of a 5 mm thick tungsten plate and one 1.8 mm thick quartz plate. Both types of quartz active material, fibre or plate, had about the same effective thickness. The filling ratio was 30% and 37% for the quartz fibres and quartz plates, respectively.
2.2 Air-core light guides
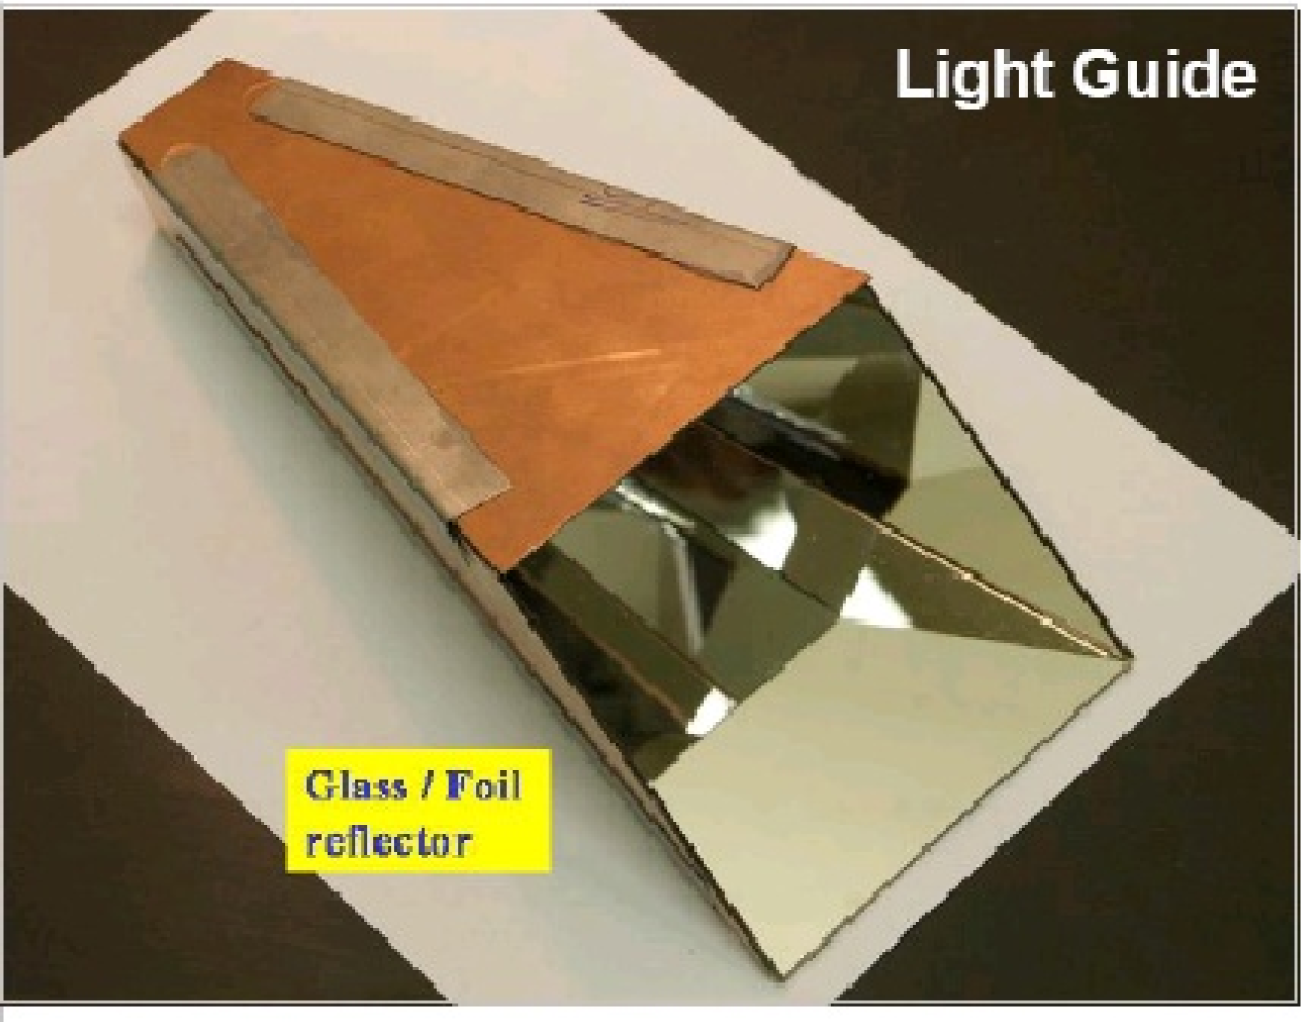
The light guide constructed for the CASTOR prototype I is shown in Figure 3. It is an air-core light-guide made of Cu-plated 0.8 mm PVC (the internal walls are covered either with a glass reflector or with a reflector foil, which are compared in the next section). In this section the optimal design and dimensions of the light guide are obtained based on detailed geant Monte Carlo simulations.
In the simulations, the Čerenkov photons produced in the quartz of the calorimeter are collected and transmitted to the photodetectors by air-core light guides. The efficiency of light transmission and its dependence on the light-source position are crucial parameters characterizing the light guide and significantly affecting the performance of the calorimeter. We developed a geant 3.21-based code to simulate the transmission of Čerenkov photons produced in the quartz plane through a light guide mavro . A photon is tracked until it is either absorbed by the walls or by the medium and is thus lost, or until it escapes from the light guide volume. In the latter case it is considered detected only if it escapes through the exit to the photodetector. If it is back-scattered towards the entry of the light guide it is also lost.
Inside the fibre core Čerenkov photons are practically produced isotropically. But those that are captured and propagate through the lightguide have an exit angle with respect to the fibre longitudinal axis up to a maximum value () which depends on the numerical aperture NA and the core refraction index (). When traversing the core-air boundary at the entrance of the lightguide, the photons undergo refraction resulting in a larger angle (). In the simulations, fibres of various numerical apertures (NA = 0.22 - 0.48) as well as light-guides of various shapes (fully square cross section or partially tapered) were used (see Fig. 4). The maximum values of core-exiting and air-entering angles (, ) in degrees for various numerical apertures are given in Table 1. For the quartz plate, the air-entering angle, , is larger than 30∘.
| NA (=1.46) | ||
|---|---|---|
| 0.22 | 8.7 | 12.7 |
| 0.37 | 14.7 | 21.7 |
| 0.40 | 15.9 | 23.6 |
| 0.44 | 17.5 | 26.1 |
| 0.48 | 19.2 | 28.7 |
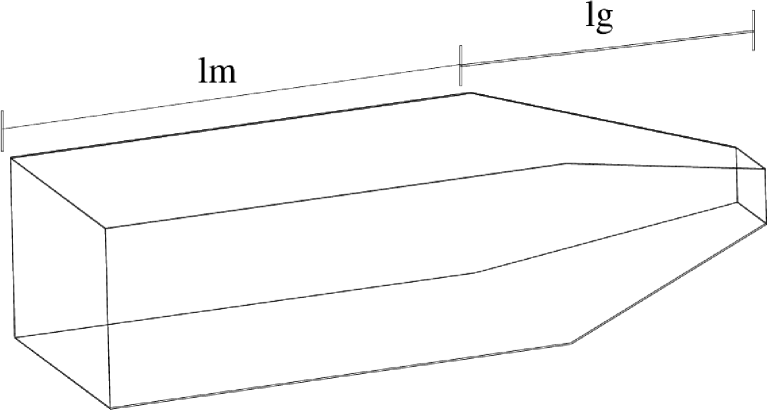
The walls of the geant light-guide have a reflection coefficient of 0.85 (simulating the transmittance of the reflecting internal mirror surface and the quantum efficiency of the photodetector devices, see next Section and Table 6). The entrance plane of the light guide was uniformly scanned with the simulated light source. The percentage of photons escaping in the direction of the photodetector has been recorded as a function of the source position, giving, after integration over the complete surface, the light guide efficiency. The spatial uniformity of the light-guide performance can be quantified with the relative variation (mean) of the efficiency across the entrance. Results for the light guides efficiency and uniformity studied are tabulated222Note, that only the points relevant for the actual light-guide construction are included in the table. in Tables 1–5 and are plotted in Figures 5 and 6 for fibres with NA = 0.37 and 0.48, respectively. We studied air-core lightguides of square cross section (with entrance area 1010 cm2), fully or partially tapered. The parameters and refer to the tapered and non-tapered sections of the light guide, as shown in Figure 4, defined as mavro :
-
= ratio of the length of the tapered part over the width of the entrance plane, and
-
= ratio of the length of non tapered part over the width of the entrance plane.
Thus, e.g. with a mean entrance length of 10 cm, a value =1:2 indicates that the light-guide has a total length of 30 cm with 10 cm of tapering part, and a value =2:0 indicates a fully tapered light-guide with length 20 cm, and so on. In tables 2–5, the row (column) indicates the magnitude of the parameters (), respectively.
| 0 | 1 | 2 | |
|---|---|---|---|
| 1 | 38.3 | 34.5 | 34.8 |
| 2 | 46.1 | 39.1 | 43.2 |
| 3 | 44.8 | 41.8 | 41.5 |
| 0 | 1 | 2 | |
|---|---|---|---|
| 1 | 39.3 | 35.5 | 3.6 |
| 2 | 8.9 | 38.3 | 3.4 |
| 3 | 3.3 | 22.8 | 3.2 |
| 0 | 1 | 2 | |
|---|---|---|---|
| 1 | 31.1 | 28.3 | 27.1 |
| 2 | 30.1 | 27.5 | 27.5 |
| 3 | 27.1 | 25.0 | 25.0 |
| 0 | 1 | 2 | |
|---|---|---|---|
| 1 | 20.4 | 23.8 | 4.1 |
| 2 | 3.9 | 28.4 | 4.6 |
| 3 | 3.8 | 23.2 | 3.7 |
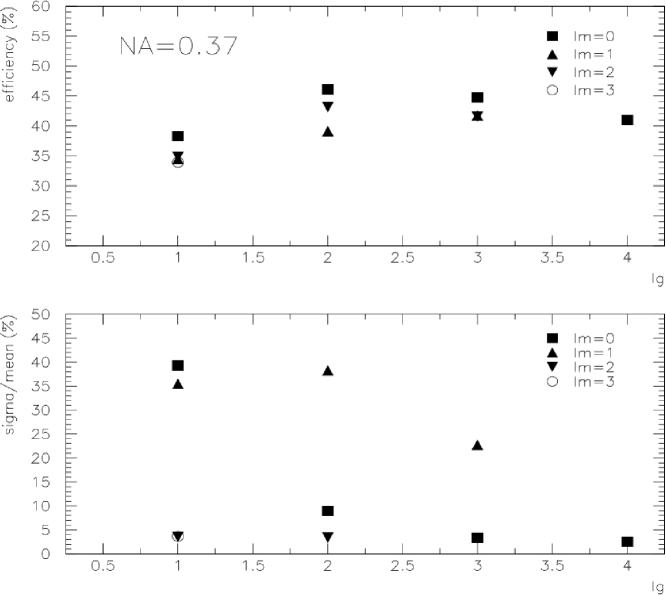
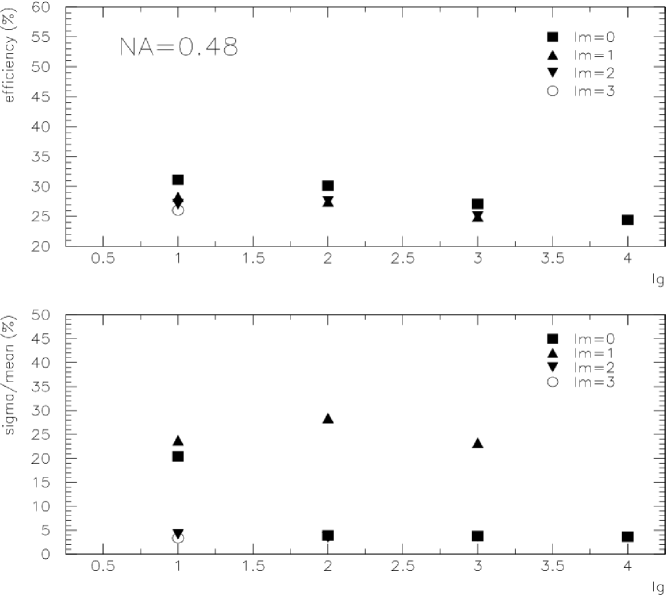
From the tables 1-5 and figures 5 and 6 we note that, as the NA of the fibre and hence the air-entering angle, , increases, the transmission efficiency decreases. Also, the optimum length for the air-core light guide decreases, while the uniformity of the light exiting increases. In order to obtain an optimum efficiency and uniformity of light transmission within the realistically available space, the best option seems = 0 and = 2 for NA = 0.37 and 0.48. A more detailed study of the light guide performances – beyond the scope of our current paper – can be found in reference mavro .
2.3 Light guide reflecting material
The light transmittance in the light-guides was studied for two alternatives for the reflecting medium:
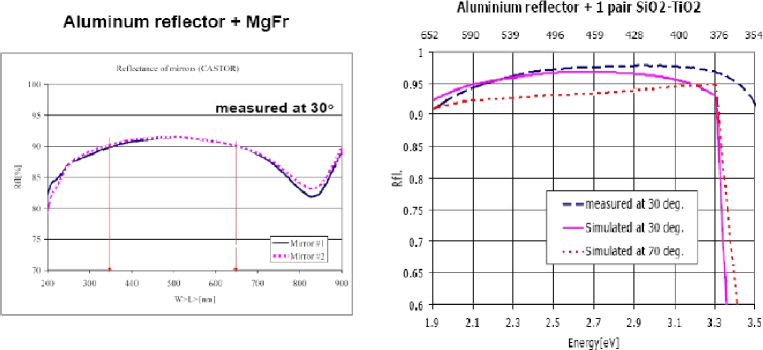
To choose the most suitable reflector, we also have to take into account the quantum efficiency of the photodetector device (see Section 2.4). In Table 6 we calculate the product of the light guide transmittance and Avalanche Photodiodes (APD) quantum efficiency for Q-fibres with NA = 0.37 and 3 internal reflections in the designed light guide. The light output is higher (lower) for the light-guides with reflector-foil (glass-reflector) for wavelengths above (below) = 400 nm. We prefer the HF-reflector solution since the short wavelength Čerenkov light ( 400 nm) deteriorates fast with irradiation of the quartz material and thus a continuous compensation must be applied. The optimum combination of the HF-reflector and the Q-efficiency of the photodetector ensures that the total efficiency is maximized above 400 nm and falls sharply to zero below 400 nm.
| Wavelength | Glass reflector (Al+MgF) | Dupont + Layer stack |
| 650 nm | 62% | 64% |
| 400 nm | 53% | 62% |
| 350 nm | 44% | 7% |
| 300 nm | 10% | 0% |
2.4 Photodetectors
We instrumented the calorimeter prototype with two different types of light-sensing devices:
- 1.
-
2.
Two different types of photomultipliers (PMTs): Hamamatsu R374 and Philips XP2978.
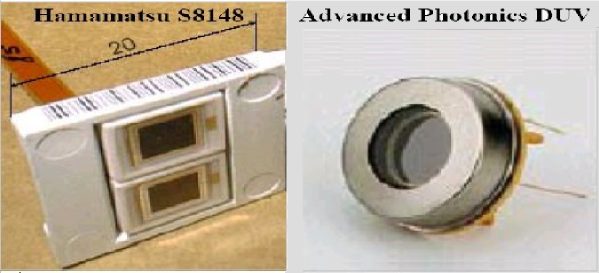
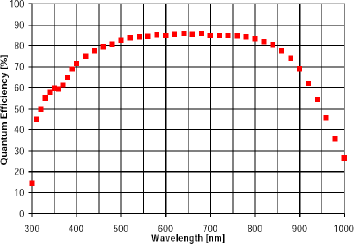
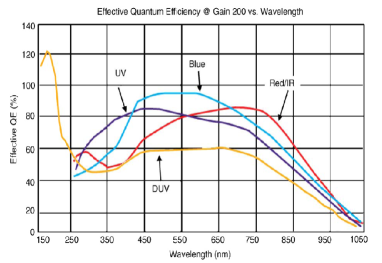
We used 4 Hamamatsu APDs, each 55 mm2, in a 22 matrix with total area of 1 cm2. The Advanced Photonix DUV APD had an active area of 2 cm2 (16 mm diameter). The Hamamatsu and Philips PMTs have both an active area of 3.1 cm2. The Hamamatsu and Advanced Photonix APD quantum efficiencies are shown versus wavelength in Fig. 9.
3 Beam Test Results
The beam test took place in summer 2003 at the H4 beam line of the CERN SPS. The calorimeter prototype was placed on a platform movable with respect to the electron beam in both horizontal and vertical (X,Y) directions. Telescopes of two wire chambers, as well as two crossed finger scintillator counters, positioned in front of the calorimeter, were used to determine the electron impact point. In the next two sections we present the measured calorimeter linearity and resolution as a function of energy and impact point for different prototype configurations.
3.1 Energy Linearity and Resolution
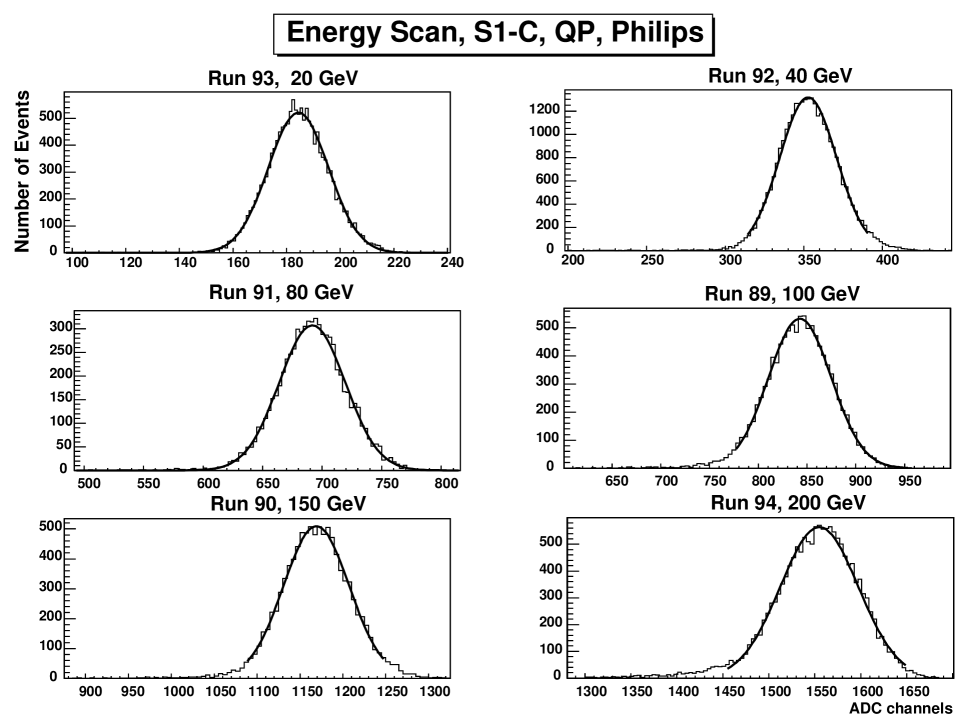
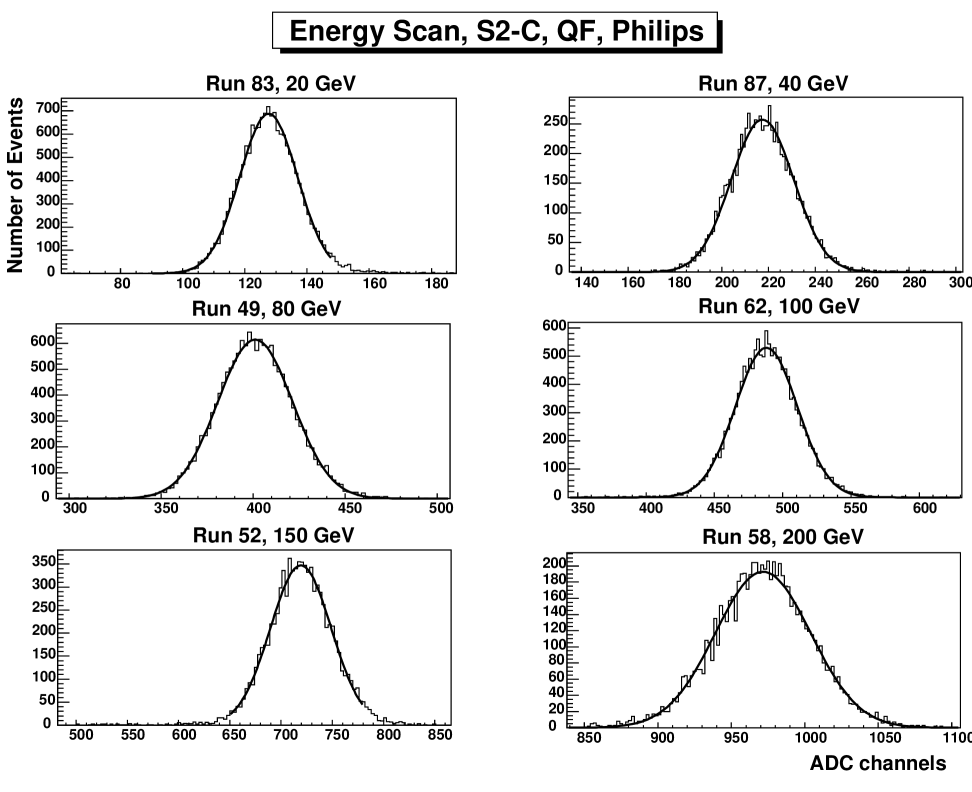
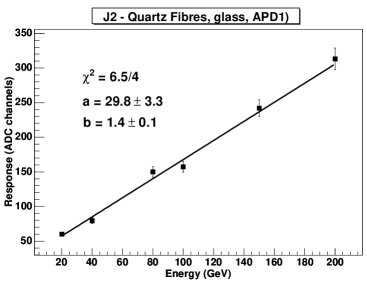
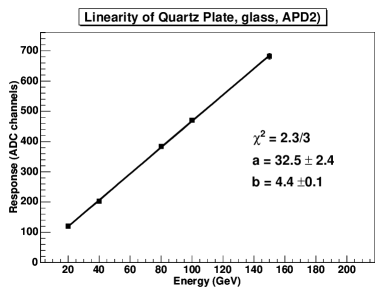
To study the linearity of the calorimeter response and the relative energy resolution as a function of energy, the central points C (Fig. 2) in different azimuthal sectors have been exposed to electron beams of energy 20, 40, 80, 100, 150 and 200 GeV. The results of the energy scanning, analyzed for four calorimeter configurations, are shown in figures 10–13. The distributions of signal amplitudes, after introducing the cuts accounting for the profile of the beam, are symmetric and well fitted by a Gaussian function.
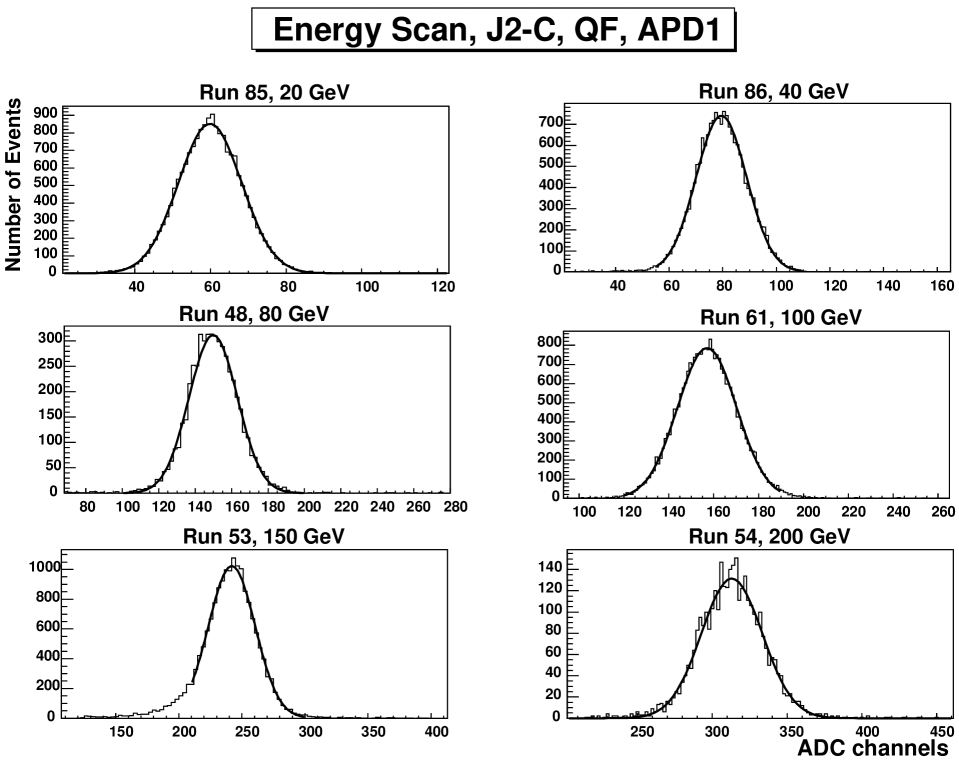
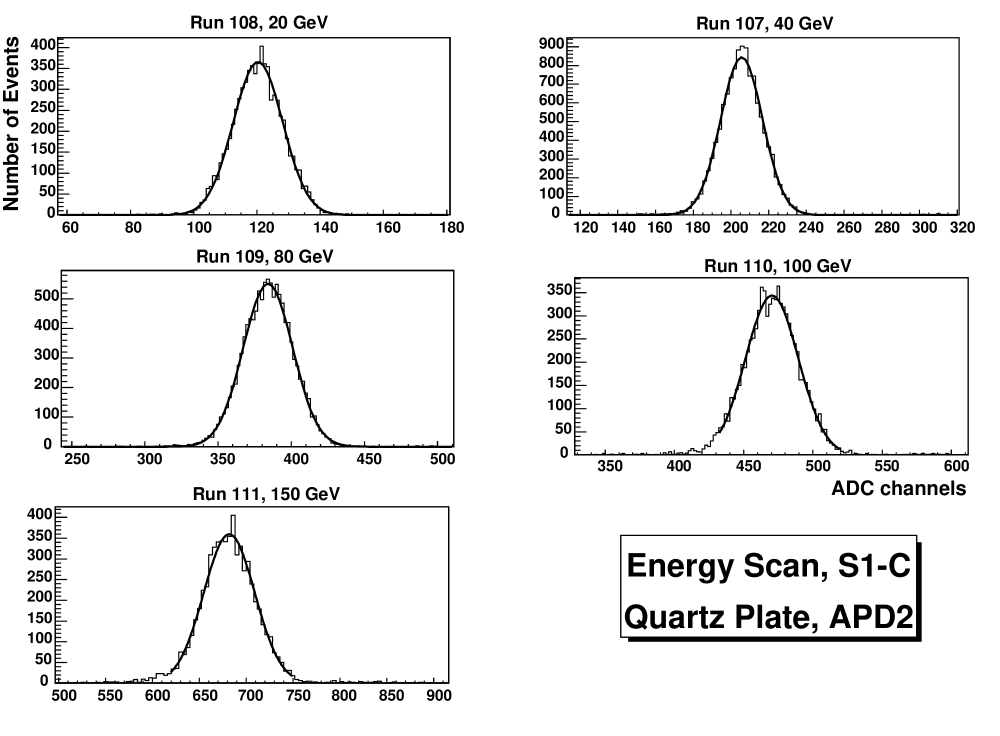
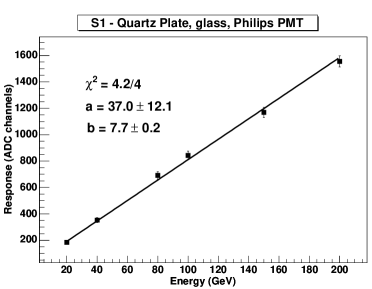
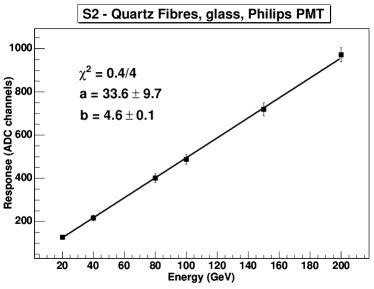
For all configurations, the calorimeter response is found to be linear in the energy range explored (see Fig. 14). The average signal amplitude, expressed in units of ADC channels, can be satisfactorily fitted by the following formula:
| (1) |
where the energy is in GeV. The fitted values of the parameters for each configuration are shown in Fig. 14 and are tabulated in Table 7. The values of the intercept ’a’ are consistent with the position of the ADC pedestal values measured for the various configurations considered: 36.1 0.3 (S1-Quartz Plate), 38.4 1.8 (S2-Quartz Fibres), 35.3 1.5 (J2-Quartz Fibres, glass reflector), 35.4 0.6 (J1-Quartz Fibres, foil reflector).
The relative energy resolution of the calorimeter has been studied by plotting the normalized width of the Gaussian signal amplitudes (Figs. 10– 13), , with respect to the incident beam electron energy, E (GeV) and fitting the data points with two different functional forms resolution :
| (2) | |||||
| (3) |
where the indicates that the terms have been added in quadrature. In expression (3), three terms determine the energy resolution:
-
1.
The constant term , coming from the gain variation with changing voltage and temperature, limits the resolution at high energies.
-
2.
The dominant stochastic term , due to intrinsic shower photon statistics.
-
3.
The noise term, which contains the noise contribution from capacitance and dark current.
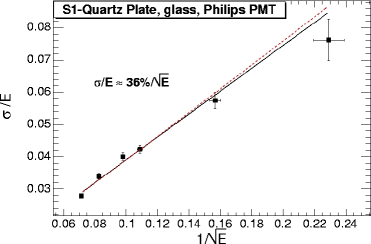
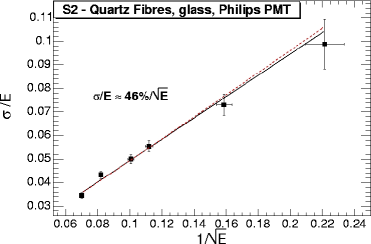
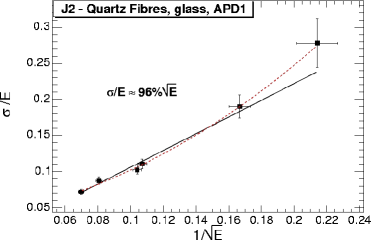
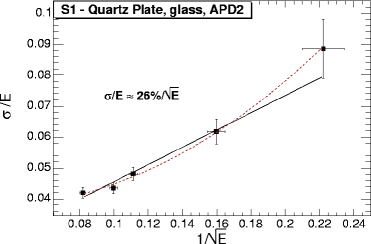
Generally, both formulae satisfactorily fit the data (Fig. 15). The fit parameters are shown in Table 7. The first thing to notice is that the constant term is close to 0 for all options. The average stochastic term is in the range 26% – 96% and indicates that we can measure the total Pb+Pb electromagnetic energy deposited in CASTOR at LHC energies ( 40 TeV, according to hijing hijing ) with a resolution around 1%. The readout by avalanche photodiodes leads to the term, measured to be 1.25 GeV and 4.5 GeV for Advanced Photonix APD and Hamamatsu APD, respectively. It should be noted that the APDs are very sensitive to both voltage and temperature changes, but in this test there was no such stabilization. In Table 7 we summarize the fit parameters for both parameterizations and for the four considered configurations.
| Resolution | Linearity | |||||||
| fit | ndf | ndf | ||||||
| (GeV1/2) | (GeV) | (GeV-1) | ||||||
| Quartz Plate (S1, glass) | ||||||||
| Philips PMT | (1) | 0.004 0.002 | 0.36 0.02 | 6.4/4 | 37. 12. | 7.7 0.2 | 4.2/4 | |
| (2) | 0.010 0.004 | 0.38 0.02 | 0.0 0.4 | 7.4/3 | ||||
| Adv. Photonix APD | (1) | 0.017 0.005 | 0.28 0.04 | 2.5/3 | 32.5 2.4 | 4.4 0.1 | 2.2/3 | |
| (2) | 0.036 0.006 | 0.24 0.04 | 1.2 0.2 | 6.2/2 | ||||
| Quartz Fibres (S2, glass) | ||||||||
| Philips PMT | (1) | 0.004 0.003 | 0.45 0.04 | 3.2/4 | 33.6 9.7 | 4.6 0.1 | 0.41/4 | |
| (2) | 0.013 0.006 | 0.48 0.02 | 0.0 0.8 | 3.7/3 | ||||
| Quartz Fibres (J2, glass) | ||||||||
| Adv. Photonix APD | (1) | -0.01 0.01 | 1.16 0.13 | 4.1/4 | 29.8 3.3 | 1.4 0.1 | 6.5/4 | |
| (2) | 0.04 0.02 | 0.82 0.22 | 4.5 1.6 | 1.3/3 | ||||
3.2 Area scanning
The purpose of the area scanning was to check the uniformity of the calorimeter response, affected by electrons hitting points at different places on the sector area, as well as to assess the amount of “edge effects” and lateral leakage from the calorimeter, leading to cross-talk between neighbouring sectors.
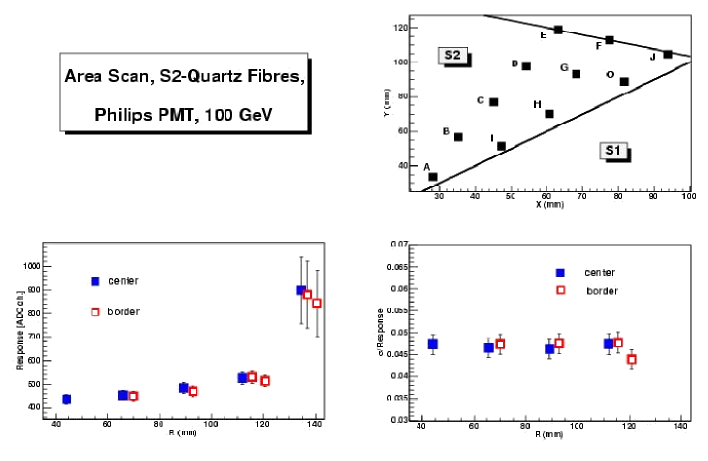
For the area scanning of sector S2, connected to the Philips PMT, central points (A-E) as well as border points (I-O) have been exposed to electron beam of energy 100 GeV (see Fig. 2). The distributions are symmetric and well described by Gaussian fits for the majority of the points. Asymmetric distributions are seen only for points closer than 3 mm to the calorimeter outer edge or sector border.
Figure 16 shows the calorimeter response and relative resolution () as a function of the distance from the calorimeter center, for both central and border points. The top plot shows the coordinates of the points, corrected for the beam impact point position. It can be seen that points E, F, J practically lie at the upper edge of the calorimeter. The rise of the signal amplitudes (bottom left), as well as of the distribution widths with R can be attributed to a lateral spread of the beam. For large , a substantial part of the electron beam is outside of the calorimeter sector and falls directly onto the light guides. The bottom right plot shows that the energy resolution is 4.7% for 100 GeV electrons and is relatively independent of the position of the impact points.
3.2.1 S1 - S2 cross talk
Ten points, located at distances 2.5-32. mm from the S1/S2 sector border, have been exposed to the electron beam of energy 80 GeV. The simultaneous readout of both sectors has been done by Advanced Photonix APD and Hamamatsu PMT in S1 and S2, respectively. The upper left pad of Figure 17 shows the coordinates of the measured points in the calorimeter frame, corrected for the beam impact point position. The star symbol marks the coordinates of the border point between S1 and S2 sectors, found from the dependence of the signal amplitudes on X(Y) coordinates (lower pads).
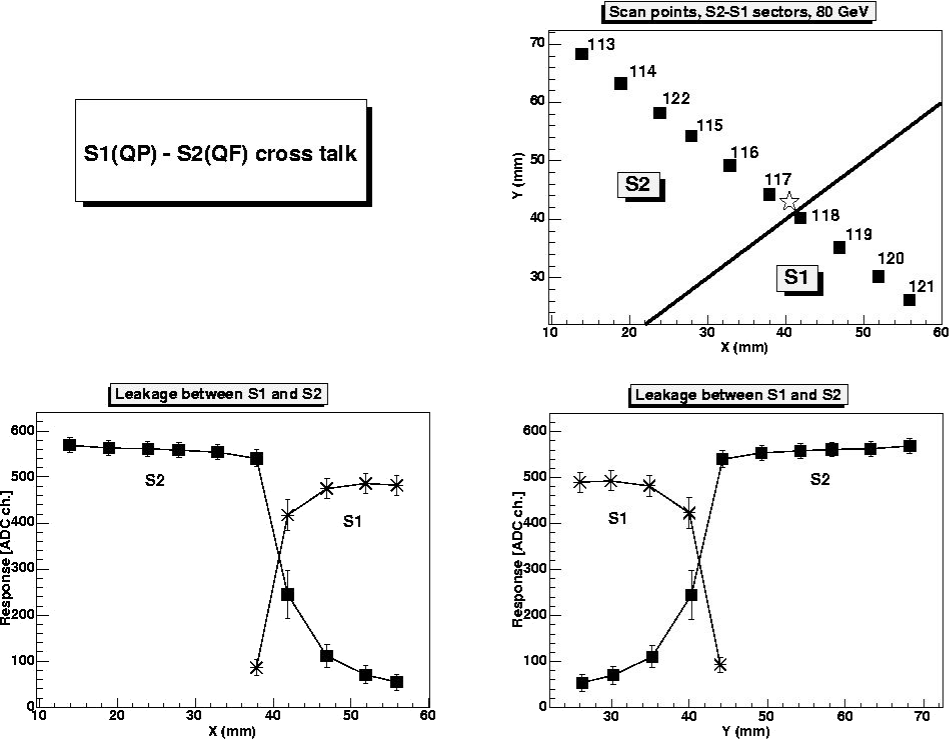
The distributions of the signal amplitudes in S2 sector, for points distanced from the sector border more than 8 mm, are symmetric (Gaussian) and leakage to S1 sector is negligible. The relative energy resolution is of the order 2.9% for 80 GeV electrons.
The dependence of the calorimeter response, leakage fraction and relative energy resolution, /response, on the distance from the sector border, for S1 and S2 sectors are shown in Figure 18.
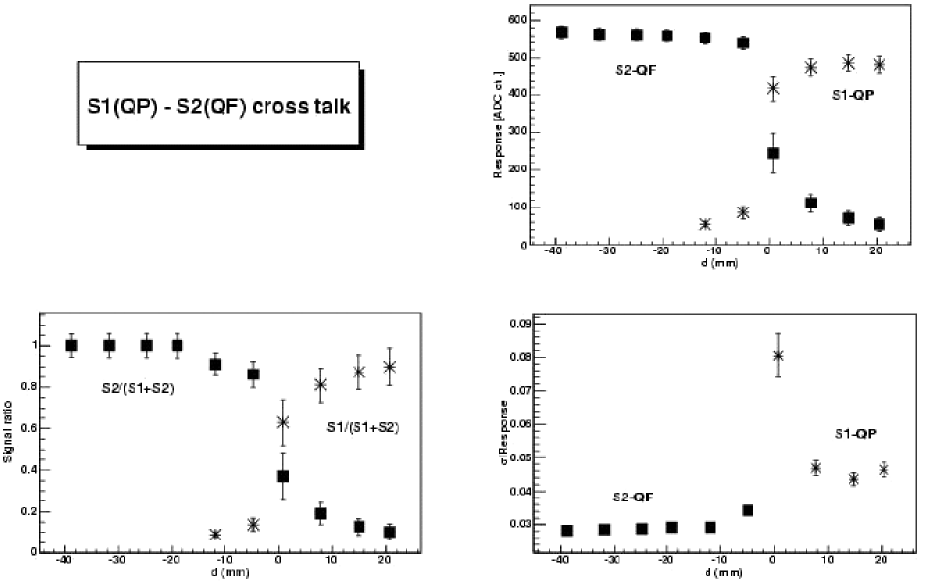
Both the light output and energy resolution are a little better for S2 sector, connected to Hamamatsu PMT ( 2.9%), than for S1 sector, connected to Advanced Photonix APD ( 4.5%). This is expected since there is more light collected by the PMT as compared to the APD: area(PMT)/area(APD) = 1.55.
3.2.2 Comparison of J1, J2 and S1 sectors
For comparison of the uniformity of calorimeter response, several points located at different places on the sectors have been exposed to the electron beam of 80 GeV energy. The points (A-E) at the middle of J1, J2 and S1 sectors and points (4-8) at the border of S1 sector have been studied (see Figure 2). All sectors have been connected to Hamamatsu PMT. Gaussian distributions of signal amplitudes in the middle of the sectors and asymmetric distributions close to the sector border (points 4-8) and sometimes also close to the inner (point A) and outer (point E) calorimeter edge in J1 sector are observed. The beam profile correction (aiming at selecting the central core of the impinging beam) reduces the asymmetry.
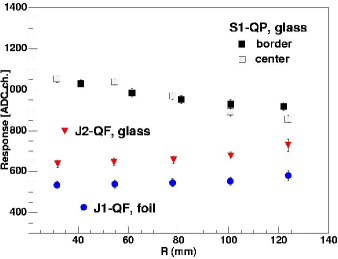
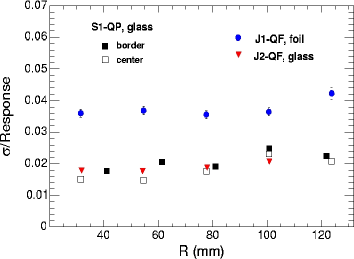
Comparison of light output and relative energy resolution for all options studied is shown in Figure 19. Light output is highest in the S1 (QP-glass) sector and it is practically the same for the central and border points. It depends weakly on the distance of the impact point. For S1, a weak decrease and for J1 and J2 sectors a weak increase of the calorimeter response with distance R from the calorimeter center are observed. The relative energy resolution is almost independent of the position of the impact point and it is 1.5-2.5 % for S1 (QP-glass) and J2 (QF-glass) sectors and 3.5-4.0 % for J2 (QF-foil) for 80 GeV electrons.
4 Summary
We have presented a comparative study of the performances of the first prototype of the CASTOR quartz-tungsten calorimeter of the CMS experiment using different detector configurations. geant-based MC simulations have been employed to determine the Čerenkov light efficiency of different types of air-core light guides and reflectors. Different sectors of the calorimeter have been setup with various quartz active materials and with different photodetector devices (PMTs, APDs). Electron beam tests, carried out at CERN SPS in 2003, have been used to analyze the calorimeter linearity and resolution as a function of energy and impact point. The main results obtained can be summarized as follows:
-
1. Comparison between the calorimeter response using a single quartz plate or using a quartz-fibre bundle indicates that:
-
(a) Good energy linearity is observed for both active medium options (Fig. 14).
-
(b) The Q-plate gives more light output than equal thickness Q-fibres (Fig. 19).
-
2. Avalanche-photodiodes (APDs) appear to be a working option for the photodetectors, although they still need more investigation (radiation-hardness, cooling and voltage stabilization tests).
-
3. The relative energy resolution is weakly dependent on the position of the impact point (Fig. 19). Leakage (cross-talk) between sectors is negligible for impact points separated more than 8 mm from the sector border. Only, electrons impinging less than 3 mm from the detector edge show a degraded energy response and worse resolution.
-
4. The shape of the light guide is determined by tree parameters: (i) the type of quartz fiber (NA number), (ii) the maximum efficiency and uniformity of response, and (iii) the available space for the size of a calorimeter. The aim is to simultaneously achieve optimum efficiency and uniformity of light transmission within the realistically available space. From the analysis of the MC simulations we come to the conclusion that the above requirements are best satisfied with = 0 and = 2 for NA = 0.37 and 0.48.
-
5. The light output is a little higher for the light-guides with glass reflector compared to those that use HF-foil, for the same photodetector (Hamamatsu PMT, Fig. 19). This is understood, since the HF reflecting foil is designed to cut Čerenkov light with 400 nm, where the light output is greater. However, the HF-reflector foil has higher efficiency in the region 400 nm than the glass mirror (Table 6).
In summary, this study suggests that equipping the CASTOR calorimeter with quartz-plates as active material, APDs as photodetector devices (with temperature and voltage stabilization), and light-guides with foil reflector is a promising option, although the final configuration would benefit from further (detailed) investigation to take into account the experimental conditions that will be encountered in the forward rapidity region of CMS. A beam test of the second prototype was carried out in 2004 and the results are reported elsewhere bt-2004 .
5 Acknowledgments
We wish to thank R. Wigmans and N. Akchurin for assistance in the early stage of the beam test. This work is supported in part by the Secretariat for Research of the University of Athens and the Polish State Committee for Scientific Research (KBN) SPUB-M nr. 620/E-77/SPB/CERN/P-03/DWM 51/2004-2006. D.d’E. acknowledges support from the 6th EU Framework Programme (contract MEIF-CT-2005-025073).
References
- (1) A.L.S. Angelis and A.D. Panagiotou, J. Phys. G 23 2069 (1997); A.L.S. Angelis et al., hep-ex/9901038; A.L.S. Angelis et al., Nucl. Phys. Proc. Suppl. 97 227 (2001).
- (2) D. d’Enterria (ed.) et al. [CMS Collaboration], “High Density QCD with Heavy-Ions. CMS Physics Technical Design Report”, [CERN-LHCC 2007-009], J. Phys. G 34 2307 (2007)
- (3) M. Albrow et al. [CMS and TOTEM Collaborations], “Prospects for Diffractive and Forward Physics at the LHC”, CERN/LHCC 2006-039/G-124, http://cdsweb.cern.ch/record/1005180
- (4) M. Gyulassy and X.-N. Wang, Phys. Rev. D44, 3501 (1991); Comp. Phys. Comm. 83, 307 (1994).
- (5) E. Gladysz-Dziadus, Phys. Part. Nucl. 34, 285 (2003), hep-ph/0111163, and refs. therein.
- (6) A.D. Panagiotou, CMS-CPT Week, PRS-HI meeting, November, 2003; and CMS-HF meeting, CMS Week, Sept., 2003, CERN. See http://cmsdoc.cern.ch/castor/Talks/Talks.html
- (7) E. Gladysz-Dziadus, Institute Nuclear Physics, Krakow, Report # 1942 PH-2004. http://www.ifj.edu.pl/publ/reports/2004/1942.pdf
- (8) G. Mavromanolakis, A.L.S. Angelis, A.D. Panagiotou, ALICE/CAS-2000-27. See https://edms.cern.ch/document/249724/1
- (9) K. Deiters et al., Nucl. Instr. and Meth. A 461 574 (2001);
- (10) G. Anzivino et al., Nucl. Instr. Meth. A357 369 (1995); M. Livan, V. Vercesi and R. Wigmans, “Scintillating-bre calorimetry”, CERN 95-02 (1995).
- (11) P. Katsas et al., Eur. Phys. J. C 52 495 (2007).