The narrow-line region of narrow-line and broad-line type 1 Active Galactic Nuclei I. A zone of avoidance in density
Abstract
The properties of narrow-line Seyfert 1 (NLS1) galaxies, the links and correlations between them, and the physics behind them, are still not well understood. Apart from accretion rates and black hole masses, density and outflows were speculated to be among the main drivers of the NLS1 phenomenon. Here, we utilize the diagnostic power of the [S II] intensity ratio to measure the density of the narrow-line region (NLR) systematically and homogeneously for a large sample of NLS1 galaxies, and we perform a comparison with a sample of broad-line type 1 Active Galactic Nuclei (AGN). We report the discovery of a ’zone of avoidance’ in density in the sense that AGN with broad lines (FWHM(H) 2000 km s-1) avoid low densities, while NLS1 galaxies show a wider distribution in the NLR density, including a significant number of objects with low densities. A correlation analysis further shows that the Eddington ratio anti-correlates with density. We investigate a number of different models for the ’zone of avoidance’ in density. Supersolar metallicities and temperature effects, a strong starburst contribution in NLS1 galaxies, different NLR extents and selective obscuration are considered unlikely. Possible differences in the fraction of matter-bounded clouds and differences in the interstellar media of the host galaxies of NLS1 galaxies and broad-line Seyfert 1 (BLS1) galaxies can only be tested further with future observations. We tentatively favor the effects of winds/outflows, stronger in NLS1 galaxies than in BLS1 galaxies, to explain the observations.
1 Introduction
Optical and X-ray observations over the past few decades revealed a new sub-class of AGN, termed Narrow-line Seyfert 1 (NLS1) galaxies (e.g., Gaskell 1984; Osterbrock & Pogge 1985). NLS1 galaxies are intriguing due to their extreme emission line and continuum properties. Their optical broad lines are narrower (FWHM H 2000 km s-1) than in ‘normal’ broad-line Seyfert 1 (BLS1) galaxies and they show strong Fe II emission. Their X-ray spectra are sometimes, but not always, very soft (e.g., Zhou et al. 2006, and references therein). Many emission-line and continuum properties of AGN were found to correlate strongly with each other (e.g., Boroson & Green 1992, BG92 hereafter; Wang et al. 1996; Lawrence et al. 1997; Grupe et al. 1999; Vaughan et al. 2001; Xu et al. 2003; Sulentic et al. 2000, 2003; Grupe 2004). The strongest variance, often referred to as ‘Eigenvector 1’ (EV1), is defined by the correlation between the width of the H emission line and the strength of the [O III]/H emission line ratio, and the anti-correlation with the Fe II/H ratio (e.g. BG92). NLS1 galaxies are placed at one extreme end of EV1 parameter space. The most common interpretation is that this regime is goverened by the highest Eddington accretion rates and/or lowest black hole masses (e.g., BG92; Sulentic et al. 2000).
Among other parameters111See Komossa et al. (2006b) for a recent discussion. Briefly speaking, other parameters considered to be, perhaps, relevant in explaining NLS1 properties are orientation (e.g., Osterbrock & Pogge 1985; Puchnarewicz et al. 1992; Collin et al. 2006; Zhang & Wang 2006), the physics behind NLS1’s radio properties (e.g. Komossa et al. 2006b), metallicity (e.g., Mathur 2000; Komossa & Mathur 2001; Nagao et al. 2002; Shemmer & Netzer 2002; Romano et al. 2004; Fields et al. 2005), (ionized) absorption (e.g., Komossa & Meerschweinchen 2000; Gierlinski & Done 2004), and the galaxies’ location on the plane (e.g. Mathur et al. 2001; Wang & Lu 2001; Grupe & Mathur 2004; Botte et al. 2005; Mathur & Grupe 2005; Komossa & Xu 2007), the density of an outflowing wind was firstly speculated to be a prominent driver of EV1 by Lawrence et al. (1997), given the connection of Fe II strength with the presence of low-ionization, blueshifted broad absorption lines, and with blue-asymmetric emission lines. Winds and outflows play a crucial role in understanding the physics and evolution of AGN (e.g., Elvis 2000, Hopkins et al. 2005), and there is ample observational evidence for winds and outflows in AGN from sub-kpc to galactic scale (see, e.g., Sulentic, Marziani & Dultzin-Hacyan 2000; Veilleux, Cecil, & Bland-Hawthorn 2005, for recent reviews). In enriching the nuclear environment with matter from the central region, winds may have an important impact on the gas densities in the emission-line regions.
Regarding NLS1 galaxies, their high ratios of are likely particularly efficient in driving outflows. The large [O III] 5007 blueshifts observed in some NLS1 galaxies are interpreted straightforwardly as the result of an outflow (e.g., Zamanov et al. 2002; Aoki et al. 2005, Boroson 2005). Dewangan et al. (2001) suggested that stronger outflows would likely push the broad-line region (BLR) further radially outward thereby resulting in narrower H lines in NLS1 galaxies. They further speculated that the observed flux ratios from the NLR and BLR can be explained in terms of density enhancements (see also Wills et al. 2000). Outflows in NLS1 galaxies have been observed in terms of both blueshifted UV absorption lines (e.g., Laor et al. 1997a,b; Goodrich 2000) and UV emission lines (e.g., Leighly & Moore 2004).
Regarding the density of the emission-line regions of NLS1 galaxies, only few previous estimates exist (e.g., Wills et al. 2000; Kuraszkiewicz et al. 2000; Sulentic, Marziani & Dultzin-Hacyan 2000; Marziani et al. 2001; Bachev et al. 2004). Those which do exist, actually lead to partially conflicting results. While some sample studies (Kuraszkiewicz et al, 2000; Wills et al., 2000; Marziani et al., 2001; Bachev et al., 2004) suggested a high-density BLR in NLS1 galaxies, based on the large Si III] /C III] ratios measured from UV spectra 222One of the alternative explanations is that the carbon has been removed from gas phase by depletion onto dust grains (Crenshaw et al., 2002)., other inquiries favored low density emission-line clouds. Rodriguez-Ardila et al. (2000a) studied the emission-line properties of a sample of Seyfert 1 galaxies, including 7 NLS1 galaxies using optical and near-IR spectroscopy. They found that the typical density of the [S II] emitting zone is lower in NLS1 galaxies than in BLS1 galaxies. Rodriguez-Pascual et al. (1997) tentatively favored a low-density BLR in NLS1 galaxies, inferred from their photoionization modeling of the UV emission lines. Ferland & Persson (1989) derived densities similar to the canonical BLR value in strong Fe II emitters, based on the ratio of the forbidden lines relative to the Ca II triplet. Baskin & Laor (2005) reported that the density of the [O III] 5007 emitting gas in the NLR decreases with steeper observed soft X-ray slope.
In addition, a few individual objects were inspected more closely (Laor et al., 1997b; Leighly & Moore, 2004; Véron-Cetty, Joly & Véron, 2004; Véron-Cetty et al., 2006). In particular, analyses of the high S/N UV spectrum of the prototype NLS1 galaxy, I Zw 1, indicated a high BLR density of 10cm-3 and NLR density of cm-3 (Laor et al., 1997b). Véron-Cetty, Joly & Véron (2004) found on the same object from optical spectroscopy that the density of the low-ionization part of the NLR is of the order of 10cm-3.
Given that few systematic measurements exist at all, and that those which do produce partially conflicting results, it is important to explore this topic further. We present for the first time a study of the NLR density for one of the largest homogeneously analyzed NLS1 samples to date and compare it with that of BLS1 galaxies. The electron density of the NLR can be measured by making use of the density-sensitive line ratios [O II] and [S II] (e.g., Osterbrock 1989). In practice, the most important density diagnostic is the [S II] line ratio. Usually the density can not be directly inferred from the [O II] line ratio because the [O II] doublet is often unresolved. More indirectly, other line ratios will also change with density. For instance, a higher-density NLR would strongly boost the [O I] 6300 line, thus the intensity of [O I] can be used to probe higher density regions (e.g., Komossa & Schulz 1997; Barth et al. 2001).
This work is part of a series of papers investigating the properties of the emission-line regions of type 1 AGN, including NLS1 galaxies and BLS1 galaxies. In this first paper of the series, we focus on topics related to density. Specifically, we attempt to answer the following key questions: (1) is there any difference in the NLR density between NLS1 galaxies and BLS1 galaxies? (2) If so, do trends in density correlate with other parameters? and (3) what are the key physical drivers to explain differences in the NLR of NLS1 galaxies and BLS1 galaxies?
This paper is organized as follows. We present the data base and the sample selection in Sect. 2. In Sect. 3, we describe our method of the optical spectral analysis. The sample classification and an investigation of selection effects is provided in Sect. 4. The key result, the detection of a ’zone of avoidance’ in the NLR density, is reported in Sect. 5. In Sect. 6 we discuss the reality of the zone of avoidance, followed by a discussion on its origin in Sect. 7. We summarize our conclusions in Sect. 8.
We use the terms NLS1 galaxies and BLS1 galaxies collectively for high-luminosity and low-luminosity objects, i.e., NLS1 galaxies for narrow-line type 1 quasars and for narrow-line type 1 Seyfert galaxies, and BLS1 galaxies for broad-line type 1 quasars and for broad-line type 1 Seyfert galaxies, respectively. Throughout this paper, a cosmology with km s-1 Mpc-1, and is adopted.
2 Sample selection
The combination of X-ray and optical observations has proven to be an efficient way in detecting NLS1 galaxies over the last decades (e.g., see Pogge 2000 and Véron-Cetty, Véron & Gonçalves 2001, hereafter VVG01, for reviews). The uniform optical spectroscopic galaxy survey known as the Sloan Digital Sky Survey (SDSS, York et al. 2000) is an excellent data base which enables us to study AGN properties and, in particular, optical emission line properties in a homogeneous way.
In this paper, in order to measure NLR densities, we homogeneously analyze and compare optical emission line properties of a large number of NLS1 galaxies with BLS1 galaxies based on spectra obtained in the course of the SDSS. We use the 3rd data release, DR3 (Abazajian et al., 2005). The DR3 spectroscopic program covers an area of about 4188 deg2. The two double spectrographs produce data covering a wavelength range 3800–9200Å at a spectral resolution . Exposure times for spectroscopy are determined such that a signal-to-noise (S/N) of at least 4 pixel-1 at is reached. The SDSS spectroscopic pipeline (Stoughton et al. 2002) performs spectral extraction, sky subtraction, removal of the atmospheric absorption bands, wavelength and flux calibration, and estimates the error spectrum. The processed DR3 spectra have not been corrected for Galactic extinction, but spectrophotometric calibration has been considerably improved since the First Data Release (DR1). We refer the reader to Abazajian et al. (2005) for details of the changes.
2.1 The NLS1 sample
First, we extracted all NLS1 galaxies included in the the 11th edition of the ”Catalogue of Quasars and AGN” (Véron-Cetty & Véron 2003; VV03 hereafter.). The defining criterion of NLS1 galaxies in VV03 is FWHM(H) 2000 km s-1. We further take into account only NLS1 galaxies with redshift less than 0.3. The redshift cut is imposed to ensure that [S II] 6716,6731 is observable, and furthermore, to ensure that the doublet is in a region free of noise from strong night-sky emission lines. The list of 309 selected NLS1 galaxies was then cross-correlated with the SDSS DR3, in order to obtain a homogeneous set of spectra of a large sample of NLS1 galaxies for uniform spectral analyses. This procedure resulted in the selection of 119 sources. In order to get an accurate density measurement, we require [S II] 6716,6731 to have S/N greater than 5. We also removed a handful of objects with spectral defects (e.g. problems with sky subtraction, or missing signal over a range of wavelengths; see Strateva et al. 2003) by visual inspection. This leaves a total of 58 objects.
2.2 The BLS1 sample
Recently, Boroson (2003) presented a sample of 107 low-redshift (redshift ) type 1 AGN from the SDSS Early Data Release (EDR, Stoughton et al. 2002)333We do not divide the Seyfert 1 class into subclasses such as Seyfert 1.5-1.9 (as defined by Osterbrock & Pogge (1985)), since the definitions of Seyfert classifications depend on the resolution of the spectra used and the noise in the spectra (Grupe et al., 1999; Goodrich, 1989).. 82 out of these objects match our redshift constraint, i.e., . We use this sample to build the control BLS1 sample imposing the same redshift cut and S/N limit of [S II] 6716,6731 (i.e., and S/N ) as to the NLS1 sample. The processed DR3 spectra were downloaded for spectral inspection in accordance with the data set of the NLS1 sample. With these restrictions, 48 objects survive, 13 of which overlap with the NLS1 sample.
3 Spectral Analysis
The optical emission-line properties (line widths and line ratios) are among the defining criteria of the NLS1 phenomenon. The exact and homogeneous measurements of the emission-line parameters of AGN provide us with basic knowledge about emission-line regions, and enable us to investigate the relationship between NLS1 galaxies and BLS1 galaxies. However, the published data were compiled in a heterogeneous way. The use of different line profiles (e.g., Lorentzian vs Gaussian profiles) leads to strong differences in the H widths (e.g., VVG01). In addition to the Lorentzian and Gaussian representations of line profiles, a direct measurement of the width at half of their maximum intensity is sometimes adopted (e.g., Williams, Pogge & Mathur 2002; Boroson et al. 2003). Also, the strong Fe II contamination makes it difficult to measure H and brings large uncertainties in determining the H line width.
Here we perform a homogeneous spectral analysis for the NLS1 and BLS1 samples. The objects are then re-grouped into the NLS1 or BLS1 sample for further investigation, according to the widths of the broad H line (Sect. 3.2) obtained in our spectral analysis.
In a first step, the SDSS spectra were corrected for the Galactic extinction using the reddening map of Schlegel et al. (1998), and then shifted to their rest wavelength, adopting the SDSS value of the redshift from the header of each spectrum. Once these steps were completed, we removed the stellar continuum, subtracted the Fe II complexes and performed the spectral analysis for the emission lines following the procedures described below.
3.1 Subtraction of starlight and nuclear continuum
SDSS spectra are acquired with a pair of fiber-fed spectrographs. Each fiber subtends a diameter of 3′′, corresponding to kpc at . This aperture is large enough to let through not only the emission from the nucleus, but also a substantial amount of starlight from the host galaxy (e.g., Vanden Berk et al. 2001, Hao et al. 2005). The accurate removal of the stellar contribution is essential to reliably measure the emission-line spectrum, such as the line widths and line strengths. Particularly, the reliable classification of NLS1 galaxies is strongly dependent on the measurement accuracy of the width of the broad H line. Furthermore, in many of the spectra there is a clear contribution from blends of Fe II line emission. Well-studied NLS1 galaxies usually show strong optical Fe II emission features on both the blue and red sides of the H-[O III] complex (e.g., Véron-Cetty & Véron 2003). In order to reliably measure line parameters, we choose those wavelength ranges as pseudo-continuum, which are not affected by prominent emission lines, and then decompose the spectra into the following 4 components (see Zhou et al. 2006 for details):
-
•
A starlight component modeled by 6 synthesized galaxy templates, which were built from the synthetic spectral library of Bruzual & Charlot (2003) using the algorithm of Ensemble Learning for Independent Component Analysis (EL-ICA, Lu et al. 2006). These templates were broadened by convolution with a Gaussian to match the stellar velocity dispersion of the host galaxy.
-
•
A power-law continuum to describe the emission from the active nucleus.
-
•
An Fe II template obtained by Véron-Cetty & Véron (2003). This template covers the wavelengths between 35357534 Å, extending further to both the blue and red wavelength ranges than the Fe II template used in BG92. This makes it more advantageous in modeling the Fe II emission in the SDSS spectra. We assume that Fe II has the same profile as the broad component of H (see the next subsection).
-
•
A Balmer continuum generated in the same way as Dietrich et al. (2003).
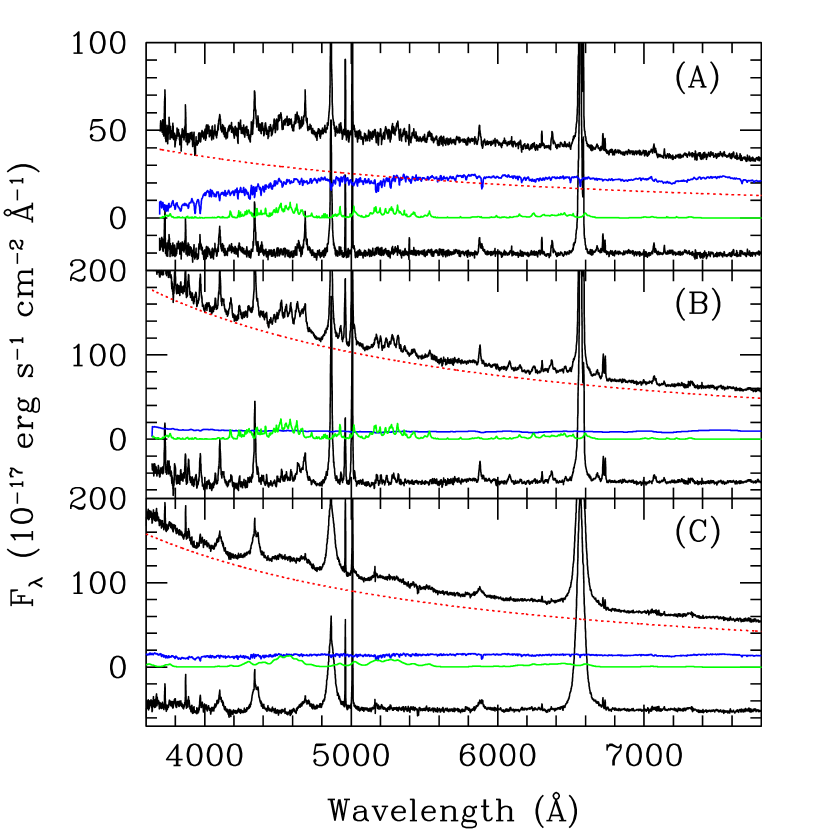
The modeling is performed by minimizing the reduced in the fitting process. The final multi-component fit is then subtracted from the observed spectrum. An example of the residual spectrum is plotted in Fig. 1.
3.2 Decomposition techniques
The multicomponent-subtracted spectra are used to measure the non-Fe II line properties. The broad Balmer lines in AGN exhibit a wide variety of profile shapes and a large range in width (Osterbrock & Shuder, 1982; de Robertis, 1985; Crenshaw, 1986; Stirpe, 1991; Miller et al., 1992; Véron-Cetty, Véron & Gonçalves, 2001), and they are often strongly asymmetric (Corbin, 1995). In many cases the Balmer lines are mixtures of broad and narrow components. Differences in the relative strengths of these components account for much of the diversity of broad line profiles (Francis et al., 1992; Wills et al., 1993; Brotherton et al., 1994; Corbin, 1995, 1997; Véron-Cetty, Véron & Gonçalves, 2001). A proper decomposition of the NLR and BLR line emission contribution of the Balmer lines is of great importance to address the physical properties of the emission-line regions. Particularly, the width of the broad H profile has significant impact on the reliable classification of a galaxy as a NLS1 galaxy.
In order to measure the parameters of the BLR emission lines, the NLR line emission contribution has to be removed first. Using homogeneous sets of spectra, previous studies (e.g., Filippenko & Sargent 1988; Ho et al. 1997; Greene & Ho 2004; Zhou et al. 2006) have shown that the narrow Balmer emission profiles are well matched to those of [S II] 6716, 6731. Moreover, the widths of [S II] and [N II] doublets trace the stellar velocity dispersion of galaxy bulges better than that of [O III] within the uncertainties (Greene & Ho 2004). Therefore, we use the strong profiles of [S II] 6716, 6731 (those with S/N 5) as a NLR template profile for the narrow component of the Balmer lines444Occasionally, we also make use of spectra with weak or absent [S II] emission. These are used to measure [O I] (see Sect. 5.3). In such a case, the [O III] profile is used as a substitute for [S II]..
To characterize the NLR emission-line profiles, we fit these lines using Gaussian profiles. Most [S II] 6716,6731 and [N II] 6548,6583 lines can be well fit employing one single Gaussian profile555 Using spatially-resolved HST spectra, Rice et al. (2006) identified both blue and red asymmetries in some [S II] line profiles, which are primarily due to nuclear line-emitting gas, rather than more symmetric emission from the NLR on larger scales.. A large fraction of the [O III] 4959,5007 lines show strongly asymmetric profiles. In those cases, a second component is then added to represent the line wings. When we fit [S II] 6716,6731, [N II] 6548,6583 and [O III] 4959,5007 lines, the separation of the lines of each doublet is fixed to the laboratory value. Each pair is assumed to have the same profile666The line width of each component of the doublet may be slightly different due to stratification in the NLR. However, Rice et al. (2006) found the widths of the two lines differ by less than 3%, which is within the error of the Gaussian fit parameters and hard to discern with data of moderate S/N.. While the flux ratios of the [N II] and [O III] doublets are fixed to the theoretical ratio of , the intensity ratio of the [S II] doublet is measured, and then used to derive the density.
We used the IRAF package SPECFIT (Kriss, 1994) to measure blended lines and separate the NLR from the BLR emission. The actual profile shape of the broad Balmer lines of NLS1 galaxies is still an issue debated. While the broad Balmer line component can be well represented by Gaussian profiles, particularly by a combination of multiple Gaussian components (Rodriguez-Ardila et al., 2000b; Nagao et al., 2002; Xu et al., 2003; Greene & Ho, 2005a, b; Dietrich, Grenshaw & Kraemer, 2005), successful fitting can also be accomplished with a single Lorentzian profile (Leighly, 1999; Véron-Cetty, Véron & Gonçalves, 2001) for some NLS1 galaxies. Véron-Cetty, Véron & Gonçalves (2001) suggested that the broad Balmer lines of NLS1 galaxies were better fitted with a single Lorentzian profile than a single Gaussian profile (see also Sulentic et al. 2002), since many NLS1 galaxies were located in the H II region in their diagnostic diagrams if a single Gaussian profile was adopted. However, as noted in Evans (1988), the choice of Gaussian or Lorentzian profiles as representatives of the observed emission lines may bear no physical meaning. Furthermore, the broad-line profiles show complex shapes and asymmetries that can not be described with a single component, indicating the presence of two or multiple components, independent from the type of profile used to fit (Dietrich, Grenshaw & Kraemer, 2005).
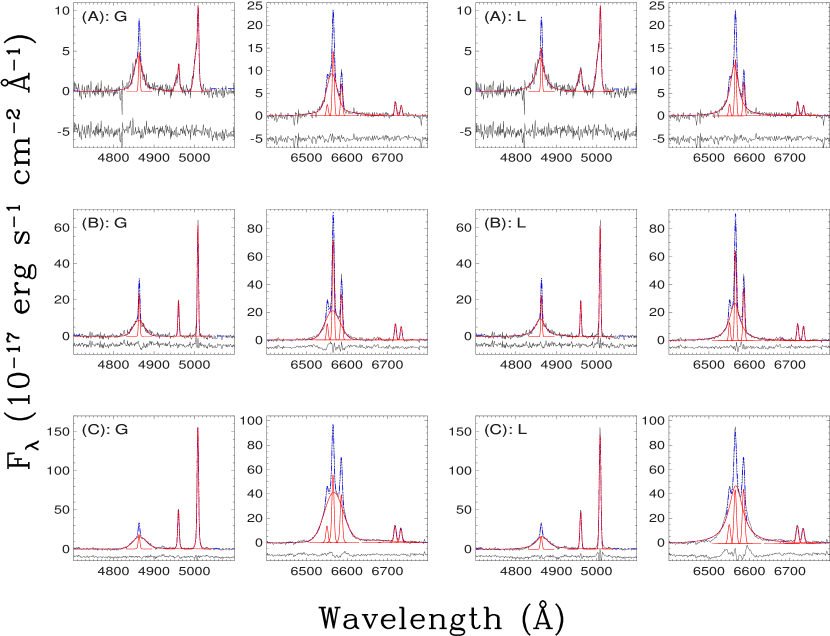
In order to isolate the narrow and broad components of the Balmer lines, we fix the width of the narrow component (determined from the width of [S II] as described above) and only leave its strength as fit parameter. The broad part of the line profiles we fit by using a combination of two Gaussian profiles, as well as a single Lorentzian profile. For the approach with a multi-Gaussian components fit, we measure the FWHM of the profile and its integrated flux from the final combined model for the broad component. The individual Gaussian components have no physical significance by themselves but are only used to serve as a description of the complex line shapes of the broad components as far as the data quality allows. While comparable and equally reasonable results can be achieved with both single Lorentzian and two Gaussian profiles for most broad components of the Balmer lines of NLS1 galaxies, generally no acceptable fit is possible when employing the Lorentzian profiles to fit BLS1 galaxies. We will use the results of the multiple Gaussian fit for NLS1 galaxies for classification and further correlation analysis, for its simplicity, and furthermore, for a direct comparison with the BLS1 control sample and with previous studies (e.g. BG92; Grupe et al. 1999; Vaughan et al. 2001). However, for comparison purposes, we still report results from Lorentzian fitting in our key figures (Fig. 5, 6). We further checked the location of NLS1 galaxies and BLS1 galaxies in the diagnostic diagrams using the standard emission-line ratios. In contrast to Fig. 8 of VVG01, most of our NLS1 galaxies locate in the AGN regime for both Gaussian and Lorentzian fits.
The broad component of H is referred as H, and the narrow component as . The dominant uncertainties in the line parameter measurements can result from the continuum subtraction and component decomposition. The latter depends on the line profile shape. Although the line measurements of Gaussian and Lorentzian fits are precise, they are only true estimates if the lines can be correctly represented by the profiles. The average error in the width of narrow lines is of approximately 5%. Errors in the width of broad lines, introduced by the different profile types, e.g., two Gaussians or a single Lorentzian, are about 10%. For most objects, the uncertainties of flux measurements of emission lines are less than 10%. The typical measurement error of the [S II] doublet is about 5% for our sample.
4 Sample re-classification and selection effects
4.1 Re-classification of the sample
In order to follow the standard practice to distinguish between NLS1 galaxies and BLS1 galaxies by FWHM(H), we re-classified the objects of our sample accordingly, after having carefully measured FWHM(H). A total of 55 objects with FWHM(H) km s-1are included in the final NLS1 sample, while 39 with FWHM(H) 2000 km s-1 are included in the BLS1 sample.
4.2 Luminosity and redshift distributions
As described in Sect. 2, we do not set any selection criteria upon our samples, which combines data from various different sources and thus is not statistically complete. It is therefore necessary to examine whether or not the NLS1 and BLS1 samples are drawn from comparative populations such that luminosity effects (in particular, the number of quasars vs Seyferts in each sample) and evolutionary effects can be excluded. In order to check the possible biases between the two samples, we look into the absolute magnitude distribution and the redshift distribution.
First, we investigate whether or not there is a systematic difference in the luminosity distribution between the two samples. Here we trace the luminosity with the absolute magnitude, which is calculated from the _psf magnitude (e.g. Schneider et al. 2005; Vanden Berk et al. 2004), by correcting the measurements for Galactic extinction (Schlegel et al. 1998) and assuming a powerlaw spectral energy distribution (SED) (, where (e.g., Vanden Berk et al. 2001). Following the previous studies of the SDSS AGN (Schneider et al. 2003, 2005; Nagao et al. 2005), we define objects that have luminosities larger than M as quasars. We show the histograms of the absolute magnitudes for the NLS1 galaxies and BLS1 galaxies in Fig. 3. We apply the Kolmogorov-Smirnov (K-S) statistical test to check how closely the distributions resemble each other. The resultant K-S test probability is 0.33, which means the two distributions are statistically indistinguishable.
Secondly, we explore the redshift distribution. The histograms of the sources’ redshifts are shown in Fig. 3. The NLS1 and BLS1 samples possess similar average redshifts. The value and 1 deviations for the two samples are and , respectively. Moreover, since both samples are compiled from low-redshift objects with , no strong redshift bias is expected, anyway. We conclude that our two samples do not show significantly different luminosity and redshift distributions.
4.3 Optical Fe II emission versus [O III] emission
In this section we wish to demonstrate that our (NL)S1 sample follows the same correlations found previously for (NL)S1s as a class, and therefore, that our NLS1 galaxies are representative for the NLS1 population as a whole, as far as previously known correlations are concerned. Among optical emission lines of NLS1 galaxies and BLS1 galaxies, the most striking correlation is the so called EV1 (e.g., BG92; Grupe et al. 1999; Sulentic et al. 2002, 2003; Xu et al. 2003), i.e., that [O III]/H emission is weak in objects with strong Fe II emission and vice versa. NLS1 galaxies are at the extreme end of this correlation, often showing strong Fe II emission and weak [O III]/Htotal emission.
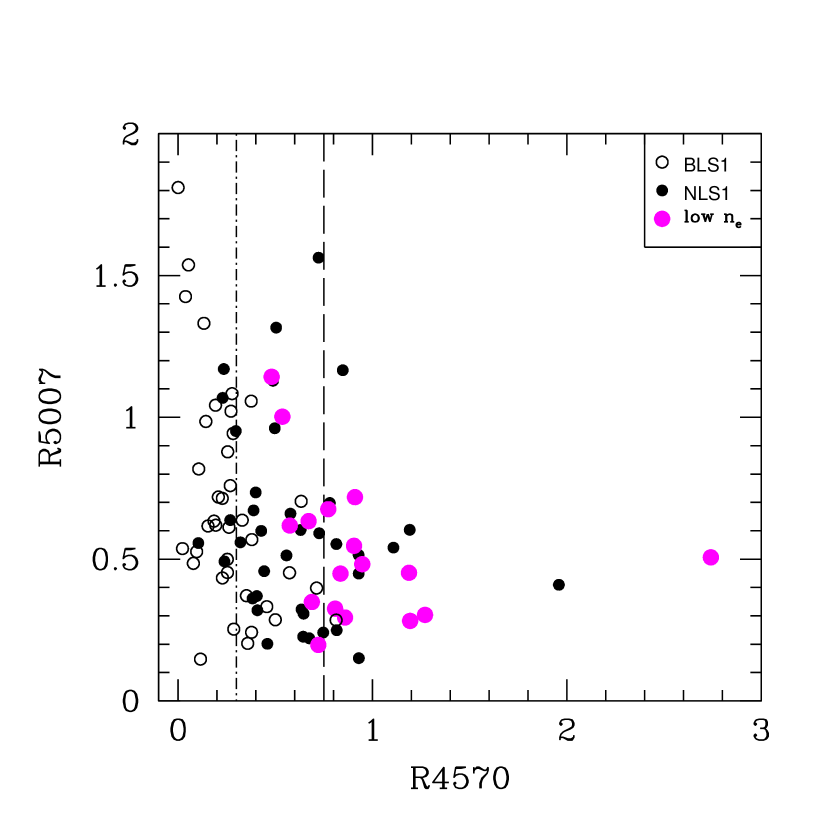
The optical Fe II strength, R4570, is defined as the ratio of the flux of the Fe II complex between the rest wavelength 4434Å and 4684Å to the total H flux, including the narrow component (e.g. BG92, VVG01). The average values of R4570 for our NLS1 and BLS1 samples are 0.75 and 0.30, respectively. The regime of high values of R4570 is solely occupied by NLS1 galaxies. The results are consistent with previous studies (e.g., Rice et al. 2006 and references therein). In Fig. 4, we plot R5007, the ratio of [O III] flux to the total H flux, as a function of R4570. Both emission lines span almost the whole range from the low to high end observed in NLS1 galaxies and BLS1 galaxies (e.g., Fig. 11 in VVG01), suggesting there is no preferential selection effect to objects with extreme properties. Moreover, an anti-correlation between the two parameters is present, with a correlation coefficient r. The probability of the null correlation is P. These quantities are calculated from the Spearman rank-order correlation analysis. Hence, the NLS1 and BLS1 samples under study can be considered as representative samples of these two subclasses, though they are not statistically complete.
5 A zone of avoidance in the NLR density
5.1 Measurement of density
We use the density diagnostic [S II] / to measure the NLR electron density. The electron density is calculated following Osterbrock (1989) using the task temden of the IRAF package STSDAS (Shaw & Dufour, 1994). This approach comes with two limitations. Firstly, around densities of 103–104 cm-3 we approach the critical densities of [S II] ( cm-3) and [S II] ( cm-3). Secondly, the [S II] line ratio also depends on temperature. However, the dependence is only weak in the range of temperatures of the regions studied. We fix the electron temperature at K, typical for photoionized gas in the NLR, and comment on possible temperature effects later. The [S II]-based density measurement allows us to probe the [S II]-emitting part of the NLR. In order to get a first impression also on the high-density part of the NLR, later we make use of the strength of the [O I] line (Sect. 5.3)777We note that the NLR is most likely composed of emission-line clouds with a range in densities (e.g., Komossa & Schulz 1997; Peterson 1997; Rodriguez-Ardila, Pastoriza & Donzelli 2000a; Brinkman et al. 2000), and that NLR density increases toward small radii (e.g., Fraquelli, Storchi-Bergmann & Binette 2000; Bennert et al. 2006a,b)..
The [SII] ratio is only a good density diagnostic in a certain range of densities because depopulation of the upper levels changes from being primarily radiative at low densities to primarily collisional at high densities. The low-density limit is cm-3, while for densities higher than cm-3, collisional de-excitation becomes more and more important. Most of our sources distribute in a regime where the methods are well applicable. In the low-density limit ( cm-3), the error in density is larger due to the saturation of the relation between the line ratio and electron density, so these derived densities should be treated with caution. An [S II] ratio of 1.42 corresponds to a density of cm-3. Only two objects, SDSS J011448.68-002946.1 and SDSS J161809.38+361957.8, have ratios greater than 1.42, which places the sources at the low end in the density distribution.
Notes on individual objects.
Among the whole sample, only objects which are above a certain S/N ratio in the [S II] line were kept for further analysis (Sect. 2). Among these, we then individually re-inspect all objects below a density threshold of cm-3(log cm-3, i.e., those in regime ”A” in Fig. 5) to check for peculiarities in spectral features, and to check the robustness of spectral fitting and thus reliability of the density estimate in the low-density regime.
We comment here on those objects which are extreme in the [S II] ratio, FWHM or other spectral features: (1) There is one single broad-line object actually located in the ’zone of avoidance’ in density. This is SDSS J011448.68-002946.1. While its [S II] ratio is extreme (R([S II])), and within the errors beyond the ’low-density’ regime, its other emission lines are not unusual. The profile of [S II] deviates somewhat from a Gaussian, but there is nothing else very peculiar about it. This is the only outlier in Fig. 5. (2) The low-density NLS1 SDSS J092247.03+512038.0 is peculiar in that the peak of the [O III] line is blueshifted with respect to the low-ionization forbidden lines (e.g., [O II], [N II] and [S II]) and the narrow component of H by more than 400 km s-1. The large velocity shift places it among the [O III] blue outliers (Zamanov et al., 2002). Moreover, [O III] is almost as broad as H (FWHM 1060 km s-1 and 1250 km s-1 for [O III] and H, respectively.), while the low-ionization forbidden lines such as [S II] are narrow (FWHM([S II]) km s-1). It is a strong Fe II emitter with . (3) SDSS J161809.38+361957.8 is the object with the most extreme combination of H line width (FWHM(H) km s-1 for a Lorentzian profile fit) and density ( cm-3). The emission lines have a very wide range of excitation, the highest corresponding to coronal lines of [Fe X] and [Fe XI] . We also detect the broad low-ionization line O I , which is generally produced in a region with very high density (e.g. Komossa & Bade 1999). It is the only low-density source of our sample which has the O I line detected. (4) The low-density NLS1 SDSS J120226.76-012915.3 shows exceptionally strong Fe II emission of . It is the most extreme Fe II emitter in our sample. (5) Finally, we mention that among the high-density sources, the spectrum of the BLS1 SDSS J013527.85-004448.0 is special in that it shows the highest ratio of [O II]/[O III] of the whole sample ([O II]/[O III]) 888More detailed account on multi-wavelength properties and on (unusual) line profiles and line ratios of individual sources will be given in a follow-up paper (Xu et al. 2007, in prep.).
5.2 Density versus FWHM(H): a zone of avoidance
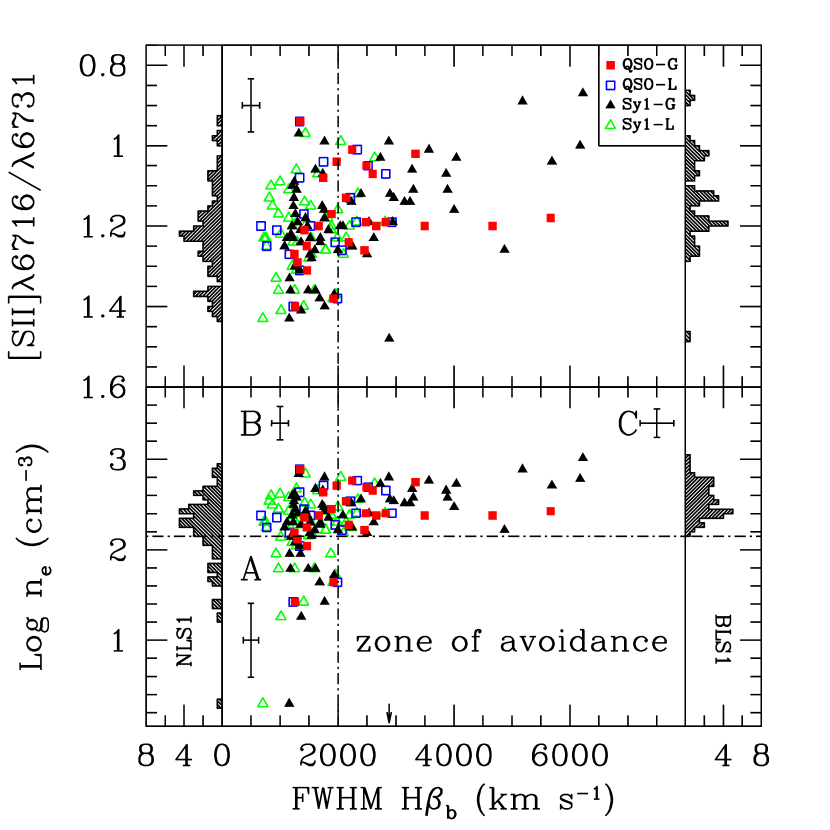
One of our main goals is to examine whether or not there is a difference in electron density between NLS1 galaxies and BLS1 galaxies, in order to test different NLS1 models. The [S II] line ratio in our sample ranges from 0.87 to 1.47. We plot the ratio versus the FWHM of H in Fig. 5. The typical error on the ratio is 0.06. The histograms of the ratios for the NLS1 and BLS1 samples are also shown. NLS1 galaxies show [S II] ratios in the range from 0.94 to 1.43. 17 out of 55 NLS1 galaxies have a ratio higher than 1.28, while only one out of 39 BLS1 galaxies has a high ratio (i.e., 1.47). The other 38 BLS1 galaxies occupy the range from 0.87 to 1.27. The average ratios and 1 deviations of the two samples are and , respectively.
In Fig. 5 (lower panel), we display the inferred electron density against the FWHM of H. We find that the sources do not homogeneously populate the –FWHM(H) diagram. The key detection is a ’zone of avoidance’ in the diagram. While the 38 BLS1 galaxies avoid low average densities, and all show cm-3 (regime C), NLS1 galaxies show a larger scatter in density in the range cm-3, including a significant number of objects with low densities. 17 out of the 55 NLS1 galaxies under study show cm-3 (regime A) and are clearly separated from the range occupied by BLS1 galaxies. The other 38 NLS1 galaxies overlap well with the range in density for BLS1 galaxies (regime B)999Results are robust, no matter whether a Gaussian or Lorentzian profile is used for the broad component of H. A larger scatter, rather than a strict cut-off in density for BLS1 galaxies might appear if the sample size increases significantly, but we expect our findings do still hold on average.. The average electron densities for zone A, B and C are 69, 294 and 380 cm-3, respectively. We apply the K-S statistical test on the distributions of density for NLS1 galaxies vs BLS1 galaxies. The resultant K-S test probability is 0.0002, which means that the two density distributions are significantly different.
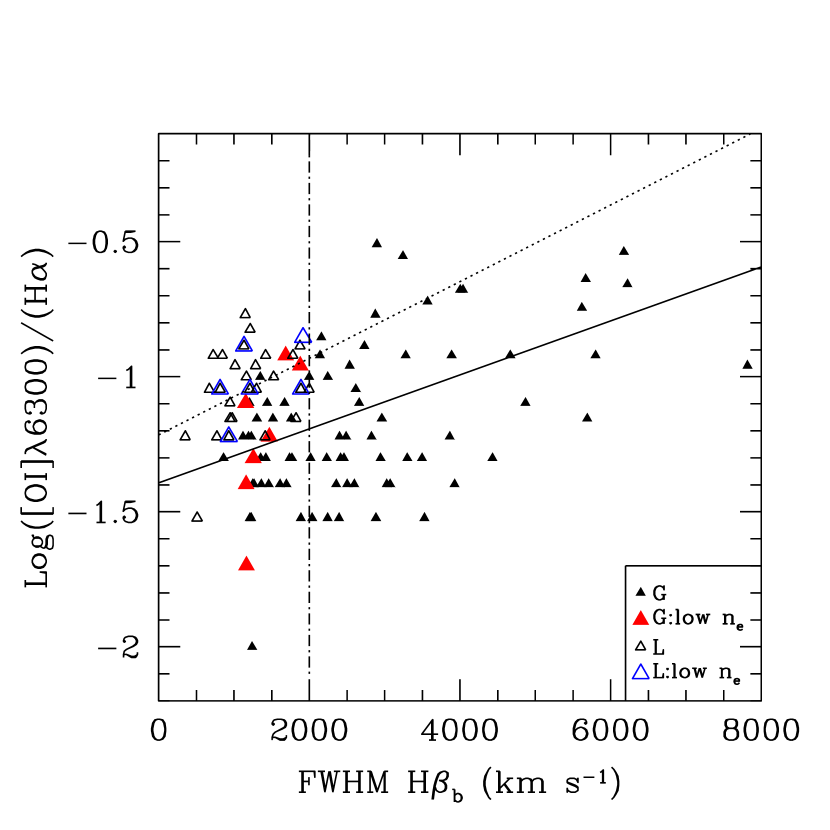
5.3 [O I] emission versus FWHM(H)
In order to probe also the high-density NLR regime, well above the critical densities of the two [S II] lines, we concentrate on the emission line [O I] . Even though the ratio [O I]/H is also influenced by other parameters, [O I] is strongly boosted for high densities (e.g., Fig. 4 and 8 of Komossa & Schulz 1997) and we thus checked for any trends and correlations between [O I] intensity and FWHM(H) (Fig. 6), which we regard as a supplement to the – FWHM(H) diagram (Fig. 5). In Fig. 6, we plot the ratio [O I] /H as a function of the FWHM(H). An anti-correlation between the two parameters is found with a correlation coefficient r, and a probability of the null correlation P, calculated from the Spearman rank-order correlation analysis. The trend meets our expectation from Fig. 5, in the sense that BLS1 galaxies show, on average, higher [O I]/H than NLS1 galaxies.
6 Reality of the zone of avoidance
The sources of our sample do not homogeneously populate the – FWHM(H) diagram, but show a ’zone of avoidance’, in the sense that BLS1 galaxies lack low average NLR densities. Is there any data analysis or selection effect that could cause a spurious zone of avoidance in the BLS1 galaxies regime, or could mimic a larger density scatter in the NLS1 galaxies regime? We discuss and reject several possibilities in turn.
Magnitude distribution.
Firstly, we note that the magnitude distributions of the NLS1 and the BLS1 sample are similar (also in dependence of redshift; Fig. 3). We note that both extremes of the distribution in the – FWHM(H) diagram include both quasars and Seyferts (but more Seyferts, since the total number of Seyferts is higher than the quasars).
Profile shape.
Secondly, our results are robust, independent of the profile the broad emission lines are fit with, either a Lorentzian profile or a combination of two Gaussian profiles (see Fig. 5).
Atmospheric absorption effects.
We then checked whether the density estimate for the small-FWHM regime is more unreliable (thus, a larger scatter) because at a certain redshift range ( 0.130–0.140), the atmospheric O2 absorption line at 7620Å overlaps with one or the other sulfur line, making line estimates more unreliable (even though atmospheric absorption is generally already corrected for the released SDSS spectra).101010The other atmospheric O2 absorption line at 6870Å will not overlap the sulfur lines, given the redshift range 0.034–0.289 of the objects in our sample. In that case, sources in the regime with the larger range in densities (zones A & B in Fig. 5) should have a specific, narrow redshift range. This is not the case, however. The low density objects vary in redshift between 0.034–0.280, while the rest of the sample shows 0.038–0.289.
Signal/Noise.
In order to get an accurate [S II] line ratio and thus density measurement, we required [S II] 6716,6731 to have S/N greater than 5 which is quite a common cut-off imposed on SDSS data. 90% of our spectra are actually of S/N ([S II]) 10. In order to see whether the S/N of our spectra affects in any kind of way our measurement of the [SII] ratio, we have checked whether one class of objects (those with low density) or the other class (with high density) shows an excess of sources with low S/N. However, this is not the case. We have run a Spearman rank-order correlation analysis on the distribution of the [S II] ratio in dependence of S/N, and we do not find any correlation (r, P).
Faint broad wings in the Balmer lines.
In case of very broad Balmer lines, if the broad wings of the line are over- or underestimated, then a corresponding small under- or over-estimate in the [S II] lines might result. The [S II] 6716 line might then be slightly more strongly affected, and that might marginally change the measured [S II] ratio. However, in most of our sources the [SII] lines are well separated from faint broad wings (see Fig. 2)
High and low density limits.
[S II] 6716/6731 is only a good density diagnostic in a certain range of densities. The low-density limit is cm-3, while for densities higher than cm-3, collisional de-excitation becomes more and more important. Most of our sources distribute in a regime where the methods are applicable. Since the conversion of the [S II] ratio into density is non-linear, the estimate of density in the low-density regime (Fig. 5.3 of Osterbrock 1985) comes with larger errors. These are shown in Fig. 5. Within these errors, objects with small FWHM(H) still have, on average, lower densities.
The whole diagram (i.e., across the whole FWHM(H) range), may, to a minor extent, be biased toward excluding very high densities by the original selection effect of using only spectra with significant S/N in the [S II] lines. This pre-selection cannot be avoided. However, since [S II] is collisionally de-excited for densities well above cm-3, the pre-selection criterion then is prone to excluding objects with extremely high densities, should they exist at all.
Influence of temperature.
The estimate of density using the ratio [S II] 6716/6731 also depends on temperature. As described in Sect. 5.1, we fix K. An estimate of the temperature is possible with the temperature-sensitive emission-line ratio [O III] 4363/[O III] 5007. However, [O III] 4363 is a faint line which generally comes with large measurement errors. We have inspected the highest-quality spectra available in the [O III] 4363 wavelength range (high S/N and/or easy deblending of H and [O III]); both, among the lowest density object, and, for comparison, a similar number among the higher density objects. We do not find systematically higher temperatures for the low-density objects. We further note that given the scaling of density with temperature, (Osterbrock, 1989), even an increase in temperature up to 40,000K (close to the average of four Sy1 galaxies of Bennert et al. 2006b), would only change density by a factor of 2, much less than the scatter in the observed density values. We come back to this point in Sect. 7.2.
Starburst contribution.
If there was a strong systematic starburst/H II contribution to the emission lines, then we would expect the density estimates to be biased toward lower values, more typical for H II regions. Since our sample shows unambiguous AGN-like line ratios, we expect the vast majority of the emission to come from the NLR, rather than star-forming regions. We further use the star-forming indicator, [O II] 3727 (e.g, Hippelein et al. 2003; Kewley & Geller 2004; Ho 2005), to track the starburst contribution to the optical emission lines of the AGN of our sample. [O II] 3727 is prominent in H II regions, while the ratio [O II]/[O III] is observed and predicted to be relatively weaker in Seyfert galaxies. We compare the line ratios [O II] 3727/[O III] 5007 of NLS1 galaxies and BLS1 galaxies, in order to check whether or not the [O II] emission is on average stronger in NLS1 galaxies. In Fig. 7 we show the distributions of the ratio prior to reddening correction and after reddening correction111111For dust reddening correction we use the average reddening curve of Osterbrock (1989, his Table 7.2) and an intrinsic value of Hn/H = 3.1.. No difference is present between the [O II]/[O III] ratio for NLS1 galaxies and BLS1 galaxies. Thus, we conclude that the starburst contribution is not a possible explanation for the – FWHM(H) distribution. The average observed [O II]/[O III] ratios for the NLS1 and BLS1 sample are 0.32 and 0.29, while the average reddening corrected ratios are 0.35 and 0.33, respectively.
Spatially resolved NLRs and viewing angle effects.
Finally, we checked whether nearby objects might be spatially resolved, such that the low-density outer part of the NLR is missed in the fiber which would then result in an overestimate of the density in these objects. We find that the fiber diameter of 3′′ corresponds to kpc at (the lowest redshift in our sample), while the gas in the NLR is typically distributed over a distance pc from the nucleus. Therefore, SDSS fibers would always cover the entire NLR.
7 On the origin of the zone of avoidance
The key result of this study is the detection of a zone of avoidance in the density - FWHM(H) diagram (Fig. 5): BLS1 galaxies (FWHM(H) 2000 km s-1) avoid low average densities, and all show cm-3. On the other hand, NLS1 galaxies show a larger scatter in densities in the range cm-3, including a significant number of objects with low densities. The results obtained for [S II] are consistent with the [O I] – FWHM(H) diagram as shown in Fig. 6, which shows lower average [O I]/H in NLS1 galaxies. In the following, we first confront our results on density with predictions or indications on density effects of existing NLS1 models, and then discuss further possibilities.
7.1 Coupling between NLR and BLR?
Given occasional reports of signs of lower or higher-than-average BLR density of NLS1 galaxies (e.g., Kuraszkiewicz et al. 2000; Rodriguez-Ardila et al.2000a; Marziani et al. 2001; Komossa & Mathur 2001; Xu et al. 2003; Bachev et al. 2004) we then also expect the same trend to reflect in the NLR densities – if the properties of NLR and BLR are closely linked121212The exact relation between BLR and NLR in AGN is still under examination. While some models do predict a close link, others assume or indicate that both cloud components are of different and unrelated origin. Models that argue against a common link include indications that NLRs are just normal interstellar medium (ISM) in the host galaxy, while the BLR has separate origin. Also, the fact that the FWHMs of the Balmer lines of BLR and NLR do not generally correlate (e.g., BG92; Grupe et al. 1999; Vaughan et al. 2001; Xu et al. 2003) suggests different kinematic components. On the other hand, there are models and observations that do predict a link, including common wind outflows (e.g., Schiano et al. 1986); the suggestion that the apparent gap between BLR and NLR is solely caused by dust effects (Netzer and Laor 1993); and observational links between BLR and NLR parameters, in particular, between line strength, line asymmetry and the shift of the line centroids (e.g., Xu et al. 2003).. Such models can then be tested by measuring the NLR density. We start with a short review of previous measurements, then come back to our new results.
Few NLS1 galaxies have been studied with respect to the density of their NLR, so far. Rodriguez-Ardila et al. (2000a) reported NLR density measurements of seven NLS1 galaxies, based on the [S II] /[S II] line ratio. They found lower average density in the [S II] emitting zone in NLS1 galaxies than in BLS1 galaxies. Véron-Cetty et al. (2004) presented a high S/N optical spectrum of the NLS1 galaxy I Zw 1 and concluded that the bulk of the NLR is unlike that of most Sy1 galaxies. It is of unusually low excitation and dominated by lines of high critical density, while lines like [O III] 5007 and [S II] 6716,6731 are weak. They infer a density of the low-ionization part of the NLR of cm-3. Laor et al. (1997b) detected on the same object very weak [C III] and [Si III] emission in a high S/N UV spectrum, suggesting a NLR component with cm-3.
Rodriguez-Pascual et al. (1997) analyzed the UV properties of a sample of NLS1 galaxies. Based on their photoionization modeling of the emission lines, they tentatively favored a low-density BLR in NLS1 galaxies. Ferland & Persson (1989) presented observations of Ca II emission lines from AGN with strong Fe II emission. They suggested that the BLR density in strong Fe II emitters is not higher than in other sources, based on the ratio of the forbidden lines relative to the Ca II triplet. On the other hand, other studies (e.g., Kuraszkiewicz et al. 2000; Wills et al. 2000; Marziani et al. 2001; Bachev et al. 2004) favored high-density BLRs, based on the Si III] /C III] ratio which is sensitive to density; such results are consistent with predictions by Gaskell (1985) that UV spectra of NLS1 galaxies would show a larger Si III] /C III] ratio. More recently, in studies of the optical-UV emission-line spectra of AGN, Marziani et al. (2001) and Bachev et al. (2004) reported indications of a systematic increase in density toward AGN with smaller FWHMs of the broad component of H based on the line ratio Si III] /C III] (they could not exclude the alternative interpretation of varying metal abundances, though). Comastri et al. (1998) reported detection of a deviation of the BLR Balmer line ratio H/H from the recombination value, such that the ratio was below the recombination value. They interpreted this as an indication of high density of the BLR of the NLS1 galaxies.
Our finding is that NLS1 galaxies have lower average NLR density. Therefore, if NLR and BLR are closely coupled, then our results favor models which also predict lower average BLR density in NLS1 galaxies (i.e., a stronger scatter including objects with lower density).
7.2 Supersolar metallicities and temperature effects
There are several indications that NLS1 galaxies have supersolar metallicities (e.g., Mathur 2000; Komossa & Mathur 2001; Nagao et al. 2002; Shemmer and Netzer 2002; Romano et al. 2004; Fields et al. 2005). We already noted in Sect. 6 that those objects with reliable [O III] 4363 measurements do not indicate enhanced temperatures in the low-density objects. However, the number of good spectra is still relatively small. Nagao et al. (2001) also examined the temperature-sensitive [O III] ratio for a small sample of NLS1 galaxies and concluded that they do not significantly deviate from BLS1 galaxies. On the theoretical side, whether an increase in metals, and specific elements in particular, leads to increased heating or cooling of the gas, and thus an increase or decrease of its temperature, needs to be assessed by detailed photoionization calculations. In general, increasing the oxygen abundance first leads to a decrease in temperature since oxygen is an important coolant. Such an effect would shift the data points in the – FWHM(H) diagram to even lower densities (because of the dependence of the [S II] ratio on temperature). In summary, we do not expect metallicity effects to play a dominant role in explaining the – FWHM(H) diagram.
7.3 Starburst contribution
If we had a strong starburst contribution in a fraction of our sources, then this would lead to lower measured density because H II regions have lower average density (e.g. Osterbrock 1989; Ho et al. 1997). If NLS1 galaxies are ”young objects” (e.g., Mathur 2000; Mathur, Kuraszkiewicz & Czerny 2001; Grupe & Mathur 2004; Mathur & Grupe 2005), still in the process of growing their black holes, then they may possibly also show enhanced starburst activity. However, as already being checked in Sect.6, NLS1 galaxies, including low-density objects, do not show signs of stronger starburst contribution to their optical emission lines than BLS1 galaxies. We thus conclude that starburst effects are negligible131313 In a study of a sample of 74 post-starburst type I AGN, which underwent a strong recent star formation epoch but stopped forming stars, Zhou et al. (2005) found that more than half of them are NLS1 galaxies. We checked whether their sample, which also includes BLS1 galaxies, shows any special preference for certain density values, particularly whether the post-starburst NLS1 galaxies would preferentially have low density. We find that their sources populate similar areas in the – FWHM(H) diagram. We have few post-starbursts among the low-density NLS1 galaxies in our sample, based on the lack of evidence of strong post-burst features in their host galaxies (equivalent width of H absorption line EW(H) 5 Å for post-starbursts..
7.4 NLR extent
BLS1 galaxies would lack an observable low-density NLR component, if the low-density part of the NLR was selectively obscured. However, spatially-resolved spectroscopy of the NLRs of nearby Seyfert galaxies shows that density declines as a function of cloud distance from the center. This would imply that it is the outer parts being obscured, leading to a peculiar and unlikely geometry.
Alternatively, lower average NLR density of the small–FWHM(H) objects may imply that their NLRs are, on average, more extended, since density declines outward. Indeed, there were early suggestions that the emission-line regions of NLS1 galaxies are at larger nuclear separations than those of BLS1 galaxies (e.g., Giannuzzo et al. 1999). Such a NLR model is consistent with a larger BLR distance in NLS1 galaxies (e.g., Wandel & Boller 1998, Puchnarewicz et al. 2001).
However, we note, that other parameters also play a role in determining NLR extent. In particular, there appears to be a scaling between luminosity of [O III] and NLR extent (Bennert et al. 2002, Schmitt et al. 2003), such that more luminous objects have more extended emission-line regions. We checked whether our sample shows a correlation between density and [O III] luminosity. No obvious trend is found.
7.5 Fraction of matter-bounded clouds
A substantial part of the [S II] emission is produced in the partially ionized zone of the NLR clouds. If the fraction of matter-bounded clouds varies as a function of the distance of the NLR clouds from the nucleus, and if the fraction of matter-bounded clouds in BLS1 galaxies is higher at larger nuclear distances than it is in NLS1 galaxies, then (given observations of density stratification within the NLR from high to low density) some of the low-density clouds in BLS1 galaxies partly escape our measurement, with the consequence that the average measured density in BLS1 galaxies is higher. Or, to put it the other way, a larger scatter in the number of matter-bounded low-density clouds in NLS1 galaxies would lead to a larger scatter in their average measured densities.
There are no direct measurements of the fraction of matter-bounded clouds in NLS1 galaxies and BLS1 galaxies. However, several observations do indicate a wide of range of column densities of the emission line clouds in NLS1 galaxies: Ferland & Persson (1989) need very high column densities to reproduce the strength of the Calcium emission in objects with strong Fe II emission, while Rodriguez-Pascual et al. (1997) infer a higher fraction of matter-bounded BLR clouds in NLS1 galaxies, based on UV observations. Regarding the NLR of NLS1 galaxies, Contini et al. (2003) require matter-bounded clouds in order to reproduce the strength of high-ionization iron lines. Photoionization models of the NLR of NLS1 galaxies presented by Rodriguez-Ardila et al. (2000b) invoke a mixture of matter-bounded and ionization-bounded clouds, the inner, high-density clouds mostly matter-bounded and producing high-ionization lines; the outer, low-density clouds mostly ionization-bounded and producing mostly low-ionization lines. However, Rodriguez-Ardila et al. (2005) discuss a different type of NLR models, involving shocks and photoionization, and in that model it is shocks which produce the low-ionization lines.
Future spatially resolved long-slit spectroscopy of the NLRs of nearby NLS1 galaxies will allow a direct comparison of the density profiles of BLS1 galaxies (e.g., Bennert et al. 2006b and references therein) with those of NLS1 galaxies. Making use of other line ratios in addition to [S II] may also allow us to determine the fraction of matter-bounded clouds as a function of radius, and enable us to measure the NLR extent of NLS1 galaxies.
7.6 ISM of the host galaxy
The NLR clouds are most likely directly related to the ISM of the host galaxy. The NLR properties then might also reflect different gas enrichment mechanisms of the ISM. For instance, the gas could be due to local stellar processes or transported inward from much larger scales (or else could arise from the inner parts in case of outflowing winds, driven by the central engine; see Sect. 7.7). The absence of low-density clouds in BLS1 galaxies may thus reflect the properties of the ISM in the host galaxy.
The host galaxies of NLS1 galaxies are often spirals, but not much is known about their systematic properties. There are indications that the host galaxies of NLS1 galaxies and BLS1 galaxies differ, particularly in the sense that large-scale bars are more common in NLS1 galaxies (Crenshaw, Kraemer & Gabel, 2003; Ohta et al., 2007), and that NLS1 galaxies have more grand-design dust spirals and a higher fraction of nuclear star-forming rings (Deo, Crenshaw & Kraemer, 2006). Moreover, Krongold et al. (2001) examined the host galaxies and found NLS1 galaxies reside in galaxies with smaller diameters than BLS1 galaxies. Previous studies on mass–luminosity/sigma relation led to conflicting possibilities, i.e., NLS1 galaxies are hosted by less luminous galaxies (e.g., Wang & Lu 2001; Botte et al. 2004, 2005) or on the contrary, more luminous galaxies for a given black hole mass (e.g., Mathur, Kuraszkiewicz & Czerny 2001; Grupe & Mathur 2004; Bian & Zhao 2004; Ryan et al. 2007).
Many of the morphological differences of the host galaxies of NLS1 galaxies and BLS1 galaxies are due to the presence or absence of a large-scale stellar bar (Deo, Crenshaw & Kraemer, 2006). Dynamical models show that a bar potential can efficiently drive gas from the outer regions (several kpc) to within 1 kpc from the nucleus, at which point the bar-driven gas flow slows or even stalls at the inner Lindblad resonance and the infalling gas will form a disk (Shlosman, Begelman & Frank, 1990). Gas inflow along a galactic stellar bar (Simkin, Su & Schwarz, 1980; Shlosman, Peletier & Knapen, 2000), has been proposed to be one possible trigger of AGN activity (e.g. Shlosman, Begeman & Frank 1990). However, how these processes affect the ISM density distribution on the scales of the NLR is presently unclear. Further studies of ISM properties of NLS1 and BLS1 galaxies on sub-kpc scales are needed to further address this issue.
7.7 Outflows
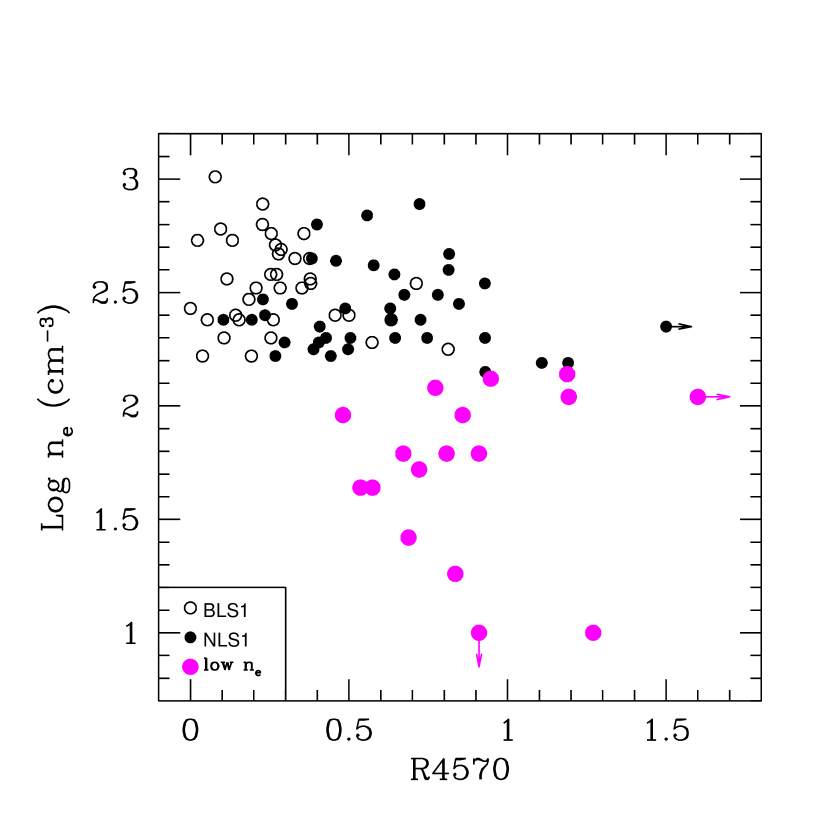
Lawrence et al. (1997) suggested that the density of an outflowing wind might be an important ingredient in understanding emission-line parameters of AGN and correlations among them. They loosely suggested strong Fe II emitters have the denser winds, in the context of a model where parts of the BLR are mechanically heated and produce the Fe II emission. We do find that BLS1 galaxies and NLS1 galaxies differ indeed in the density of their NLRs, but that it is actually the BLS1 galaxies which do harbor the higher density clouds. A correlation analysis further shows that is anti-correlated with R4570 (, ; Fig. 8). The low-density objects show larger-than-average R4570 compared to the high-density NLS1 galaxies. The average R4570 for the low-density objects and the high-density NLS1 galaxies is 0.95 and 0.61, respectively.
Schiano (1986) predicted that the average NLR density should be higher in very luminous objects than in lower luminosity objects. The prediction was based on their ’quasar wind ’ model, i.e., the NLR is the result of the interaction of AGN ionizing photons and a thermal wind on dense, massive interstellar clouds. However, our result conflicts with this prediction. The low-density regime in the -FWHM H diagram (Fig. 5) is not dominated by low-luminosity systems, but a mixture of high- and low-luminosity NLS1 galaxies. The quasars and low-luminosity Sy1 galaxies have almost the same average NLR density of 290 cm-3.
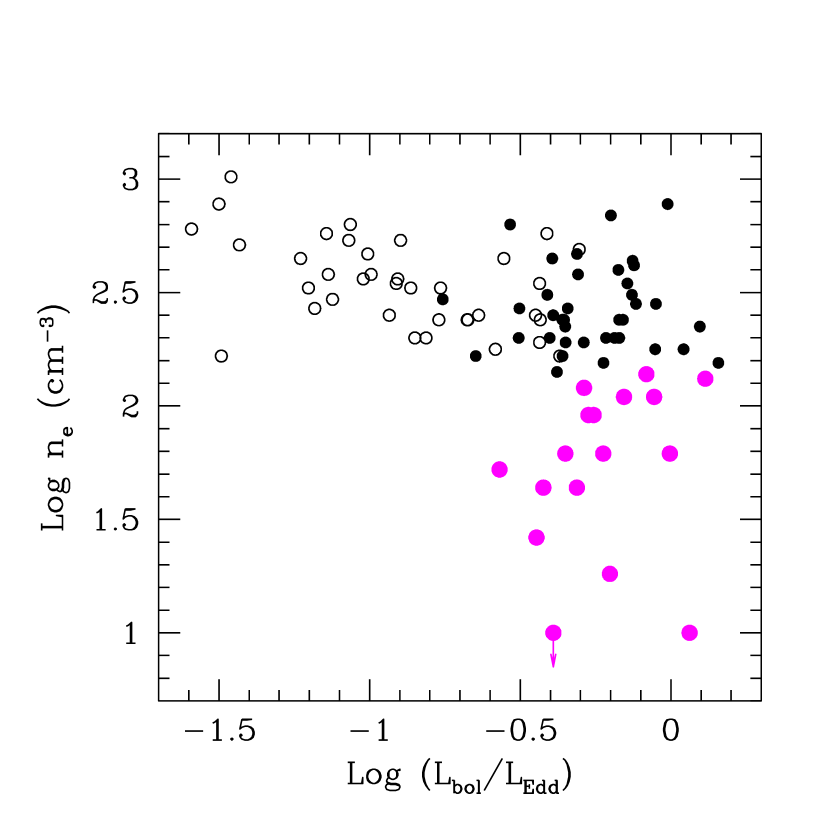
There are indications that many (but not all; e.g., Xu et al. 2003; Williams, Mathur & Pogge 2004) NLS1 galaxies accrete close to or even above the Eddington limit (e.g., Boroson & Green 1992; Wang et al. 1996; Boller et al. 1996; Laor et al. 1997; Sulentic, Marziani & Dultzin-Hacyan 2000; Boroson 2003; Grupe 2004; Grupe & Mathur 2004; Collin & Kawaguchi 2004). This likely comes with the presence of strong outflows. If these still propagate up into the NLR, then we may expect that the NLR gas in such objects is actually more tenuous. Radiation-pressure driven wind models predict a decrease of accretion rate with increasing width of the broad component of H (e.g., Nicastro 2000; Witt et al. 1997). Among the NLS1 population itself, it should then be the objects with accretion rates closer to Eddington that drive the stronger winds and thus have more tenuous, low-density NLR components. In order to test this, in Fig. 9, we plot Eddington ratio as a function of density . We estimate the bolometric luminosities using (Kaspi et al., 2000), while the Eddington luminosities are calculated using the black hole masses determined using the BLR radius and the velocity of the BLR gas (e.g. Peterson 1997). We find that is higher in NLS1 galaxies than in BLS1 galaxies. An anti-correlation of decreasing electron density with increasing Eddington ratio can be seen across our entire sample of NLS1 and BLS1 galaxies (, ). However, among the NLS1 population itself, the low-density objects do not show higher-than-average compared to the high-density NLS1 galaxies, which may suggest that higher is a necessary but not a sufficient condition to lower density. Independent calculation of , e.g., estimation from X-ray observations, is of great importance to check the trend. 49 out of 93 objects have X-ray counterparts in the RASS catalogs (e.g. Voges et al. 1999). We had a first look at the X-ray data. 40 of them have enough photon counts for an estimation of the X-ray slope and thus X-ray luminosity in the ROSAT band. The anti-correlation between and is even stronger (, ), particularly in the sense that low-density objects do have higher-than-average compared to the high-density NLS1 galaxies, with average = 3.2 and 1.2, respectively. Further careful study of the X-ray spectra and follow-up X-ray observations of the low-density objects will be crucial to understand the cause of the correlation.
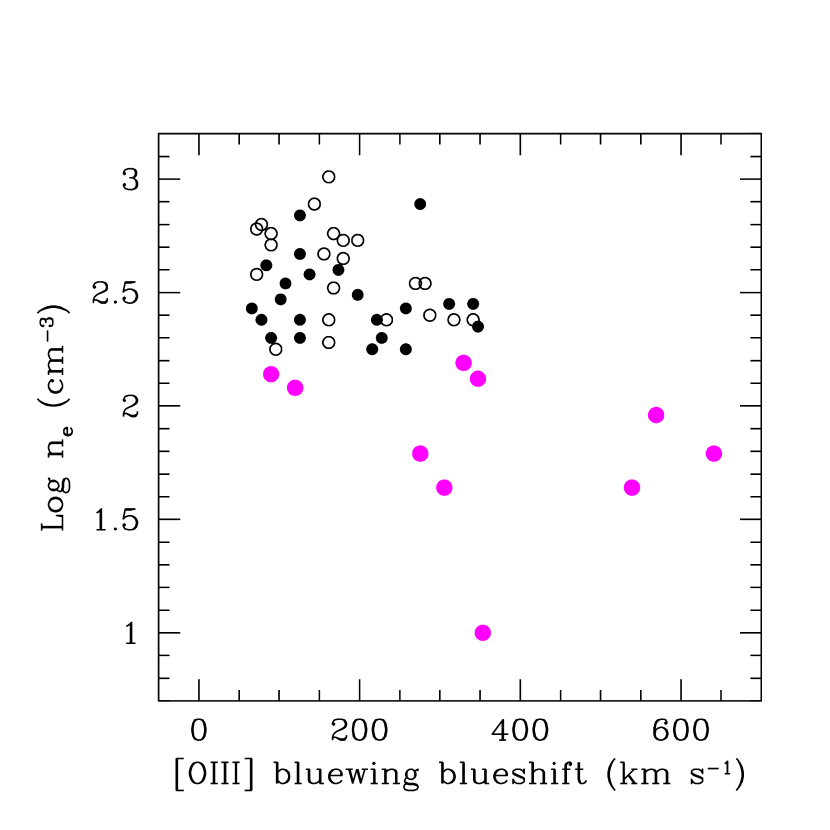
If outflow was a key mechanism to explain the lower average NLR density in NLS1 galaxies, then we would expect that the density ([S II] ratio) scales with the [O III] outflow velocity (blueshift). We checked for both, NLS1 galaxies vs. BLS1 galaxies, and within the NLS1 sample (high-density objects vs. low-density objects) whether the density correlates with the [O III] (peak) blueshift, and only found a weak correlation (, )141414This does not yet exclude that the whole NLR is in outflow. The [O III] peak blueshift was calculated relative to the the low-ionization lines; i.e., [S II] and [N II]. Ideally, one should measure the shift between host galaxy absorption lines and NLR emission lines, but most of our spectra are AGN dominated with few absorption lines detected.. However, it is interesting to note that the peak blueshift of [O III] does strongly correlate with (, ). This correlation then indicates that outflows are more common in objects with high accretion rates. We also checked whether there is a correlation between density and the blueshift of the blue wing of [O III]15151557 out of 93 objects clearly show blue wings. The blueshift of the peak of the blue wing was measured against the peak position of the core of the [O III] line., since a preferred interpretation of blue wings is the existence of outflows (or inflows) combined with viewing angle effects (e.g., Boroson 2005). A correlation is seen with (). This correlation shows that outflows are stronger in the low-density objects (Fig. 10), even if the bulk of the NLR does not participate in the outflow.
In summary, we find several indications which point toward a link between NLR density and outflows, and we tentatively favor the role of outflows in explaining the difference in the NLR density between NLS1 galaxies and BLS1 galaxies.
8 Summary and conclusions
We have studied one of the largest homogeneously analyzed sample of NLS1 galaxies in order to examine whether or not there is a difference in electron density between NLS1 galaxies and BLS1 galaxies. We employ a powerful diagnostic, the density-sensitive line ratio [S II] , to measure the NLR density. We show that the galaxies do not homogeneously populate the –FWHM(H) diagram. Our key finding is the detection of a ’zone of avoidance’ in the – FWHM(H) plane: BLS1 galaxies (FWHM(H) 2000 km s-1) avoid low average densities, and all show cm-3. On the other hand, NLS1 galaxies show a larger scatter in densities in the range cm-3, including a significant number of objects with low densities. The results obtained for [S II] are consistent with the [O I] – FWHM(H) diagram, which shows higher average [O I]/H intensity for BLS1 galaxies.
We investigated a number of different explanations for the ’zone of avoidance’ in density. We find that supersolar metallicities and temperature effects, a strong starburst contribution in NLS1 galaxies, and the effect of NLR extent are unlikely explanations. Consequences of the fraction of matter bounded clouds, and different properties of the ISM in the host galaxies, can only be further judged with future observations. We find several lines of evidence that outflows play a significant role in driving the difference in the NLR between NLS1 galaxies and BLS1 galaxies, and favor these as explanation for the zone of avoidance in the density-FWHM(H) diagram.
References
- Abazajian et al. (2005) Abazajian, K., Adelman-McCarthy, J.K., Agüeros, M.A., et al. 2005, AJ, 129, 1755
- Aoki, Kawaguchi & Ohta (2005) Aoki, K., Kawaguchi, T., & Ohta, K. 2005, ApJ, 618, 601
- Bachev et al. (2004) Bachev, R., Marziani, P., Sulentic, J.W., Zamanov, R., Calvani, M., & Dultzin-Hacyan, D. 2004, ApJ, 617, 171
- Baskin & Laor (2005) Baskin, A., & Laor, A. 2005, MNRAS, 358, 1043
- Bennert et al. (2002) Bennert, N., Falcke H., Schulz, H. Wilson, A.S., & Wills, B.J. 2002, ApJ, 574, 105
- Bennert et al. (2006a) Bennert, N., Jungwiert, B., Komossa, S., Haas, M., & Chini, R. 2006a, A&A, 459, 55
- Bennert et al. (2006b) Bennert, N., Jungwiert, B., Komossa, S., Haas, M., & Chini, R. 2006b, A&A, 456, 953
- Bian & Zhao (2004) Bian, W., & Zhao, Y. 2004, MNRAS, 347, 607
- Boller et al. (1996) Boller, Th., Brandt, W.N., & Fink, H. 1996, A&AS, 305, 53
- Boroson & Green (1992) Boroson, T.A., & Green, R.F. 1992, ApJS, 80, 109
- Boroson (2002) Boroson, T.A. 2002, ApJ, 565, 78
- Boroson (2003) Boroson, T.A. 2003, ApJ, 585, 647
- Botte et al. (2004) Botte, V., Ciroi, S., Rafanelli, P., & Di Mille, F. 2004, AJ, 127, 3168
- Botte et al. (2005) Botte, V., Ciroi, S., P., Di Mille, F., Rafanelli, P., & Romano, A. 2005, MNRAS, 356, 789
- Brotherton et al. (1994) Brotherton, M.S., Wills, B.J., Francis, P.J., & Steidel, C.C. 1994, ApJ, 430, 495
- Collin & Kawaguchi (2004) Collin, S., & Kawaguchi, T. 2004, A&A, 426, 797
- Collin et al. (2006) Collin, S., Kawaguchi, T., Peterson, B.M., & Vestergaard, M. 2006, A&A, 456, 75
- Comastri et al. (1998) Comastri, A., Fiore, F., Guainazzi, M., et al. 1998, A&A, 333, 31
- Constantin & Shields (2004) Constantin, S., & Shields, J. 2003, PASP, 115, 592
- Contini et al. (2003) Contini, M., Rodriguez-Ardila, A., & Viegas, S.M. 2003, A&A, 408, 101
- Contini & Viegas (2001) Contini, M., & Viegas, S.M. 2001, ApJS, 132, 211
- Corbin (1995) Corbin, M.R. 1995, ApJ, 447, 496
- Corbin (1997) Corbin, M.R. 1997, ApJS, 113, 245
- Crenshaw (1986) Crenshaw, D.M. 1986, ApJS, 62, 821
- Crenshaw et al. (2002) Crenshaw, D.M., Kraemer, S.B., & Turner, T.J., et al. 2002, ApJ, 566, 187
- Crenshaw, Kraemer & Gabel (2003) Crenshaw, D.M., Kraemer, S.B., & Gabel, J.R. 2003, AJ, 126, 1690
- de Robertis (1985) de Robertis, M.M. 1985, ApJ, 289, 67
- Deo, Crenshaw & Kraemer (2006) Deo, R.P., Crenshaw, D.M., & Kraemer, S.B. 2006, AJ, 132, 321
- Dewangan et al. (2001) Dewangan, G.C., Singh, K.P., Jones, L.R., McHardy, I.M., Mason, K.O., & Newsam, A.M. 2001, MNRAS, 325, 1616
- Dietrich, Grenshaw & Kraemer (2005) Dietrich, M., Grenshaw, D.M., & Kraemer, S.B. 2005, ApJ, 623, 700
- Elvis (2000) Elvis, M. 2000, ApJ, 545, 63
- Evans (1988) Evans, I.N. 1988, ApJS, 67, 373
- Ferland & Persson (1989) Ferland, G.J., & Persson, S.E. 1989, ApJ, 347, 656
- Fields et al. (2005) Fields, D.L., Mathur, S., Pogge, R.W., Nicastro, F., Komossa, S., & Krongold, Y. 2005, ApJ, 634, 928
- Filippenko & Sargent (1988) Filippenko, A.V., & Sargent, W.L.W. 1988, ApJ, 324, 134
- Francis et al. (1992) Francis, P.J., Hewett, P.C., Foltz, C.B., & Chaffee, F.H. 1992, ApJ, 398, 476
- Francis et al. (1996) Francis, P.J. 1996, PASA, 13, 212
- Fraquelli, Storchi-Bergmann & Binette (2000) Fraquelli, H.A., Storchi-Bergmann, T., & Binette, L. 2000, ApJ, 532, 867
- Gaskell (1984) Gaskell, C.M. 1984, ApL, 24, 43
- Gaskell (1985) Gaskell, C.M. 1985, ApJ, 291, 112
- Giannuzzo et al. (1999) Giannuzzo M.E., Mignoli M., Stirpe G.M., Comastri A. 1999, ASP Conf. Series, 175, p.291, C.M. Gaskell et al. (eds)
- Gierlinski & Done (2004) Gierlinski, M., & Done, C. 2004, MNRAS, 347, 885
- Goodrich (1989) Goodrich, R.W. 1989, ApJ, 340, 190
- Goodrich (2000) Goodrich, R.W. 2000, NewA Rev., 44, 519
- Grupe et al. (1998) Grupe, D., Beuermann, K., Thomas, H.-C., Mannheim, K., & Fink H.H. 1999, A&A, 350, 31
- Grupe et al. (1999) Grupe, D., Beuermann, K., Mannheim, K., & Thomas, H.-C. 1999, A&A, 350, 31
- Grupe & Mathur (2004) Grupe D., & Mathur S. 2004, ApJ, 606, L31
- Grupe (2004) Grupe, D. 2004, AJ, 127, 1799
- Greene & Ho (2005a) Greene, J.E., & Ho, L.C. 2005a, ApJ, 627, 721
- Greene & Ho (2005b) Greene, J.E., & Ho, L.C. 2005b, ApJ, 630, 122
- Greene & Ho (2004) Greene, J.E., & Ho, L.C. 2004, ApJ, 610, 722
- Hao (2005) Hao, L., Strauss, M.A., Tremonti, C.A., et al. 2005, AJ, 129, 1783
- Hippelein et al. (2003) Hippelein, H., Maier, C., Meisenheimer, K., et al. 2003, A&A, 402, 65
- Ho (1997) Ho, L. C., Filippenko, A.V., & Sargent, W.L.W. 1997, ApJ, 487, 579
- Ho (2005) Ho, L.C. 2005, ApJ, 629, 680
- Hopkins et al. (2005) Hopkins, P.F., Hernquist, L., Cox, T.J., Di Matteo, T., Martini, P., Robertson, B., & Springel, V. 2005, ApJ, 630, 705
- Kaspi et al. (2000) Kaspi, S., Smith, P.S., Netzer, H., et al. 2000, ApJ, 533, 631
- Kauffmann et al. (2003) Kauffmann, G., et al. 2003, MNRAS, 346, 1055
- Kewley & Geller (2004) Kewley, L.J., & Geller, M.J., 2004, AJ, 127, 2002
- Komossa & Bade (1999) Komossa, S., & Bade, N. 1999, A&A, 343, 775
- Komossa & Schulz (1997) Komossa, S., & Schulz, H. 1997, A&A, 323, 31
- Komossa & Meerschweinchen (2000) Komossa, S., & Meerschweinchen, J. 2000, A&A, 354, 411
- Komossa et al. (2001) Komossa, S., Grupe, D., & Janek, M. 2001, in AIP Conf. Proc. 599, X-ray Astronomy ’999: stellar endpoints, AGN and the diffuse background, ed. N. White, G. Malaguti, & G. Palumboi, 686
- Komossa & Mathur (2001) Komossa, S., & Mathur, S. 2001, A&A, 374, 914
- Komossa et al. (2006a) Komossa, S., Voges, W., Adorf, H.-M., Xu, D., Mathur, S., & Anderson, S.F. 2006a, ApJ, 639, 710
- Komossa et al. (2006b) Komossa, S., Voges, W., Xu, D., Mathur, S., Adorf, H.-M., Lemson, G., Duschl, W., & Grupe, D. 2006b, AJ, 132, 531
- Komosssa & Xu (2007) Komossa, S., & Xu, D., 2007, ApJ Letters, submitted
- Krongold et al. (2001) Krongold et al., 2001, AJ, 121, 702
- Kuraszkiewicz et al (2000) Kuraszkiewicz, J., Wilkes, B.J., Czerny, B., & Mathur, S. 2000, ApJ, 542, 692
- Kuraszkiewicz et al (2000) Kuraszkiewicz, J., Mason, K.O., Siemiginowska, A., et al. 2001, ApJ, 550, 644
- Kriss (1994) Kriss, G.A. 1994, in ASP Conf. Series 61, Astronomical Data Analysis Software and Systems III, ed. D.R. Crabtree, R.J. Hanisch, & J. Barnes (San Francisco: ASP), 437
- Laor et al. (1997a) Laor, A., Fiore, F., Martin, E., et al. 1997a, ApJ, 477, 93
- Laor et al. (1997b) Laor, A., Jannuzi, B.T., Green, R.F., & Boroson, T. 1997b, ApJ, 489, 656
- Lawrence et al. (1997) Lawrence, A., Elvis, M., Wilkes, B.J., McHardy, I., & Brandt, N. 1997, MNRAS, 285, 879
- Leighly (1999) Leighly, K.M. 1999, ApJS, 125, 317
- Leighly & Moore (2004) Leighly, K.M. & Moore, J.R. 2004, ApJ, 611, 107
- Lu et al. (2006) Lu, H., Zhou, H., Wang, T., Dong, X., & Li, C. 2006, AJ, 131, 790
- Mathur (2000) Mathur, S. 2000, MNRAS, 314, L17
- Mathur, Kuraszkiewicz & Czerny (2001) Mathur, S., Kuraszkiewicz, J., & Czerny, B. 2001, NewA, 6, 321
- mathur & Grupe (2005) Mathur, S., & Grupe, D. 2005, ApJ, 633, 688
- Marziani et al. (2001) Marziani, P., Sulentic, J.W., Zwitter, T., Dultzin-Hacyan, D., & Calvai, M. 2001, ApJ, 558, 560
- Miller et al. (1992) Miller, P., Rawlings, S., Saunders, R., & Eales, S. 1992, MNRAS, 254, 93
- Nagao et al. (2001) Nagao, T., Murayama, T., & Yoshiaki, T. 2001, ApJ, 546, 744
- Nagao et al. (2002) Nagao, T., Murayama, T., Shioya, Y., & Taniguchi Y. 2002, ApJ, 575, 721
- Netzer & Laor (1993) Netzer, H., & Laor, A. 1993, ApJ, 404, L51
- Netzer et al. (2004) Netzer, H., Shemmer, O., Maiolino, R., Oliva, E., Croom, S., Corbett, E., & Fabrizio, L.D. 2004, ApJ, 614, 558
- Ohta et al. (2007) Ohta, K., Aoki, K., Kawaguchi, T., & Kiuchi G. 2007, ApJS, 169, 1
- Osterbrock & Shuder (1982) Osterbrock, D.E., & Shuder, J.M. 1982, ApJS, 49, 149
- Osterbrock & Pogge (1985) Osterbrock, D.E., & Pogge, R.W. 1985, ApJ, 297, 166
- Osterbrock (1989) Osterbrock, D.E. 1989, Astrophysics of Gaseous Nebulae and Active Galactic Nuclei (University Science Books: Mill Valley, CA)
- Peterson (1993) Peterson, B.M. 1993, PASP, 105, 247
- Peterson (1997) Peterson, B.M. 1997, An Introduction to Active Galactic Nuclei (Cambridge University Press)
- Puchnarewicz et al. (1992) Puchnarewicz, E.M., Mason, K.O., C’ordova, F.A., et al. 1992, MNRAS, 256, 589
- Puchnarewicz et al. (2001) Puchnarewicz, E.M., Mason, K.O., Siemiginowska, A., Fruscione, A., Comastri, A., Fiore, F., & Cagnoni, I. 2001, ApJ, 550, 644
- Rice et al. (2006) Rice, M.S., Martini, P., Greene, J., et al. 2006, ApJ, 636, 654
- Rodriguez-Ardila et al. (2000a) Rodriguez-Ardila, A., Pastoriza, M.G., & Donzelli, C.J. 2000a, ApJS, 126, 63
- Rodriguez-Ardila et al. (2000b) Rodriguez-Ardila, A., Binette, L., Pastoriza, M.G., & Donzelli, C.J. 2000b, ApJ, 538, 581
- Rodriguez-Ardila et al. (2005) Rodriguez-Ardila, A., Contini, M., & Viegas, S.M. 2005, MNRAS357, 220
- Rodriguez-Pascual et al. (1997) Rodriguez-Pascual P.M., Mas-Hesse J.M., & Santos-Lleo M. 1997, A&A, 327, 72
- Romano et al. (2004) Romano, P., Mathur, S., Turner, T.J., et al. 2004, ApJ, 602, 635
- Ryan et al. (2007) Ryan, C.J., De Robertis, M.M., Viani, S. Laor, A., & Dawson, P.C. 2007, ApJ, 654, 799
- Schiano (1986) Schiano A.V.R., 1986, ApJ, 302, 81
- Schmitt et al. (2003) Schmitt, H.R., Donley, J.L., Antonucci, R.R.J. 2003, ApJS, 148, 327
- Shaw & Dufour (1994) Shaw, R.A., & Dufour, R.J. 1994, in ASP Conf. Series 61, Astronomical Data Analysis Software and Systems III, ed. D.R. Crabtree, R.J. Hanisch, & J. Barnes (San Francisco: ASP), 327
- Shemmer & Netzer (2002) Shemmer, O., & Netzer, H. 2002, ApJ, 567, L19
- Shlosman, Begelman & Frank (1990) Shlosman, I., Begelman, M.C., & Frank, J. 1990, Nature, 345, 679
- Shlosman, Peletier & Knapen (2000) Shlosman, I., Peletier, R.F., & Knapen, J. 2000, ApJ, 535, L83
- Simkin, Su & Schwarz (1980) Simkin, S.M., Su, H.J., & Shwarz, M.P. 1980, ApJ, 237, 404
- Strateva et al. (2003) Strateva, I.V., Strauss, M.A., Hao, L., et al. 2003, ApJ, 126, 1720
- Stirpe (1991) Stirpe, G.M. 1991, A&A, 247, 3
- Sulentic et al. (2000) Sulentic, J.W., Zwitter, T., Marziani, P., & Dultzin-Hacyan, D. 2000, ApJ, 536, 5
- Sulentic, Marziani & Dultzin-Hacyan (2000) Sulentic, J.W., Marziani, P., & Dultzin-Hacyan, D. 2000, ARA&A, 38, 521
- Sulentic et al. (2002) Sulentic, J.W., Marziani, P., Zamanov, R., Bachev, R., Calvani, M., & Dultzin-Hacyan, D. 2002, ApJ, 566, L71
- Sulentic et al. (2003) Sulentic, J.W., Zamfir, S., Marziani, P., Bachev, R., Calvani, M., & Dultzin-Hacyan, D. 2003, ApJ, 597, L17
- Vaughan et al. (2001) Vaughan, S., Edelson, R., Warwick, R.S., et al. 2001, MNRAS, 327, 673
- Veilleux, Cecil & Bland-Hawthorn (2005) Veilleux, S., Cecil G., & Bland-Hawthorn, J. 2005, ARA&A, 43, 769
- Vanden Berk et al. (2004) Vanden Berk, D.E., et al. 2004, AJ, 601, 692
- Vanden Berk et al. (2001) Vanden Berk, D.E., et al. 2001, AJ, 122, 549
- Véron-Cetty & Véron (2000) Véron-Cetty, M.P., & Véron, P. 2000, A&A Rev., 10, 81
- Véron-Cetty, Véron & Gonçalves (2001) Véron-Cetty, M.P., Véron, P., & Gonçalves, A.C. 2001, A&A, 372, 730
- Véron-Cetty, Joly & Véron (2004) Véron-Cetty, M.-P., Joly, M., & Véron, P. 2004, A&A, 417, 515
- Véron-Cetty et al. (2006) Véron-Cetty, M.-P., Joly, M., Véron, P., et al. 2006, A&A, 451, 851
- Voges et al. (1999) Voges, W., Aschenbach, B., Boller, Th., et al. 1999, A&A, 349, 389
- Wang, Brinkmann & Bergeron (1996) Wang, T., Brinkmann, W., & Bergeron, J. 1996, A&A, 309, 81
- Wandel & Boller (1998) Wandel, A. & Boller, Th. 1998, A&A, 331, 884
- Watson, Mathur, & Grupe (2006) Watson, L., Mathur, S., & Grupe, D. 2006, AJ, in press (astro-ph/0611819)
- Wei et al. (1999) Wei, J.Y., Xu, D.W., Dong, X.Y., & Hu, J.Y. 1999, A&AS, 139, 575
- Williams, Pogge, & Mathur (2002) Williams, J.M., Pogge, R.W., & Mathur, S. 2002, AJ, 124, 3042
- Williams, Mathur, & Pogge (2004) Williams, J.M., Mathur, S., & Pogge, R.W. 2004, ApJ, 610, 737
- Wills et al. (2000) Wills, B.J., Shang, Z., & Yuan, J.M. 2000, NewA Rev., 44, 511
- Wills et al. (1993) Wills, B.J., Brotherton, M.S., Fang, D., Steidel, C.C., & Sargent, W.L.W. 1993, ApJ, 415, 563
- Witt et al. (1997) Witt, H.J., Czerny, B., & Solarzycki, P.T. 1997, MNRAS, 286, 848
- Xu et al. (1999) Xu, D.W., Wei, J.Y., & Hu, J.Y. 1999, ApJ, 517, 622
- Xu et al. (2003) Xu, D.W., Komossa, S., Wei, J.Y., Qian, Y., & Zheng, X.Z. 2003, ApJ, 590, 73
- Zamanov et al. (2002) Zamanov, R., Marziani, P., Sulentic, J.W., Calvani, M., Dultzin-Hacyan, D., & Bachev, R. 2002, ApJ, 576, L9
- Zhang & Wang (2006) Zhang, E.-P., & J.-M. Wang 2006, ApJ, 653, 137
- Zhou et al. (2005) Zhou, H., Wang, T., Dong, X., Wang, J. & Lu, H. 2005, Mem. Soc. Astron. Italiana, 76, 93
- Zhou et al. (2006) Zhou, H., Wang, T., Yuan, W., Lu, H., Dong, X., Wang, J. & Lu, Y. 2006, ApJS, 166, 128