A wide deep infrared look at the Pleiades with UKIDSS: new constraints on the substellar binary fraction and the low mass IMF ††thanks: Based on observations made with the United Kingdom Infrared Telescope, operated by the Joint Astronomy Centre on behalf of the U.K. Particle Physics and Astronomy Research Council.
Abstract
We present the results of a deep wide-field near-infrared survey of 12 square degrees of the Pleiades conducted as part of the UKIDSS Deep Infrared Sky Survey (UKIDSS) Galactic Cluster Survey (GCS). We have extracted over 340 high probability proper motion members down to 0.03 solar masses (M⊙) using a combination of UKIDSS photometry and proper motion measurements obtained by cross-correlating the GCS with data from the Two Micron All Sky Survey (2MASS), the Isaac Newton (INT) and the Canada-France-Hawai’i (CFHT) telescopes. Additionally, we have unearthed 73 new candidate brown dwarf members on the basis of five band UKIDSS photometry alone. We have identified 23 substellar multiple system candidates out of 63 candidate brown dwarfs from the (,) and (,) colour-magnitude diagrams, yielding a binary frequency of 28–44% in the 0.075–0.030 M⊙ mass range. Our estimate is three times larger than the binary fractions reported from high-resolution imaging surveys of field ultracool dwarfs and Pleiades brown dwarfs. However, it is marginally consistent with our earlier “peculiar” photometric binary fraction of 5010% presented in Pinfield et al. (2003), in good agreement with the 32–45% binary fraction derived from the recent Monte-Carlo simulations of Maxted & Jeffries (2005) and compatible with the 2610% frequency recently estimated by Basri & Reiners (2006). A tentative estimate of the mass ratios from photometry alone seems to support the hypothesis that binary brown dwarfs tend to reside in near equal-mass ratio systems. In addition, the recovery of four Pleiades members targeted by high-resolution imaging surveys for multiplicity studies suggests that half of the binary candidates may have separations below the resolution limit of the Hubble Space Telescope or current adaptive optics facilities at the distance of the Pleiades (a 7 AU). Finally, we have derived luminosity and mass functions from the sample of photometric candidates with membership probabilities. The mass function is well modelled by a log-normal peaking at 0.24 M⊙ and is in agreement with previous studies in the Pleiades.
keywords:
Techniques: photometric — stars: low-mass, brown dwarfs; stars: luminosity function, mass function — galaxy: open clusters and associations: individual (Pleiades) — infrared: stars1 Introduction
Over the past two decades star forming regions and rich, young open clusters have been the focal points of numerous searches for substellar objects (e.g. Jameson & Skillen, 1989; Luhman, 1999; Lucas & Roche, 2000; Béjar et al., 2001; Moraux et al., 2003; Lodieu et al., 2006; Lodieu et al., 2007). Part of the reasoning behind this is that in these environments brown dwarfs (BDs), which cool and fade after a brief period of deuterium burning (2–20 Myr; Baraffe et al., 1998; Palla & Baraffe, 2005), are comparatively luminous, allowing 2/4m class telescopes to probe to very low-masses. Furthermore, the members of such an aglomeration likely have a common age, distance and composition making a theoretical interpretation of their observed properties somewhat more straightforward (e.g. mass estimates). The ultimate aim of these deep surveys is to characterise the substellar population, including the relative numbers of members as a function of mass, the lower mass limit to their manufacture, the binary fraction and the spatial distribution. Observational contraints on these properties can be used to critically examine models of the star formation process. Furthermore, comparison of these properties as derived in a number of different environments can provide clues as to whether the Initial Mass Function (IMF; dN/d) and the binary fraction, as a function of mass, are universal or dependent on the conditions in the nascent molecular clouds (Briceño et al., 2002; Luhman, 2004).
The rich Pleiades cluster has been subjected to a particularly high degree of scrutiny as it has a number of highly attractive properties. For example, its constituents share a sizeable common proper motion ( = 19.15 and = 45.72 mas/yr; Robichon et al., 1999) so it is relatively straightforward to discriminate members from the general field star population. The distance and the age of the cluster are well constrained. Estimates of the former, which includes a meticulous astrometric analysis of the binary Atlas, concentrate around 134 pc with an uncertainty of 5 pc (Johnson, 1957; Gatewood et al., 2000; Pinfield et al., 2000; Southworth et al., 2005). The latter is estimated to be Myrs based on the location of the “lithium boundary” (Rebolo, Martín & Magazzù, 1992) as observed in the spectra of low-mass members (Stauffer et al., 1998). Additionally, reddening along the line of sight to the cluster is generally low, E() = 0.03 (O’dell, Hendry & Collier Cameron, 1994).
Recent work on very young clusters (age 10 Myrs) and star-formation regions e.g. Ori (Béjar et al., 2001), the Trapezium Cluster (Muench et al., 2002; Slesnick et al., 2004), IC348 (Luhman et al., 1998; Luhman et al., 2000; Muench et al., 2003), Upper Sco (Lodieu et al., 2007) suggests that the IMF continues slowly rising, down to about m=0.01M⊙, at least in these environments. However, mass estimates of young BDs (age around 1 Myr or less) derived from the direct comparison of their observed properties to the predictions of theoretical models should be treated with caution because evolutionary calculations are not yet coupled to detailed simulations of the collapse and accretion phase of star formation (Baraffe et al., 2002). Similarly, Hillenbrand & White (2004) showed that models tend to underestimate masses by a few tens of percent in the m = 1.0–0.3 M⊙ mass range from an analysis of available dynamical mass measurements of pre-main-sequence stars. While it would be imprudent to claim that the interpretation of observational data related to members of the Pleiades is completely free of such uncertainties, given the greater maturity of the cluster it seems realistic to assume that these uncertainties are significantly reduced.
Previous CCD based studies of the Pleiades indicate that the present day mass function, across the stellar/substellar boundary and down to m0.03M⊙ (as derived using the NextGen and DUSTY models; Baraffe et al., 1998; Chabrier et al., 2000), can be represented to first order by a slowly rising power law model, dN/dm m-α. For example, from their CFHT survey conducted at and and covering 2.5 square degrees, Bouvier et al. (1998) identified 17 candidate BDs (I 17.8) and derived a power law index of = 0.60.1. From their 1.1 square degree INT survey conducted at and , with follow-up work undertaken in the -band, Dobbie et al. (2002) unearthed 16 candidate substellar members and found a power law index of = 0.80.2 to be consistent with their data. Moraux et al. (2003) extended the CFHT survey to an area of 6.4 square degrees (at and ) and unearthed a total of 40 candidate BDs. They applied statistical arguments to account for non-members in their sample and derived a power law index of = 0.60.1.
In arguably the most comprehensive deep study of the Pleiades to date, in terms of the selection criteria, Jameson et al. (2002) assembled a sample of candidate substellar cluster members from four relatively recent CCD surveys, the International Time Project survey (Zapatero Osorio et al., 1999), the CFHT survey (Bouvier et al., 1998; Moraux et al., 2001), the Burrell Schmidt survey (Pinfield et al., 2000) and the INT survey (Dobbie et al., 2002). As candidates were selected at the very least on the basis of photometry in three passbands, contamination in the final sample of 49 likely BD members was estimated to be relatively low (10%). This sample was used to derive an IMF power law index of = 0.410.08 over the m = 0.3–0.035 M⊙ (Jameson et al., 2002). Moreover, Pinfield et al. (2003) used these objects to infer a low-mass stellar/substellar binary fraction of 5010% in the Pleiades. This estimate is at least twice as large as determinations based on high-resolution imaging studies of both old field ultracool dwarfs (10–20%; e.g. Burgasser et al., 2003; Close et al., 2003; Bouy et al., 2003) and Pleiades BDs (13.3% Martín et al., 2000, 2003; Bouy et al., 2006a). Additionally, a number of the most detailed current theoretical models of brown dwarf formation predict a substellar binary fraction of only 5% due to the disruptive influence of dynamical interactions during the earliest stages of their formation (Bate et al., 2002; Delgado-Donate et al., 2003).
However, more recently, Maxted & Jeffries (2005) have conducted Monte-Carlo simulations to reproduce the binary properties of low-mass stars and BDs extracted from a number of radial velocity surveys (Guenther & Wuchterl, 2003; Kenyon et al., 2005; Joergens, 2006) and have argued that the overall binary frequency is more likely to be in the range 32–45%, comparable to that of K/M dwarfs. Furthermore, Basri & Reiners (2006) have concluded that spectroscopic binaries (i.e. close systems) can account for 11% over the 0–6 au separation range and should be added to those resolved in the course of high-resolution imaging despite some overlap in the separation ranges probed by both samples. This conclusion was also reached by Maxted & Jeffries (2005), implying that current binary estimates might actually be about twice larger. Nevertheless, the orbital separation and mass ratio distributions of low-mass binaries do appear to differ from those of their higher-mass G–M counterparts (Duquennoy & Mayor, 1991; Fischer & Marcy, 1992): the low mass separation distribution peaks around 4–8 au and three-quarter of systems have mass ratio larger than q = 0.8 (Burgasser et al., 2007).
In this paper we present the results of our analyse of about 12 square degree survey of the Pleiades in 111 are WFCAM filters. Filters from other studies are labelled in the text with the name of the observatory/survey to avoid confusion. However, WFCAM filters are labelled as such in the figures. and released as part of the UKIDSS Galactic Cluster Survey Data Release 1 (DR1) on 21 July 2006 (Warren et al., 2007). In Section 2 we present the multi-epoch observations considered in this study to extract photometric and PM candidate members of the Pleiades, including 2MASS (Cutri et al., 2003), INT (Dobbie et al., 2002; Jameson et al., 2002), CFHT (Moraux et al., 2003), and the UKIDSS GCS (second epoch) surveys. In Section 3 we describe the photometric selection of candidate cluster members from various colour-magnitude diagrams (CMDs) and estimate proper motions (PMs) from a probabilistic analysis. In Section 4 we review the list of previously published members recovered by our survey. In Section 5 we discuss the photometric binary frequency in the substellar regime and compare it with previous estimates in the Pleiades and for ultracool field dwarfs. In Section 6 we derive the cluster luminosity and mass function and discuss the observed features over the mass range probed by the GCS. Finally, we summarise our work in Section 7.
2 Surveys and datasets
2.1 The UKIDSS GCS in the Pleiades
The UKIRT Infrared Deep Sky Survey (Lawrence et al., 2006)222The survey is described at www.ukidss.org is a deep large-scale infrared surveys conducted with the UKIRT Wide-Field CAMera (WFCAM) on Mauna Kea in Hawai’i. The survey is composed of 5 independent components: the Large Area Survey, the Galactic Cluster Survey (hereafter GCS), the Galactic Plane Survey, the Deep Extragalactic Survey, and the Ultra-Deep Survey. All observations are pipeline-processed at the Cambridge Astronomical Survey Unit (CASU; Irwin et al. 2007, in preparation)333The CASU WFCAM-dedicated webpage can be found at http://apm15.ast.cam.ac.uk/wfcam. The processed data are then archived in Edinburgh and released to the user community through the WFCAM Science Archive (WSA; Hambly et al. 2007, in preparation)444The WFCAM Science Archive is accessible at the URL http://surveys.roe.ac.uk/wsa. More details on the specificities of DR1 are given in Warren et al. (2007).
The WFCAM focal plane array consists of 4 Rockwell 2048 2048 chips each covering a 13 arcmin by 13 arcmin field (or pawprint) with a pixel scale of 0.4 arcsec. Each detector is separated by about 10 and 10 arcmin in the x and y axes, respectively. Consequently, four pawprints are required to obtain a contiguous coverage (or tile) of 0.8 square degrees (Casali et al. 2007, in preparation). The and filters are centred at 0.92 and 1.03 m, respectively, and are 0.1 m wide. The , , and near-infrared broad-band filters are in the Mauna Kea Observatory (MKO) system (Hewett et al., 2006).
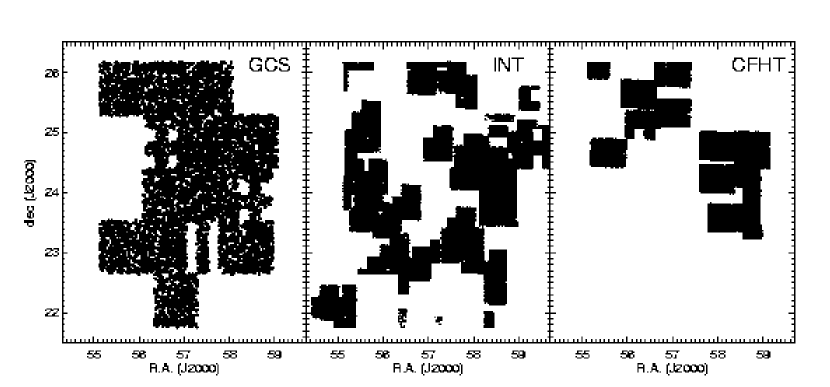
The GCS will cover 1000 square degrees in 10 star-forming regions and open clusters down to = 18.4 mag at two epochs. The main scientific driver of the GCS is to study the IMF and its dependence with environment in the substellar regime using an homogeneous set of observations of low-mass stars and BDs over a large area in several regions. The UKIDSS DR1 contains 50 square degrees in the Pleiades, Hyades, Taurus, and Orion (Warren et al., 2007). The total area released in the Pleiades in is approximately 12 square degrees close to the central region of the cluster (Figure 1). The 100% completeness limits of the Pleiades GCS survey are 20.1, 19.8, 18.9, 18.4, and 17.8 mag.
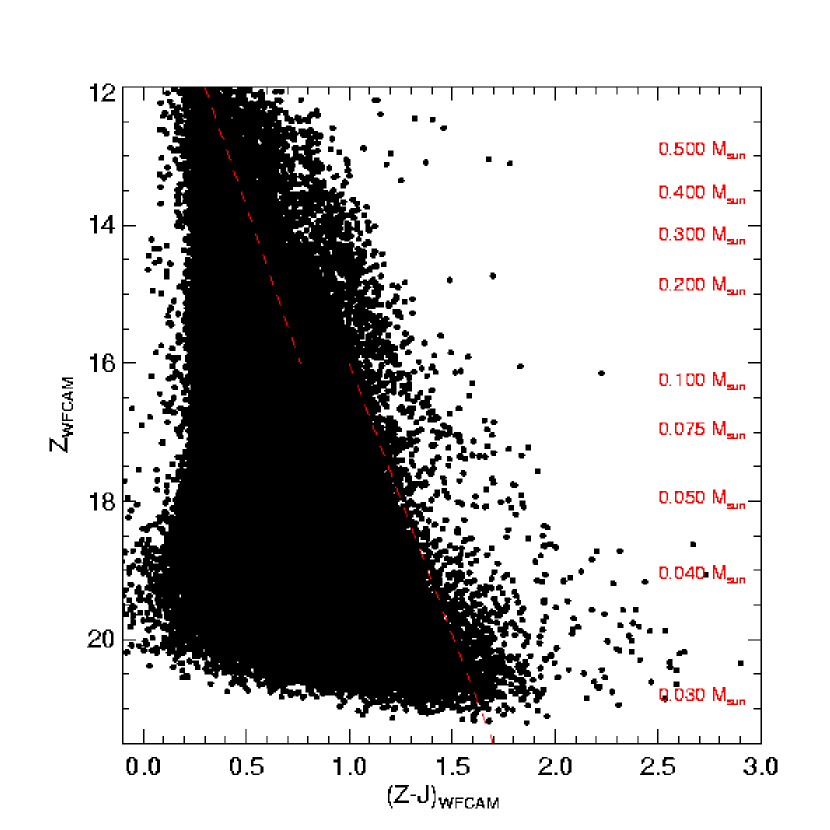
We have selected point sources in the Pleiades (UKIDSS GCS project #2) in a similar manner as described in our work conducted in Upper Sco (see SQL query in Appendix A of Lodieu et al., 2007). The main upgrades to the selection procedure applied in Upper Sco are two-fold. Firstly, we insisted on detections classified as point sources (Class parameters equal to 2 or 1) in all bands and lifted the constraint on and by requesting detections in the passbands only. Secondly, we have included a more relaxed constraint on the morphological shape of the point sources in all passbands to increase the completeness at the faint end of the survey i.e. we imposed that the ClassStat parameters lie between 3.0 and 3.0 in all passbands unless undetected in the and filters. The bright saturation limits are found to be = 11.3, 11.5, 11.0, 11.3, and 9.9 mag from the visual inspection of the histogram of the number of stars as a function of magnitude. However, we have only considered sources fainter than = 12 mag throughout this analysis to avoid saturated objects. As for Upper Sco, the SQL query includes the cross-correlation with 2MASS to compute PMs for all sources with a 2MASS counterpart (the objects undetected in 2MASS are included in the catalogue but PM is not available). The query returned a total of 105,092 sources. The full coverage is displayed in Fig. 1 and the resulting (,) CMD is shown in Fig. 2. Note that the theoretical isochrones plotted in this paper were specifically computed for the WFCAM set of filters and kindly provided by Isabelle Baraffe and France Allard.
| Survey | Filters | Limit | Astrom. | Epoch | Cov. |
|---|---|---|---|---|---|
| mag | arcsec | year | deg2 | ||
| GCS | 18.6 | 0.1 | 2005–2006 | 12 | |
| 2MASS | 15.8 | 0.1 | 1998–2000 | 300 | |
| CFHT | 22.0 | 0.2 | Dec 2000 | 6.4 | |
| INT | 18.5 | 0.3 | 1998–2000 | 20 |
2.2 The 2MASS survey in the Pleiades
As mentioned in the previous section, the SQL query includes a cross-correlation of GCS sources with the nearest 2MASS counterpart when available. The typical accuracy of the resulting proper motion measurement is less than 12 mas/yr down to the 2MASS 5 completeness limit of = 15.8 mag for the 5–7 year baseline. The coverage considered here overlaps with the study by Adams et al. (2001) which covered the entire cluster up to 10 degrees away from the centre and was complete down to 0.1 M⊙ (Table 1. The level of contamination of this earlier study was estimated to be less than 13% down to = 14 mag based on an extensive spectroscopic follow-up program of several hundreds of photometric and PM candidates drawn from a cross-correlation between 2MASS (Cutri et al., 2003) and the POSS I and POSS II plates (Reid et al., 1991). However, as a result of less accurate PMs at fainter magnitudes ( = 14–14.3 mag), contamination by field stars was at a much higher level, rendering membership assessement at the bottom of this survey considerably less reliable.
2.3 The INT-PL-IZ survey
Approximately 20 square degrees of the Pleiades was surveyed with the INT and Wide Field Camera (WFC) over the course of several semesters between 1998-2000. The WFC consists of four 2048x4196 pixel EEV CCDs with each pixel corresponding to 0.33 arcsec on the sky. Data were obtained using the filter and exposure times ranging from 600–1200 seconds in typical seeing of 1.0–1.5 arcsec. The data were reduced at the Cambridge Astronomical Survey Unit using the WFC data reduction pipeline, details of which are given in Irwin & Lewis (2001). Morphological classification and aperture photometry was performed on all sources detected at a significance level of 7 or greater. Coordinates are accurate to 0.3 arcsec externally (Table 1). Plots of log10[number of sources] against magnitude indicate that the vast majority of the -band images are photometrically complete to 18.5 mag, with some data complete to 1.5 magnitudes deeper (e.g. Dobbie et al., 2002) because about half of the INT images were taken under non-photometric conditions. The overlap of the INT data with the GCS survey is depicted in the middle panel of Fig. 1.
2.4 The CFHT survey
The raw CFH12K data were extracted from the Canadian Astrophysical Data Center archive and were processed at Cambridge University using the same general purpose pipeline described in the previous section (Irwin & Lewis, 2001). Characteristics of the re-processed data are given in Table 1 and the coverage falling in the area covered by the GCS is shown in the right panel of Fig. 1. The CFHT survey (and the INT) were used, in this paper, to derive proper motions and not for photometric purposes.
3 New substellar members in the Pleiades
3.1 An outline of our selection method
In this section we outline our method of selecting very-low-mass stellar and substellar candidate members of the Pleiades using five passband photometry and PMs. The main steps of the procedure are as follows:
-
1.
Make a conservative cut in the (,) CMD to select bright ( 16 mag) and faint ( 16 mag) photometric candidates (dashed lines in Fig. 2).
-
2.
Obtain PM from the 2MASS vs GCS cross-correlation for sources brighter than the 2MASS completeness at 17 mag and from the (INTCFHT) vs GCS cross-correlation for objects fainter than = 16 mag (Section 3.2).
-
3.
Analyse the vector point diagram in a probabilistic manner and infer a membership probability for each photometric candidate selected in the (,) CMD for which a proper motion measurement exists (Section 3.3). Derive a list of probable cluster members by choosing a specific threshold for the membership probability (p0.6)
- 4.
-
5.
Select new photometric candidates in the (,) CMD for which no PM is available. Their membership will be constrained further by examining their location in other CMDs and comparing it to proper motion members (Section 3.4)
-
6.
Identify new low-mass BD candidates from the (,) CMD i.e. sources undetected in the -band
-
7.
Identify new possible low-mass BDs from the (,) CMD i.e. sources undetected in the and passbands
3.2 Computation of proper motions
3.2.1 2MASS vs GCS cross-correlation
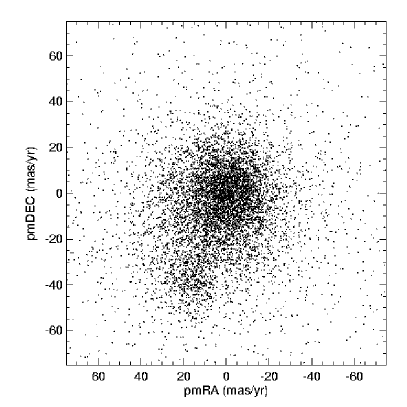
As described in Section 2.2, the SQL query used to retrieve the full Pleiades catalogue from the WSA includes a cross-correlation between the GCS and 2MASS source coordinates to derive PMs. Consequently, PMs are available for all sources brighter than the 2MASS 5 completeness limit ( = 15.8 mag; 17.5 mag) with an accuracy better than 12 mas/yr. The vector point diagram of sources brighter than = 16 mag and located to the right of a line running from (,) = (0.3,12.0) to (1.4,21.5) is shown in the left panel of Fig. 4. The location of the Pleiades cluster stands out clearly in this diagram due to its large PM (20; 40 mas/yr). All sources in this diagram are associated with a membership probability and this sample is referred throughout the remainder of this paper as the “bright” sample.
3.2.2 INT and CFHT vs GCS cross-correlation
The completeness of the 2MASS survey is insufficient to derive PMs over the full magnitude range probed by the GCS. However, the Pleiades has been extensively surveyed in the optical over wide area and deeply. Thus, we have cross-correlated the INT and CFHT catalogues (described in Sections 2.3 and 2.4) with the GCS to infer PMs for sources fainter than = 16 mag (hereafter “faint” sample). Previous optical surveys have achieved similar depths to the GCS, allowing the derivation of PMs down to 21 mag, corresponding to masses of 30 MJup for cluster members according to theoretical isochrones (Chabrier et al., 2000). We have adopted on purpose an overlapping range between the “bright” and “faint” samples to scale both luminosity functions (see Section 6). The vector point diagram of GCS sources with optical counterparts is displayed in the right panel of Fig. 4.
The photometric catalogues of the GCS and the CFHT and the GCS and the INT surveys were cross correlated using a matching radius of 2”. To determine proper motions we constructed 12 coefficient transforms between the coordinates of all sources common to both epochs using routines in the SLALIB package. To minimise the effects of large scale astrometric distortions in the transforms this process was undertaken on a chip by chip basis. Despite the greater depth of the CFHT data relative to the INT data, the resulting proper motion uncertainties are very similar, irrespective of epoch 1 dataset. These are typically found to be 7 mas/yr at = 15–18 mag but grow to 12 mas/yr at = 19–20 mag.
3.3 Membership probabilities
In order to calculate formal membership probabilities we have used the same technique as Deacon & Hambly (2004) to fit distribution functions to proper motion vector point diagrams (Hambly et al., 1995). First we have rotated the vector point diagram so the cluster lies on the y-axis using the rotation transformation below (Equations 1 and 2):
| (1) |
| (2) |
corresponding a rotation angle of 23.7 degrees, assuming a PM of (19.7,44.82) mas/yr for the Pleiades.
We have assumed that there are two contibutions to the total distribution , one from the cluster () and one from the field stars (). The fitting region was delineated by 50 50 mas/yr and 20 70 mas/yr. These were added by means of a field star fraction to yield an expression for given in Equation 3:
| (3) |
We have assumed that the cluster distribution is characterised by a two variable gaussian with a single standard deviation and mean proper motion values in each axis and (Equation 4):
| (4) |
The field star distribution was fitted by a single gaussian in the axis (with standard deviation and mean ) and a declining exponential in the axis with a scale length (Equation 5). The use of a declining exponential is a standard method (e.g. Jones & Stauffer, 1991) and is justified in that the field star distribution is not simply a circularly-symmetric error distribution (i.e. capable of being modelled as a 2d Gaussian) - rather there is a prefered direction of real field star motions resulting in a characteristic velocity ellipsoidal signature, i.e. a non-Gaussian tail, in the vector point diagram. This is best modelled (away from the central error-dominated distribution) as an exponential in the direction of the antapex (of the solar motion).
| (5) |
Then, we have solved those equations for these seven parameters (, , , , , , ). This fitting process was tested by Deacon & Hambly (2004) where simulated data sets were created and run through the fitting process to recover the input parameters. These tests produced no significant offsets in the parameter values (see Table 3 and Appendix A of Deacon & Hambly, 2004, for results and more details on the procedure). Hence, we have calculated the formal membership probabilities as,
| (6) |

| Nb | f | |||||||
|---|---|---|---|---|---|---|---|---|
| 10–12 | 12 | 0.55 | 7.66 | 2.38 | 43.91 | 6.18 | 13.58 | 5.10 |
| 12–14 | 300 | 0.61 | 5.95 | 0.48 | 40.34 | 17.79 | 20.47 | 2.55 |
| 14–16 | 616 | 0.63 | 6.65 | 0.20 | 41.71 | 16.55 | 17.02 | 4.21 |
| 16–18 | 82 | 0.53 | 4.36 | 1.81 | 42.97 | 22.45 | 21.96 | 6.81 |
| 18–19 | 16 | 0.68 | 6.53 | 1.80 | 42.98 | 26.15 | 12.91 | 7.83 |
| 19–20 | 29 | 0.68 | 8.05 | 1.80 | 42.98 | 14.76 | 11.45 | 12.07 |
| 20 | 18 | 0.86 | 10.63 | 1.80 | 42.98 | 11.10 | 13.61 | 0.38 |
As the astrometric errors varied in magnitude we have splitted the sample into six bands. The first three bands (from to ) were each two magnitudes wide and were fitted with all seven parameters in the same way as described in Deacon & Hambly (2004). As the astrometric errors increased rapidly at the faint end, ranges only one magnitude wide were used. In these bands the number of cluster stars was so small so that we have fixed the location of the cluster on the vector point diagram ( and ) to the values from a brighter bin. The other parameters were fitted as normal. A summary of the fitted parameters from the probabilistic analysis described above is given in Table 2.
This sample of 1061 sources with membership probabilities (hereafter “PM sample”) is used to derive the luminosity and mass function in Section 6. Among them, 379 have probabilities equal or higher than 0.6 (or 60%; named hereafter as “high probability PM members”), including 75 that we have classified as photometric non-member after examining their position in several CMDs. The mean probability for high probability members is 0.775. In Table 7, we list all high probability PM members fainter than = 16 mag i.e. masses below 0.1 M⊙ according to the NextGen models (Baraffe et al., 1998).
3.4 New photometric candidates
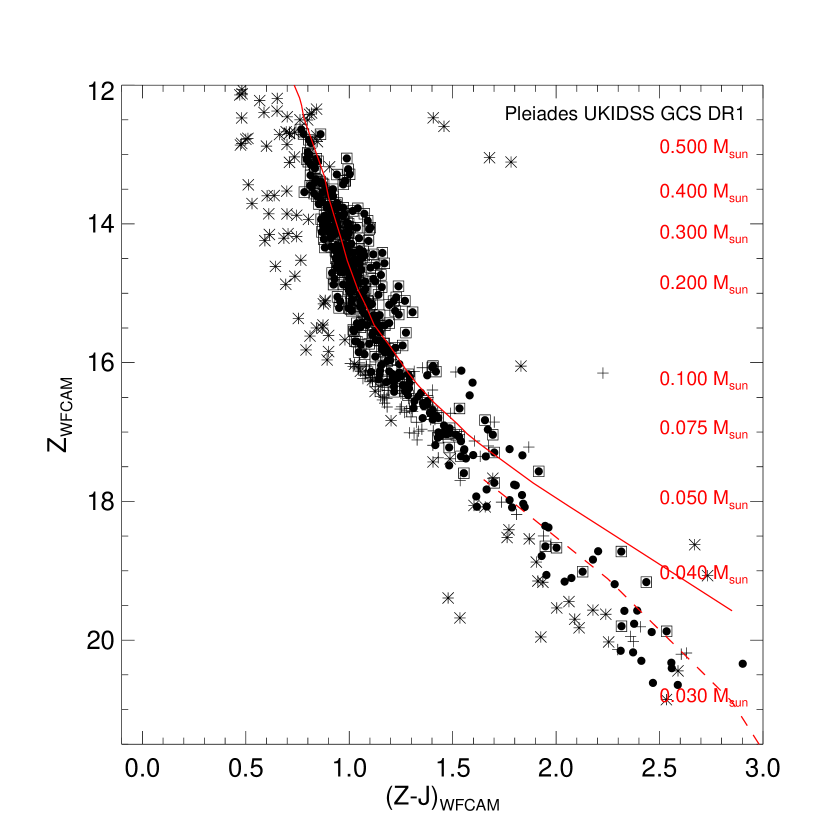
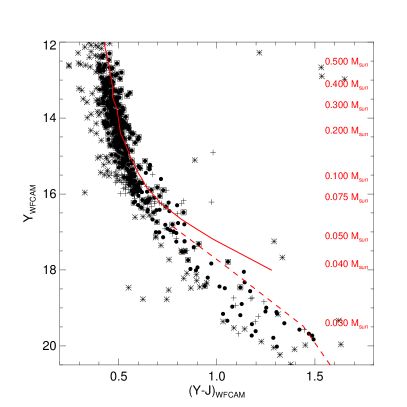
The GCS provides a larger areal coverage than the CFHT and INT surveys combined (Fig. 1). As a consequence, there are additional candidates lying on the sequence defined by high probability members (p0.6) in the (,) CMD (Fig. 3) for which no proper motion is available because of a lack of optical coverage. In this section we investigate their membership using the five photometric bands available from the GCS. Those objects are defined thereafter as new photometric candidates and are included in the computation of the binary frequency but not in the derivation of the luminosity and mass functions.
We have considered a straight line passing below the sequence defined by high probability members in the (,) CMD (Fig. 3) and shifted it downwards by 0.2 mag to take into account photometric errors and the depth of the cluster. This line goes from (,) = (1.0, 16.0) to (2.55, 21.50) and the selection returned 230 candidates. Among them are the 46 high probability members (including three classified as photometric non-members; Table 7) as well as 34 low probability objects (p60%), yielding a total of 2304634 = 150 new photometric candidates fainter than = 16 mag. The first step consisted in cross-correlating them with the list of 2MASS sources brighter than = 15.8 mag to evaluate their membership. Indeed, we have extracted 100 sources in 2MASS, including 53 with PM inconsistent with the Pleiades (outside a circle of radius 25 mas/yr centered on the cluster mean motion; Table 8), leaving 47 PM and 50 photometric candidates for further investigation. The radius of 25 mas/yr corresponds to a detection greater than 3 for the birght sources and 2 for the faintest ones, assuming uncertainties on the proper motions derived from the cross-correlation between the GCS and previous optical surveys (Sect. 3.2.2). Inspection of the location of these new candidates in several CMDs, including (,) and (,), have revealed 24 of them as photometric non-members (Table 9). The rejection is based on the blue colors observed in several diagrams compared to the sequence of PM and photometric members drawn in Sect. 3.3. Consequently, we have 73 new photometric candidates (Table 7) to be added to the high probability PM members.
3.5 New faint candidates
In addition, we have searched for fainter BD candidates using the (,) CMD (left panel in Fig. 5; Table 10) by imposing non detection. We have applied the following criteria:
-
•
No detection
-
•
= 18.5–21.0 mag
-
•
Candidates should lie above the line defined by (,) = (0.75, 18.50) and (1.5, 21.0)
This selection has returned 35 additional candidates (Table 10). Inspection of the -band images has revealed 9 of them as false or dubious detections (cross-talk, discrepant full-width-half-maximum, lack of detection, etc…), leaving 26 sources for further investigation. Among them, nine have a proper motion from the cross-correlation between the (INTCFHT) surveys and the GCS and five are located within a circle of 25 mas/yr radius centered on the Pleiades mean motion. The probabilistic approach was not feasible due to the small number of non-detection with PM. All five photometric and PM members have colours consistent with cluster membership. By the same token, we note that two out of four PM non-members were too blue in whereas the other two sit on the cluster locus and would have been considered as photometric candidates if no PM was available.
Among the remaining 269 = 17 sources with no PM, seven fit the cluster sequence in the (,) CMD while the remaining ten have colours bluer than 1.5 mag. The analysis of the seven sources with PM which also fit the cluster sequence in the (,) CMD showed that two of them were classified as PM non-members, implying that would expect at least two contaminants among the new sample of seven photometric candidates. Unfortunately, we can only use a statistical approach here, hence their membership should be treated with caution until PM is available for them after the second observations planned by the GCS.
3.6 New faint candidates
Finally, we have attempted to select -only sources from the (,) CMD to look for even lower-mass BDs (left panel in Fig. 5; Table 11). We have imposed an upper limit of = 18.9 mag, corresponding to the 100% completeness of the GCS. Our aim was to avoid any bias towards red sources as we might reach the L/T transiton predicted at 18.2 mag by the DUSTY models (Chabrier et al., 2000). Hence, we have cross-correlated all GCS sources in the = 17.5–18.9 magnitude range with the INT and CFHT catalogues. We have retrieved 16 photometric sources with PM but only one has a PM consistent with the Pleiades. Scrutiny of the finding charts revealed that only three objects were real detections; the remaining 13 being classified as dubious in Table 11.
If a true member and assuming it is a single star, the faintest photometric and PM candidate in the Pleiades extracted from the GCS has 18.8 mag and a colour of 1.88, corresponding to a mass of 28 MJup according to the DUSTY models (Chabrier et al., 2000). We estimate its spectral type to be late-L assuming typical near-infrared colours for field L dwarfs (Vrba et al., 2004): the reddest mean colour is reported for a L8 field dwarf. Hence, the GCS is just short of the transition region where dust settles in the atmosphere of BDs.
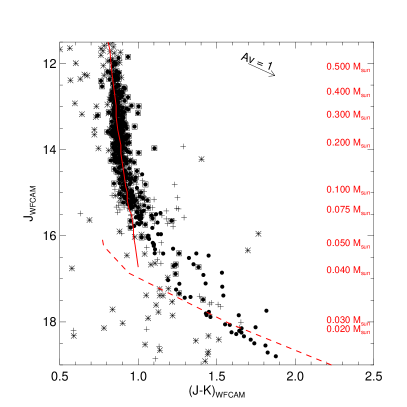
Finally, we should mention that the DUSTY models (Chabrier et al., 2000) lie on the high side of the Pleiades sequence in the (,) (Fig. 3) and (,) (left panel of Fig. 5) CMDs. This fact is not surprising as the authors stated themselves in their Section 2 that the DUSTY models represent “extreme situations” i.e. the amount of dust could be overestimated if the dust if not in equilibrium with the gas phase in brown dwarf’s photospheres. We find that if we assume that the DUSTY models match the binary sequence (see Section 5 for the selection of photometric binaries), the errors on the colours and magnitudes could be as high as 0.2 and 0.75 mag, respectively. These errors translate into uncertainties of 200–400 K on the effective temperatures and 0.01–0.02 M⊙ in masses, depending on the mass of the object. Furthermore, the DUSTY models cross the cluster sequence in the (,) CMD (right panel of Fig. 5), suggesting that masses might be underestimated for BDs more massive than 0.04 M⊙ and underestimated for lower masses. However, no models can currently reproduce M to L spectral type transition satisfactorily and several group are working on this issue (France Allard, personal communication).
4 Cross-correlation with previous surveys
The selection of cluster candidates described above yielded a large number of previously published Pleiades members reported in the literature (references therein). In particular, all bright members down to = 16 mag (corresponding to masses of 0.1 M⊙) reported in previous survey such as Hambly et al. (1993), Adams et al. (2001), and Deacon & Hambly (2004), were recovered by our study. In Table 3 we summarise the numbers of proper motion members, photometric candidates, proper motion and photometric low-mass stars and BD non-members published by earlier studies (Festin, 1998; Bouvier et al., 1998; Zapatero Osorio et al., 1999; Hambly et al., 1999; Pinfield et al., 2000; Deacon & Hambly, 2004; Bihain et al., 2006). Note that the list published by Deacon & Hambly (2004) contains only sources with membership probabilities higher than 0.6 and are recovered in the GCS as such.
We provide an electronic table which summarises the information on previous Pleiades candidates published by earlier studies and recovered in the GCS area (Table 4). This table lists the coordinates (J2000), the GCS photometry in 5 passbands (), PMs, their membership probabilities, as well as their associated names (including those attributed by previous surveys to the best of our knowledge).
| Survey | Memb | PM_NM | photNM | cand | All | % |
|---|---|---|---|---|---|---|
| Festin98 | 14 | 2 | 2 | 4 | 22 | 72.7 |
| Bouvier98 | 15 | — | 7 | 1 | 24 | 62.5 |
| ZO99 | 8 | 4 | 3 | 12 | 24 | 62.5 |
| Hambly99 | 4 | — | 1 | — | 5 | 80.0 |
| Pinfield00 | 160 | — | 45 | — | 205 | 78.0 |
| Moraux03 | 11 | — | 6 | 6 | 20 | 55.0 |
| DH04 | 275 | — | 0 | — | 275 | 100.0 |
| Bihain06 | 20 | 1 | 2 | 1 | 24 | 87.5 |
| R.A. | Dec. | Name | Memb? | |||||||
|---|---|---|---|---|---|---|---|---|---|---|
| 03 54 01.43 | 23 49 57.6 | 99.999 | 99.999 | 18.704 | 17.696 | 16.984 | — | — | BRB29 | cand |
| 03 54 02.55 | 24 40 25.9 | 20.435 | 19.257 | 18.369 | 17.945 | 17.142 | 10.19 | 20.53 | CFHTPLIZ34 | photNM |
| … | … | … | … | … | … | … | … | … | … | … |
| 03 54 14.06 | 23 17 52.0 | 19.946 | 18.760 | 17.586 | 16.789 | 16.131 | 26.13 | 56.27 | CFHTPLIZ28,BRB18 | Memb |
| 03 54 38.37 | 23 38 01.1 | 20.684 | 19.314 | 18.480 | 17.908 | 17.366 | 5.85 | 4.61 | CFHTPLIZ36 | PM_NM |

5 Discussion on the binary frequency
In this section, we investigate the binary frequency of BDs in the Pleiades using the photometry and colours from the GCS. The multiplicity in the substellar domain constitutes one way to constrain the formation mechanisms of BDs.
| range | Mass range | All | Single | Nbin | BF |
|---|---|---|---|---|---|
| 14.5–15.5 | 0.075–0.045 | 42 | 27 | 15 | 35.7% |
| 15.0–16.0 | 0.055–0.040 | 25 | 15 | 10 | 40.0% |
| 15.5–16.5 | 0.045–0.030 | 21 | 13 | 8 | 38.1% |
| 14.5–16.5 | 0.075–0.030 | 63 | 40 | 23 | 36.5% |
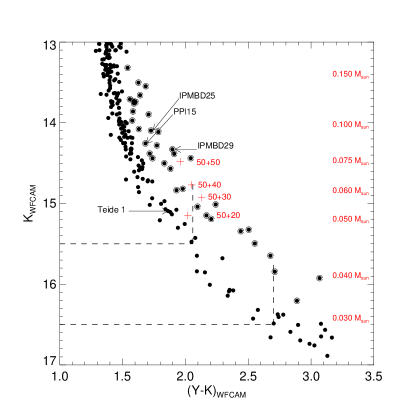
The single-star sequence and its associated binary sequence lying 0.75 mag above are clearly visible in the (,) CMD (Fig. 6). We have selected substellar multiple system candidates from this diagram (circled dots in Fig. 6) and listed them in Table 12. The multiplicity of those candidates was confirmed in their position in the (,) diagram (right panel in Fig. 6)555We note that a few candidates lie in the binary sequence in the (;) CMD but were not selected in the (,) CMD. These sources could be either lower mass ratio systems or reddened cluster members. The selection was made as follows: for a given magnitude, say = 15.5–16.5 mag, we have drawn two horizontal lines (dashed lines in Fig. 6) intercepting the single object sequence which we have interpolated using high probability PM members available from the optical/infrared cross-correlation (Section 3.2). From the intercept points we have drawn two vertical lines with a length of 0.75 mag. Then we have divided the box formed by both sequences and the vertical lines into two boxes: single stars lie in the bottom part whereas binary candidates in the top one. The dividing line between the lower and upper box was chosen to go through the gap present between the single-star and binary sequences, corresponding to a mass ratio of 0.4. The binary fraction was then defined as the number of binaries divided by the total number of objects (single starsbinaries).
In total, we have counted 23 substellar multiple system candidates in the = 14.5–16.5 mag range (corresponding to masses between 0.075 and 0.030 M⊙) and 40 single objects, yielding a binary frequency of 23/(2340) = 36.58.0% assuming Poisson errors (Table 5). These candidates include high probability members and new photometric candidates. The binary frequency range across the substellar regime probed by our survey is more likely to lie between 35 and 40% according to the dispersion as a function of mass (Table 5).
Our estimate of the substellar binary frequency is likely to be a lower limit for two reasons. Firstly, high-mass ratio binaries i.e. the ones with very low-mass companions will have hardly moved away from the single star sequence. For example, the crosses plotted in the left panel of Fig. 6 represent a 20, 30, 40, and 50 MJup BD added to a 50 MJup BD, respectively. The computation of the sequence of binaries with successively more massive companions was done using the Lyon group models for magnitudes and empirical data for magnitudes. Adding intensities for various mass combinations and reconverting to magnitudes gave the crosses in Fig. 6. It can be seen that low-mass ratio binary systems will hardly stand out from the single star sequence, hence difficult to pick out in a photometric-based search. As a consequence of the choice of our dividing line, we should be sensitive to mass ratios greater than 0.4 as are high-resolution imaging surveys. Secondly, the single star sequence is more likely to be affected by field dwarfs and reddened background stars than the binary sequence. Additionally, we need to take into account the depth of the cluster. The Pleiades has a tidal radius of 13 pc (Pinfield et al., 2000) and a distance of 130 pc, implying that the distance of any member can vary by 10% corresponding to a variation of 0.2 magnitude.
On average, we have derived a BD binary fraction of 28-44% in the Pleiades cluster, two to three times larger than estimates from high-resolution imaging survey (13.3%; Martín et al., 2000, 2003; Bouy et al., 2006a). The upper limit from the HST surveys in the Pleiades is lower than our estimates. We probe a wider mass range (75–30 MJup vs 65–55 MJup) and a comparable mass ratio range (q0.5) than those high-resolution surveys. Furthermore, our estimate is lower than the photometric estimate of 5010% by Pinfield et al. (2000) although consistent within the uncertainties. Recently, Basri & Reiners (2006) inferred an upper limit of 2610% on the binary fraction of low-mass stars and BDs, divided up into 11% of spectroscopic binaries (0–6 au) and 15% of wider binaries (3–15 au) despite some overlap between both subsample. Our results are on the high side of this latter estimate but compatible considering the uncertainties on both measurements. Finally, our results are in excellent agreement with the frequency of 32–45% from Monte-Carlo simulations (Maxted & Jeffries, 2005). Our results are not reproduced by current theoretical models predicting a low fraction of substellar binaries (Bate et al., 2002; Delgado-Donate et al., 2003) and represent a challenge for current theory of brown dwarf formation. Moreover we find a gap between the single and binary sequences, suggesting that most BDs tend to harbour equal-mass ratios seven sources have q=0.6–0.8; 15 have q=0.8–1.0; two have q0.6, and twelve are undetermined), similar to the properties of field BDs (mass ratios are listed in the last column of Table 5). Furthermore, we have recovered two known binaries resolved by HST (IPMBD 25 and 29) and one object observed by HST but not resolved (CFHT-Pl-IZ 4) as well as PPl15, suggesting that high-resolution surveys could be missing half of the binaries, hypothesis consistent with the conclusions drawn by Basri & Reiners (2006). Finally, the binary fraction could be dependent on the environment with a possible higher frequency in clusters than the field (Pinfield et al., 2000; Maxted & Jeffries, 2005; Kraus et al., 2006; Bouy et al., 2006b; Burgasser et al., 2007), trend reproduced by a model proposed by Goodwin & Whitworth (2007). However, there is currently no direct evidence for such a dependence mainly due to the lack of statistics and the uncertainties on membership in young clusters (Kraus et al., 2006; Bouy et al., 2006b).
6 The Initial mass function
In this section we discuss the cluster luminosity and mass function derived from the sample of candidates with PM from the “bright” (2MASS) and “faint” (INTCFHT) samples. We do not consider here the new photometric candidates (Section 3.4) because of a lack of PMs and did not attempt to correct the mass function for binaries.

| Mag range | Mass range | Mid-mass | dN | errH | errL | InFactor | ScFactor | dN/dM | errH | errL |
|---|---|---|---|---|---|---|---|---|---|---|
| 12.0-12.5 | 0.6470-0.5630 | 0.60500 | 13.5 | 4.8 | 3.6 | 1.00 | 1.000 | 160.6 | 56.8 | 43.3 |
| 12.5-13.0 | 0.5630-0.4940 | 0.52850 | 21.1 | 5.7 | 4.6 | 1.00 | 1.000 | 305.7 | 82.2 | 66.2 |
| 13.0-13.5 | 0.4940-0.4170 | 0.45550 | 31.4 | 6.7 | 5.6 | 1.00 | 1.000 | 407.2 | 86.6 | 72.4 |
| 13.5-14.0 | 0.4170-0.3330 | 0.37500 | 49.2 | 8.1 | 7.0 | 1.00 | 1.000 | 585.7 | 96.0 | 83.3 |
| 14.0-14.5 | 0.3330-0.2520 | 0.29250 | 58.6 | 8.7 | 7.6 | 1.00 | 1.000 | 724.0 | 107.5 | 94.3 |
| 14.5-15.0 | 0.2520-0.1920 | 0.22200 | 63.0 | 9.0 | 7.9 | 1.00 | 1.000 | 1049.2 | 149.7 | 132.0 |
| 15.0-15.5 | 0.1920-0.1460 | 0.16900 | 55.5 | 8.5 | 7.4 | 1.00 | 1.000 | 1206.0 | 184.7 | 161.6 |
| 15.5-16.0 | 0.1460-0.1160 | 0.13100 | 42.6 | 7.6 | 6.5 | 1.00 | 1.000 | 1420.0 | 252.8 | 216.9 |
| 16.0-16.5 | 0.1160-0.0920 | 0.10400 | 28.4 | 6.4 | 5.3 | 1.00 | 1.777 | 1182.2 | 266.5 | 221.0 |
| 16.5-17.0 | 0.0920-0.0750 | 0.08350 | 17.5 | 5.3 | 4.2 | 1.00 | 1.777 | 1027.8 | 309.9 | 244.1 |
| 17.0-17.5 | 0.0750-0.0645 | 0.06980 | 16.0 | 5.1 | 4.0 | 1.00 | 1.777 | 1524.5 | 485.1 | 378.1 |
| 17.5-18.0 | 0.0645-0.0558 | 0.06020 | 6.0 | 3.6 | 2.4 | 1.00 | 1.777 | 687.7 | 413.2 | 275.2 |
| 18.0-18.5 | 0.0558-0.0495 | 0.05270 | 3.2 | 3.0 | 1.7 | 1.00 | 1.777 | 504.0 | 473.2 | 271.5 |
| 18.5-19.0 | 0.0495-0.0416 | 0.04560 | 6.2 | 3.6 | 2.4 | 1.16 | 1.777 | 789.0 | 461.1 | 309.6 |
| 19.0-19.5 | 0.0416-0.0377 | 0.03960 | 9.3 | 4.2 | 3.0 | 1.43 | 1.777 | 2394.1 | 1070.8 | 772.9 |
| 19.5-20.0 | 0.0377-0.0349 | 0.03630 | 19.3 | 5.5 | 4.4 | 2.03 | 1.777 | 6881.4 | 1955.0 | 1557.5 |
| 20.0-20.5 | 0.0349-0.0321 | 0.03350 | 10.9 | 4.4 | 3.3 | 4.74 | 1.777 | 3882.9 | 1574.7 | 1164.0 |
| 20.5-21.0 | 0.0321-0.0298 | 0.03095 | 72.9 | 9.6 | 8.5 | 39.29 | 1.777 | 31695.7 | 4166.1 | 3705.9 |
| 21.0-21.5 | 0.0298-0.0289 | 0.02935 | 268.1 | 17.4 | 16.4 | 1862.86 | 1.777 | 297926.7 | 19330.8 | 18185.7 |
6.1 The cluster luminosity function
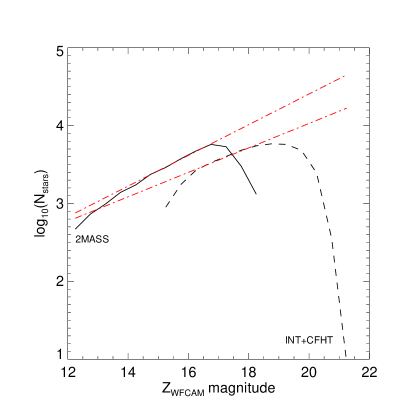
In this section, we consider all photometric candidates with membership probabilities i.e. 1061 sources with magnitudes ranging from 12 to 21.5 mag (Section 3.4). Assuming that the lithium depletion boundary is at M0.075 M⊙ (MZ = 11.44 Stauffer et al., 1998; Barrado y Navascués et al., 2004) and a distance of 130 pc, our sample contains 967 stars and 94 BDs. Those numbers objects should not be seen as exact numbers as they are subject to a 0.15 mag uncertainty in the position of the lithium depletion boundary but imply that our sample contains 10% of substellar objects (the number of BDs varies from 82 to 98). The luminosity function is usually defined as the number of stars as a function of magnitude but here we have derived it in a probabilistic manner: we summed the membership probability of all 1061 sources divided up into 0.5 magnitude bin instead of simply counting the number of objects. We have two independent samples: on the one hand, the “bright” sample considered down to = 16 mag and the ‘faint” sample used for fainter candidates. Both samples are complete over the = 16.25–16.75 magnitude range as demonstrated in the left-hand side panel of Fig. 7.
The “faint” sample was not drawn from the full GCS sample (hence coverage) because of the limited areal optical coverage and, thus, need to be scaled to the “bright” sample. We have investigated two approaches to infer a scaling factor over the = 16.25–16.75 magnitude range where both samples were complete. The total number of sources with proper motions in this magnitude range is 5988 and 2976 for the bright and faint samples, respectively. Hence, the ratio of the number of sources gives a scaling factor of 5288/2976 = 1.777. The second consisted in summing the probabilities for the “bright” and “faint” samples in the same magnitude range as above. The inferred scaling factor is 20.217/12.114 = 1.669. Hence, we have favoured the first method (which is likely less affected by uncertainties) and scaled the luminosity function of the “faint” sample by a factor of 1.777 to match the “bright” sample. The error on the scaling factor is less than 0.1 since both methods give similar results.
The sum of membership probabilities after scaling and correction for incompleteness are given in Table 6 and plotted in the right-hand side panel of Fig. 7. Error bars are Gehrels errors (Gehrels, 1986) rather than Poissonian error bars because the former represent a better approximation to the true error for small numbers. The upper limit is defined as 1+() and the lower limit as assuming a confidence level of one sigma. Incompleteness and scaling factors were applied to the errors when necessary. The luminosity function peaks at 14.5–15.0 mag and decreases down to 18.0–18.5 mag where it bounces back down to the survey limit (right-hand side panel of Fig. 7). The last two bins are subject to large incompleteness factors and should be treated with caution. Similarly, the brightest bin is likely to be affected by incompleteness.
6.2 The cluster mass function
In this section we adopt the following definition for the mass function as originally proposed by Salpeter (1955): () = d/d() m-α. We have converted the luminosity into a mass function using the NextGen models (Baraffe et al., 1998) for stars and BDs more massive than 50 MJup (Teff) and the DUSTY models (Chabrier et al., 2000) below. The = 12–21.5 magnitude range translates into masses between 0.65 and 0.03 M⊙, assuming a distance of 130 pc and an age of 120 Myr. This mass range is in agreement with the estimated masses given in Table 2 in Schwartz & Becklin (2005), suggesting that we have detected mid-L dwarfs in the Pleiades. The latter authors used the DUSTY models (Chabrier et al., 2000) and Burrows models (Burrows et al., 1997, 2000) at 80 and 125 Myr to infer a possible mass range for their new BD candidates. The faintest photometric and PM candidate extracted from the (,) CMD but not included in this mass function exhibit red infrared colours (Section 3.6), implying that we are not probing the L/T transition in the Pleiades where dust settles in the atmosphere of BDs.
The mass function, derived from the sample of sources with membership probabilities, is shown in the left-hand side panel of Fig. 8. This mass function is the “unresolved system” mass function since we did not attempt to correct for binaries (Moraux et al., 2004). Similarly we did not correct for the radial distribution of low-mass stars and BDs in the cluster due to the inhomogeneous coverage currently available from the GCS. On inspection of the mass function (Fig. 8) it was decided that a single power law would not properly represent the functional form over the full range of masses. Hence we have considered three mass ranges where we have fitted a power law: 0.563–0.333 M⊙ (filled circles), 0.333–0.116 M⊙ (star symbols), and 0.116–0.035 M⊙ (open squares). Each segment in the mass range is best characterised by power law indices of 0.980.87, 0.180.24, 2.111.20, respectively. Those results are in agreement within the uncertainties with previous studies of the Pleiades mass function in the low-mass star and brown dwarf regimes (Martín et al., 1998; Dobbie et al., 2002; Tej et al., 2002; Moraux et al., 2003; Deacon & Hambly, 2004). Adams & Fatuzzo (1996) proposed that the initial mass function can be approximated by a lognormal function defined by:
| (7) |
The best lognormal function fit to the mass function (dashed line in the left hand side panel of Fig. 8) is given by the following parameters: = 1.99, = 2.37, and = 1.89 over the 0.56–0.035 M⊙ mass range. These parameters can be converted into those defined by Chabrier (2003) to yield and 0.34. The value of is in good agreement with the value of 0.22 found by Chabrier (2003) for a mass function which includes unresolved multiple systems. However the value of (0.59) does differ from our results. How significant this difference is is impossible to say as Chabrier did not publish errors on his parameters.
It is clear that mass function deviates from a single power law over the course of our sample, with a peak around . In order to compare these results with those from previous studies an plot was produced showing the variation in the value of over the full mass range (right hand side panel in Fig. 8). The results from several other studies are plotted here too (Martín et al., 1998; Hambly et al., 1999; Tej et al., 2002; Moraux et al., 2003; Deacon & Hambly, 2004). It can be seen that the lognormal functions published by Hambly et al. (1999) and Deacon & Hambly (2004) are also in reasonable agreement with these results.

7 Summary
We have presented a deep wide-field survey conducted in the Pleiades open cluster as part of the UKIDSS Galactic Cluster Survey. We have employed a photometric selection complemented with a PM probabilistic analysis to assess the membership of Pleiades member candidates. We have recovered bright members from previous photometric and PM surveys down to 0.1 M⊙. Below this limit, we present a catalogue of high probability PM members as well as new photometric BD candidates down to 0.03 M⊙. The main outcomes of the GCS study in the central region of the Pleiades are two-fold:
-
•
we have derived a BD binary fraction around 33–40% in the 0.075–0.030 M⊙ mass range using the sample of high probability PM members as well as the photometric sample. This estimate is in agreement with Monte-Carlo simulations of Maxted & Jeffries (2005) and on the upper side of the estimate from the radial velocity survey conducted by Basri & Reiners (2006). The inferred binary frequency is however on the low side of the photometric estimate by Pinfield et al. (2003) and significantly higher than predictions by high-resolution imaging surveys. The separations and mass ratios seems however consistent with findings for ultracool field dwarfs and BDs in the Pleiades.
-
•
we have derived the Pleiades luminosity function using the sample of photometric candidates with membership probabilities. We have inferred a mass function in the 0.56–0.03 M⊙ and fitted a lognormal function peaking at 0.24 M⊙ which in agreement with previous studies in the cluster.
Acknowledgments
This work is based in part on data obtained as part of the UKIRT Infrared Deep Sky Survey (UKIDSS). Part of this work was carried out in Leicester where NL and PDD were postdoctoral research associates funded by the UK PPARC. We are grateful to Isabelle Baraffe and France Allard for providing us with the NextGen, DUSTY and COND models for the WFCAM filters. We thank our colleagues at the UK Astronomy Technology Centre, the Joint Astronomy Centre in Hawaii, the Cambridge Astronomical Survey and Edinburgh Wide Field Astronomy Units for building and operating WFCAM and its associated data flow system. This research has made use of the Simbad database, operated at the Centre de Données Astronomiques de Strasbourg (CDS), and of NASA’s Astrophysics Data System Bibliographic Services (ADS). This publication has also made use of data products from the Two Micron All Sky Survey, which is a joint project of the University of Massachusetts and the Infrared Processing and Analysis Center/California Institute of Technology, funded by the National Aeronautics and Space Administration and the National Science Foundation.
References
- Adams & Fatuzzo (1996) Adams F. C., Fatuzzo M., 1996, ApJ, 464, 256
- Adams et al. (2001) Adams J. D., Stauffer J. R., Monet D. G., Skrutskie M. F., Beichman C. A., 2001, AJ, 121, 2053
- Béjar et al. (2001) Béjar V. J. S., et al. 2001, ApJ, 556, 830
- Baraffe et al. (1998) Baraffe I., Chabrier G., Allard F., Hauschildt P. H., 1998, A&A, 337, 403
- Baraffe et al. (2002) Baraffe I., Chabrier G., Allard F., Hauschildt P. H., 2002, A&A, 382, 563
- Barrado y Navascués et al. (2004) Barrado y Navascués D., Stauffer J. R., Jayawardhana R., 2004, ApJ, 614, 386
- Basri & Martín (1999) Basri G., Martín E. L., 1999, AJ, 118, 2460
- Basri & Reiners (2006) Basri G., Reiners A., 2006, AJ, 132, 663
- Bate et al. (2002) Bate M. R., Bonnell I. A., Bromm V., 2002, MNRAS, 332, L65
- Bihain et al. (2006) Bihain G., Rebolo R., Béjar V. J. S., Caballero J. A., Bailer-Jones C. A. L., Mundt R., Acosta-Pulido J. A., Manchado Torres A., 2006, A&A, 458, 805
- Bouvier et al. (1998) Bouvier J., Stauffer J. R., Martín E. L., Barrado y Navascués D., Wallace B., Béjar V. J. S., 1998, A&A, 336, 490
- Bouy et al. (2003) Bouy H., Brandner W., Martín E. L., Delfosse X., Allard F., Basri G., 2003, AJ, 126, 1526
- Bouy et al. (2006b) Bouy H., Martín E. L., Brandner W., Zapatero-Osorio M. R., Béjar V. J. S., Schirmer M., Huélamo N., Ghez A. M., 2006b, A&A, 451, 177
- Bouy et al. (2006a) Bouy H., Moraux E., Bouvier J., Brandner W., Martín E. L., Allard F., Baraffe I., Fernández M., 2006a, ApJ, 637, 1056
- Briceño et al. (2002) Briceño C., Luhman K. L., Hartmann L., Stauffer J. R., Kirkpatrick J. D., 2002, ApJ, 580, 317
- Burgasser et al. (2003) Burgasser A. J., Kirkpatrick J. D., Reid I. N., Brown M. E., Miskey C. L., Gizis J. E., 2003, ApJ, 586, 512
- Burgasser et al. (2007) Burgasser A. J., Reid I. N., Siegler N., Close L., Allen P., Lowrance P., Gizis J., 2007, in Reipurth B., Jewitt D., Keil K., eds, Protostars and Planets V Not Alone: Tracing the Origins of Very-Low-Mass Stars and Brown Dwarfs Through Multiplicity Studies. pp 427–441
- Burrows et al. (1997) Burrows A., Marley M., Hubbard W. B., Lunine J. I., Guillot T., Saumon D., Freedman R., Sudarsky D., Sharp C., 1997, ApJ, 491, 856
- Burrows et al. (2000) Burrows A., Marley M. S., Sharp C. M., 2000, ApJ, 531, 438
- Chabrier (2003) Chabrier G., 2003, ApJL, 586, L133
- Chabrier et al. (2000) Chabrier G., Baraffe I., Allard F., Hauschildt P., 2000, ApJ, 542, 464
- Close et al. (2003) Close L. M., Siegler N., Freed M., Biller B., 2003, ApJ, 587, 407
- Cutri et al. (2003) Cutri R. M., et al. 2003, 2MASS All Sky Catalog of point sources, 2246
- Deacon & Hambly (2004) Deacon N. R., Hambly N. C., 2004, A&A, 416, 125
- Delgado-Donate et al. (2003) Delgado-Donate E. J., Clarke C. J., Bate M. R., 2003, MNRAS, 342, 926
- Dobbie et al. (2002) Dobbie P. D., Kenyon F., Jameson R. F., Hodgkin S. T., Pinfield D. J., Osborne S. L., 2002, MNRAS, 335, 687
- Dobbie et al. (2002) Dobbie P. D., Pinfield D. J., Jameson R. F., Hodgkin S. T., 2002, MNRAS, 335, L79
- Duquennoy & Mayor (1991) Duquennoy A., Mayor M., 1991, A&A, 248, 485
- Festin (1998) Festin L., 1998, A&A, 333, 497
- Fischer & Marcy (1992) Fischer D. A., Marcy G. W., 1992, ApJ, 396, 178
- Gatewood et al. (2000) Gatewood G., de Jonge J. K., Han I., 2000, ApJ, 533, 938
- Gehrels (1986) Gehrels N., 1986, ApJ, 303, 336
- Goodwin & Whitworth (2007) Goodwin S. P., Whitworth A., 2007, A&A, 466, 943
- Guenther & Wuchterl (2003) Guenther E. W., Wuchterl G., 2003, A&A, 401, 677
- Hambly et al. (1993) Hambly N. C., Hawkins M. R. S., Jameson R. F., 1993, A&AS, 100, 607
- Hambly et al. (1999) Hambly N. C., Hodgkin S. T., Cossburn M. R., Jameson R. F., 1999, MNRAS, 303, 835
- Hambly et al. (1995) Hambly N. C., Steele I. A., Hawkins M. R. S., Jameson R. F., 1995, MNRAS, 273, 505
- Hewett et al. (2006) Hewett P. C., Warren S. J., Leggett S. K., Hodgkin S. T., 2006, MNRAS, 367, 454
- Hillenbrand & White (2004) Hillenbrand L. A., White R. J., 2004, ApJ, 604, 741
- Irwin & Lewis (2001) Irwin M., Lewis J., 2001, New Astronomy Review, 45, 105
- Irwin et al. (2004) Irwin M. J., et al. eds, Optimizing Scientific Return for Astronomy through Information Technologies. Edited by Quinn, Peter J.; Bridger, Alan. Proceedings of the SPIE, Volume 5493, pp. 411-422 (2004). VISTA data flow system: pipeline processing for WFCAM and VISTA. pp 411–422
- Jameson et al. (2002) Jameson R. F., Dobbie P. D., Hodgkin S. T., Pinfield D. J., 2002, MNRAS, 335, 853
- Jameson & Skillen (1989) Jameson R. F., Skillen I., 1989, MNRAS, 239, 247
- Joergens (2006) Joergens V., 2006, A&A, 446, 1165
- Johnson (1957) Johnson H. L., 1957, ApJ, 126, 121
- Jones & Stauffer (1991) Jones B. F., Stauffer J. R., 1991, AJ, 102, 1080
- Kenyon et al. (2005) Kenyon M. J., Jeffries R. D., Naylor T., Oliveira J. M., Maxted P. F. L., 2005, MNRAS, 356, 89
- Kraus et al. (2006) Kraus A. L., White R. J., Hillenbrand L. A., 2006, ApJ, 649, 306
- Lawrence et al. (2006) Lawrence A., et al. 2006, arXiv:astro-ph/0604426
- Lodieu et al. (2006) Lodieu N., Hambly N. C., Jameson R. F., 2006, MNRAS, 373, 95
- Lodieu et al. (2007) Lodieu N., Hambly N. C., Jameson R. F., Hodgkin S. T., Carraro G., Kendall T. R., 2007, MNRAS, 374, 372
- Lucas & Roche (2000) Lucas P. W., Roche P. F., 2000, MNRAS, 314, 858
- Luhman (1999) Luhman K. L., 1999, ApJ, 525, 466
- Luhman (2004) Luhman K. L., 2004, ApJ, 617, 1216
- Luhman et al. (1998) Luhman K. L., Rieke G. H., Lada C. J., Lada E. A., 1998, ApJ, 508, 347
- Luhman et al. (2000) Luhman K. L., Rieke G. H., Young E. T., Cotera A. S., Chen H., Rieke M. J., Schneider G., Thompson R. I., 2000, ApJ, 540, 1016
- Martín et al. (2003) Martín E. L., Barrado y Navascués D., Baraffe I., Bouy H., Dahm S., 2003, ApJ, 594, 525
- Martín et al. (2000) Martín E. L., Brandner W., Bouvier J., Luhman K. L., Stauffer J., Basri G., Zapatero Osorio M. R., Barrado y Navascués D., 2000, ApJ, 543, 299
- Martín et al. (1998) Martín E. L., Zapatero Osorio M. R., Rebolo R., 1998, in ASP Conf. Ser. 134: “Brown Dwarfs and Extrasolar Planets”, eds. R. Rebolo, E. L. Martín, and M. R. Zapatero Osorio The Substellar Initial Mass Function in the Pleiades. p. p 507
- Maxted & Jeffries (2005) Maxted P. F. L., Jeffries R. D., 2005, MNRAS, 362, L45
- Moraux et al. (2001) Moraux E., Bouvier J., Stauffer J. R., 2001, A&A, 367, 211
- Moraux et al. (2003) Moraux E., Bouvier J., Stauffer J. R., Cuillandre J.-C., 2003, A&A, 400, 891
- Moraux et al. (2004) Moraux E., Kroupa P., Bouvier J., 2004, A&A, 426, 75
- Muench et al. (2002) Muench A. A., Lada E. A., Lada C. J., Alves J., 2002, ApJ, 573, 366
- Muench et al. (2003) Muench A. A., et al. 2003, AJ, 125, 2029
- O’dell et al. (1994) O’dell M. A., Hendry M. A., Collier Cameron A., 1994, MNRAS, 268, 181
- Palla & Baraffe (2005) Palla F., Baraffe I., 2005, A&A, 432, L57
- Pinfield et al. (2003) Pinfield D. J., Dobbie P. D., Jameson R. F., Steele I. A., Jones H. R. A., Katsiyannis A. C., 2003, MNRAS, 342, 1241
- Pinfield et al. (2000) Pinfield D. J., Hodgkin S. T., Jameson R. F., Cossburn M. R., Hambly N. C., Devereux N., 2000, MNRAS, 313, 347
- Rebolo et al. (1992) Rebolo R., Martín E. L., Magazzù A., 1992, ApJL, 389, L83
- Reid et al. (1991) Reid I. N., et al. 1991, PASP, 103, 661
- Robichon et al. (1999) Robichon N., Arenou F., Mermilliod J.-C., Turon C., 1999, A&A, 345, 471
- Salpeter (1955) Salpeter E. E., 1955, ApJ, 121, 161
- Schwartz & Becklin (2005) Schwartz M. J., Becklin E. E., 2005, AJ, 130, 2352
- Slesnick et al. (2004) Slesnick C. L., Hillenbrand L. A., Carpenter J. M., 2004, ApJ, 610, 1045
- Southworth et al. (2005) Southworth J., Maxted P. F. L., Smalley B., 2005, A&A, 429, 645
- Stauffer et al. (1998) Stauffer J. R., Schultz G., Kirkpatrick J. D., 1998, ApJL, 499, 219
- Tej et al. (2002) Tej A., Sahu K. C., Chandrasekhar T., Ashok N. M., 2002, ApJ, 578, 523
- Vrba et al. (2004) Vrba F. J., et al. 2004, AJ, 127, 2948
- Warren et al. (2007) Warren S. J., et al. 2007, MNRAS, 375, 213
- Zapatero Osorio et al. (1999) Zapatero Osorio M. R., Rebolo R., Martín E. L., Hodgkin S. T., Cossburn M. R., Magazzù A., Steele I. A., Jameson R. F., 1999, A&AS, 134, 537
Appendix A Table of of high probability proper motion members and new photometric candidates in the Pleiades from the UKIDSS GCS DR1.
| R.A. | Dec. | Prob | Memb? | Other name | |||||||
|---|---|---|---|---|---|---|---|---|---|---|---|
| 03 40 35.50 | 23 13 07.4 | 17.908 | 16.811 | 16.073 | 15.499 | 15.004 | 19.61 | 35.45 | — | cand | UGCSPl1 |
| 03 40 39.46 | 23 26 34.8 | 16.167 | 15.563 | 15.020 | 14.455 | 14.062 | 16.55 | 41.62 | — | cand | NoName |
| 03 40 52.79 | 25 24 43.4 | 19.156 | 18.009 | 17.115 | 16.423 | 15.853 | — | — | — | cand | UGCSPl2 |
| 03 40 55.30 | 25 34 57.4 | 17.381 | 16.464 | 15.817 | 15.187 | 14.727 | 21.07 | 58.68 | — | cand | UGCSPl3 |
| 03 41 30.36 | 25 17 06.0 | 16.555 | 15.821 | 15.240 | 14.674 | 14.297 | 11.31 | 40.18 | 0.849 | memb | UGCSPl4 |
| 03 41 33.90 | 23 11 44.9 | 16.134 | 15.557 | 15.029 | 14.501 | 14.150 | 37.63 | 33.57 | — | cand | HHJ12 |
| 03 41 37.74 | 23 04 32.7 | 17.929 | 17.005 | 16.315 | 15.658 | 15.208 | — | — | — | cand | UGCSPl5 |
| 03 41 40.90 | 25 54 24.1 | 16.829 | 15.900 | 15.173 | 14.562 | 14.114 | 23.78 | 37.48 | 0.915 | memb | CFHTPLIZ4 |
| 03 41 43.72 | 23 07 59.8 | 16.340 | 15.654 | 15.072 | 14.522 | 14.105 | 17.71 | 45.66 | — | cand | UGCSPl6 |
| 03 41 54.16 | 23 05 04.8 | 17.336 | 16.297 | 15.499 | 14.912 | 14.385 | 10.66 | 24.90 | — | cand | MHOBD3 |
| 03 42 05.74 | 23 07 14.4 | 16.654 | 15.911 | 15.343 | 14.769 | 14.344 | 16.53 | 36.85 | — | cand | UGCSPl7 |
| 03 42 07.99 | 22 39 33.5 | 18.718 | 17.398 | 16.515 | 15.809 | 15.192 | — | — | — | cand | intplIZ76 |
| 03 42 47.29 | 23 00 40.4 | 17.009 | 16.194 | 15.554 | 14.965 | 14.553 | 12.99 | 48.09 | — | cand | UGCSPl8 |
| 03 42 59.92 | 22 42 51.5 | 16.067 | 15.267 | 14.666 | 14.109 | 13.708 | 25.70 | 41.46 | 0.860 | memb | UGCSPl9 |
| 03 43 11.76 | 25 31 32.0 | 16.020 | 15.352 | 14.778 | 14.233 | 13.897 | 9.82 | 49.41 | — | cand | UGCSPl10 |
| 03 43 22.55 | 23 00 56.5 | 16.141 | 15.457 | 14.899 | 14.354 | 13.985 | 10.54 | 33.85 | — | cand | UGCSPl11 |
| 03 43 34.48 | 25 57 30.6 | 16.471 | 15.605 | 14.889 | 14.323 | 13.897 | 9.23 | 40.49 | — | cand | UGCSPl12 |
| 03 43 56.00 | 25 36 25.3 | 16.702 | 15.888 | 15.300 | 14.693 | 14.320 | 11.28 | 43.18 | 0.805 | memb | UGCSPl13 |
| 03 44 22.44 | 23 39 01.4 | 19.013 | 17.739 | 16.885 | 16.249 | 15.647 | 28.82 | 42.67 | 0.647 | memb | Roque5 |
| 03 44 23.24 | 25 38 44.9 | 16.288 | 15.349 | 14.692 | 14.133 | 13.744 | 16.08 | 28.17 | — | cand | BRB4 |
| 03 44 25.58 | 22 40 07.9 | 16.194 | 15.511 | 14.944 | 14.383 | 13.989 | 16.23 | 30.26 | 0.658 | memb | UGCSPl14 |
| 03 44 32.33 | 25 25 18.0 | 16.945 | 16.120 | 15.460 | 14.884 | 14.466 | 20.34 | 37.19 | 0.949 | memb | cfht10 |
| 03 44 34.30 | 23 51 24.6 | 16.799 | 16.016 | 15.444 | 14.858 | 14.453 | 33.10 | 39.85 | — | cand | UGCSPl15 |
| 03 44 35.16 | 25 13 42.8 | 17.567 | 16.482 | 15.651 | 14.979 | 14.439 | 21.14 | 39.28 | 0.952 | memb | CFHTPLIZ9,CFHTPl16 |
| 03 44 35.90 | 23 34 42.0 | 16.224 | 15.551 | 14.991 | 14.369 | 13.973 | 21.72 | 32.67 | 0.840 | memb | HHJ5 |
| 03 44 53.12 | 23 34 22.9 | 17.223 | 16.356 | 15.740 | 15.110 | 14.695 | 21.30 | 31.20 | 0.754 | memb | UGCSPl16 |
| 03 45 04.41 | 24 15 16.6 | 20.325 | 18.895 | 17.768 | 16.943 | 16.318 | — | — | — | cand | UGCSPl17 |
| 03 45 08.69 | 24 24 09.4 | 16.345 | 15.700 | 15.129 | 14.552 | 14.213 | 18.35 | 52.13 | — | cand | UGCSPl18 |
| 03 45 09.46 | 23 58 44.7 | 16.820 | 16.099 | 15.417 | 14.830 | 14.382 | 30.39 | 47.73 | — | cand | PPL2 |
| 03 45 31.37 | 24 52 47.5 | 17.246 | 16.226 | 15.471 | 14.842 | 14.329 | 19.65 | 30.23 | — | cand | IPMBD29 |
| 03 45 35.69 | 24 24 34.2 | 16.487 | 15.726 | 15.154 | 14.577 | 14.186 | 9.53 | 47.20 | — | cand | UGCSPl19 |
| 03 45 37.76 | 23 43 50.1 | 16.129 | 15.320 | 14.710 | 14.149 | 13.731 | 28.02 | 41.71 | 0.696 | memb | UGCSPl20 |
| 03 45 41.27 | 23 54 09.8 | 17.039 | 16.055 | 15.345 | 14.761 | 14.281 | 15.29 | 42.72 | 0.931 | memb | Roque15 |
| 03 45 42.33 | 24 04 11.2 | 16.420 | 15.757 | 15.203 | 14.624 | 14.252 | 14.24 | 40.62 | 0.931 | memb | UGCSPl21 |
| 03 45 50.42 | 22 36 05.6 | 17.593 | 16.734 | 16.039 | 15.488 | 15.017 | 20.35 | 39.71 | 0.956 | memb | BPL78 |
| 03 45 50.66 | 24 09 03.5 | 17.352 | 16.451 | 15.692 | 15.060 | 14.569 | 17.66 | 53.57 | — | cand | roque13 |
| 03 45 53.20 | 25 12 55.8 | 17.481 | 16.671 | 15.998 | 15.346 | 14.935 | — | — | — | cand | BPL81 |
| 03 45 54.96 | 23 33 57.9 | 17.032 | 16.209 | 15.560 | 15.005 | 14.550 | 16.40 | 39.61 | 0.952 | memb | UGCSPl22 |
| 03 46 02.52 | 23 45 33.2 | 18.077 | 17.254 | 16.460 | 15.458 | 15.012 | — | — | — | cand | UGCSPl23 |
| 03 46 03.75 | 23 44 35.6 | 18.074 | 17.137 | 16.410 | 15.528 | 15.040 | — | — | — | cand | UGCSPl24 |
| 03 46 08.02 | 23 45 35.5 | 18.787 | 17.829 | 16.857 | 15.832 | 15.324 | — | — | — | cand | UGCSPl25 |
| 03 46 10.23 | 21 52 55.8 | 16.115 | 15.233 | 14.573 | 13.949 | 13.548 | 36.60 | 41.94 | — | cand | UGCSPl26 |
| 03 46 14.06 | 23 21 56.5 | 17.005 | 16.220 | 15.574 | 15.013 | 14.589 | 16.37 | 27.55 | — | cand | UGCSPl27 |
| 03 46 22.25 | 23 52 26.6 | 17.013 | 16.179 | 15.526 | 14.879 | 14.440 | 16.52 | 39.19 | 0.953 | memb | UGCSPl28 |
| 03 46 23.12 | 24 20 36.1 | 18.081 | 17.027 | 16.233 | 15.636 | 15.134 | — | — | — | cand | BPL100 |
| 03 46 26.09 | 24 05 09.5 | 16.660 | 15.824 | 15.127 | 14.561 | 14.097 | 17.99 | 40.76 | 0.957 | memb | IPMBD25 |
| 03 46 27.10 | 21 48 22.6 | 19.764 | 18.557 | 17.387 | 16.557 | 15.845 | — | — | — | cand | UGCSPl29 |
| 03 46 32.13 | 24 23 14.6 | 19.104 | 17.932 | 17.030 | 16.345 | 15.840 | — | — | — | cand | UGCSPl30 |
| 03 46 34.25 | 23 50 03.7 | 19.799 | 18.422 | 17.483 | 16.644 | 16.070 | 17.97 | 38.98 | 0.686 | memb | UGCSPl31 |
| 03 46 34.99 | 23 31 14.4 | 18.353 | 17.242 | 16.406 | 15.818 | 15.301 | — | — | — | cand | UGCSPl32 |
| 03 46 35.36 | 23 57 07.4 | 16.768 | 15.943 | 15.346 | 14.756 | 14.384 | 16.65 | 42.51 | 0.944 | memb | UGCSPl33 |
| 03 46 40.94 | 22 22 38.2 | 19.193 | 18.048 | 16.910 | 16.151 | 15.495 | — | — | — | cand | UGCSPl34 |
| 03 46 48.56 | 23 09 57.6 | 16.434 | 15.709 | 15.087 | 14.515 | 14.078 | 20.25 | 36.11 | — | cand | UGCSPl35 |
| 03 46 50.03 | 24 00 23.6 | 17.295 | 16.335 | 15.594 | 14.987 | 14.502 | 18.70 | 36.10 | 0.943 | memb | UGCSPl36 |
| 03 46 51.82 | 23 23 09.4 | 19.574 | 18.324 | 17.182 | 16.399 | 15.647 | — | — | — | cand | UGCSPl37 |
| 03 46 52.97 | 24 15 07.8 | 16.271 | 15.623 | 15.058 | 14.480 | 14.125 | 19.58 | 42.79 | — | cand | MHO7 |
| 03 46 55.48 | 23 11 16.1 | 20.298 | 18.965 | 17.886 | 17.117 | 16.426 | — | — | — | cand | UGCSPl38 |
| 03 47 01.85 | 24 13 28.1 | 16.124 | 15.496 | 14.931 | 14.374 | 14.022 | 18.48 | 43.76 | — | cand | MHO10 |
| 03 47 04.41 | 24 47 27.4 | 20.645 | 19.401 | 18.057 | 17.099 | 16.504 | — | — | — | cand | UGCSPl39 |
| 03 47 05.71 | 24 40 03.6 | 16.905 | 16.048 | 15.447 | 14.850 | 14.425 | 25.97 | 35.30 | — | cand | BPL124 |
| 03 47 05.79 | 23 45 34.7 | 16.168 | 15.444 | 14.883 | 14.314 | 13.972 | 19.17 | 42.39 | 0.950 | memb | UGCSPl40 |
| R.A. | Dec. | Prob | Memb? | Other name | |||||||
|---|---|---|---|---|---|---|---|---|---|---|---|
| 03 47 10.65 | 23 58 16.4 | 16.041 | 15.466 | 14.887 | 14.340 | 13.990 | 16.16 | 33.75 | 0.886 | memb | UGCSPl41 |
| 03 47 11.79 | 24 13 31.3 | 16.182 | 15.444 | 14.805 | 14.234 | 13.860 | 9.97 | 28.34 | — | cand | MHO11 |
| 03 47 17.92 | 24 22 31.7 | 18.033 | 16.955 | 16.192 | 15.581 | 15.093 | — | — | — | cand | Teide1 |
| 03 47 18.10 | 24 45 14.6 | 19.060 | 17.973 | 17.107 | 16.303 | 15.678 | — | — | — | cand | UGCSPl42 |
| 03 47 27.72 | 22 09 38.6 | 17.332 | 16.426 | 15.733 | 15.169 | 14.726 | 9.37 | 38.49 | — | cand | MHOBD5 |
| 03 47 29.59 | 23 52 49.4 | 16.294 | 15.563 | 15.003 | 14.425 | 14.049 | 14.04 | 37.97 | — | cand | UGCSPl43 |
| 03 47 39.02 | 24 36 22.2 | 17.068 | 16.158 | 15.537 | 14.954 | 14.530 | 20.06 | 39.23 | 0.956 | memb | BRB12 |
| 03 47 46.77 | 25 35 16.6 | 20.340 | 18.479 | 17.438 | 16.673 | 16.142 | — | — | — | cand | UGCSPl44 |
| 03 47 48.91 | 24 17 06.6 | 20.153 | 19.148 | 17.841 | 17.014 | 16.406 | — | — | — | cand | UGCSPl45 |
| 03 47 49.45 | 23 31 52.9 | 17.057 | 16.199 | 15.615 | 15.022 | 14.606 | 34.87 | 44.39 | — | cand | UGCSPl46 |
| 03 47 50.41 | 23 54 47.9 | 18.087 | 17.007 | 16.300 | 15.589 | 15.078 | — | — | — | cand | NoName |
| 03 47 58.03 | 22 06 50.9 | 16.686 | 15.892 | 15.282 | 14.721 | 14.327 | 24.86 | 32.10 | — | cand | bpl163 |
| 03 47 59.73 | 22 36 01.9 | 17.981 | 16.986 | 16.206 | 15.588 | 15.106 | — | — | — | cand | intplIZ33 |
| 03 48 04.67 | 23 39 30.2 | 16.964 | 15.939 | 15.294 | 14.683 | 14.256 | 21.59 | 29.33 | — | cand | PPL15 |
| 03 48 14.30 | 24 15 50.6 | 16.582 | 15.828 | 15.226 | 14.675 | 14.253 | 10.53 | 52.30 | — | cand | BPL169 |
| 03 48 27.36 | 23 46 16.3 | 20.616 | 19.569 | 18.148 | 17.346 | 16.490 | — | — | — | cand | UGCSPl47 |
| 03 48 30.29 | 24 18 00.3 | 20.176 | 19.108 | 17.804 | 16.960 | 16.373 | — | — | — | cand | UGCSPl48 |
| 03 48 31.52 | 24 34 37.3 | 19.163 | 17.784 | 16.727 | 15.964 | 15.343 | 18.05 | 39.05 | 0.687 | memb | BRB16 |
| 03 48 38.37 | 22 33 51.8 | 17.262 | 16.416 | 15.707 | 15.162 | 14.713 | 8.64 | 50.82 | — | cand | UGCSPl49 |
| 03 48 44.69 | 24 37 23.5 | 16.208 | 15.478 | 14.916 | 14.396 | 13.989 | 23.06 | 35.91 | 0.910 | memb | CFHT5 |
| 03 48 55.65 | 24 21 40.2 | 16.160 | 15.535 | 14.953 | 14.391 | 14.031 | 19.28 | 39.16 | — | cand | HHJ8 |
| 03 49 04.86 | 23 33 39.3 | 17.133 | 16.229 | 15.593 | 15.037 | 14.573 | 9.55 | 35.28 | — | cand | Roque47 |
| 03 49 05.18 | 22 04 52.7 | 16.624 | 15.857 | 15.264 | 14.724 | 14.331 | 12.38 | 53.26 | — | cand | UGCSPl50 |
| 03 49 12.51 | 24 11 12.8 | 18.376 | 17.249 | 16.413 | 15.776 | 15.254 | — | — | — | cand | BPL201 |
| 03 49 15.12 | 24 36 22.5 | 16.797 | 15.947 | 15.367 | 14.846 | 14.418 | 17.46 | 42.66 | 0.946 | memb | BRB10 |
| 03 49 41.21 | 22 56 40.6 | 16.218 | 15.561 | 15.008 | 14.415 | 14.072 | 20.05 | 42.05 | 0.950 | memb | BPL213 |
| 03 49 43.17 | 24 39 46.5 | 16.325 | 15.616 | 15.067 | 14.507 | 14.100 | 18.57 | 34.64 | 0.923 | memb | BPL215 |
| 03 49 52.43 | 24 03 43.0 | 16.028 | 15.423 | 14.871 | 14.330 | 13.947 | 23.88 | 39.12 | — | cand | UGCSPl51 |
| 03 49 56.81 | 24 59 07.1 | 16.412 | 15.744 | 15.142 | 14.591 | 14.180 | 17.87 | 40.58 | 0.957 | memb | BPL218 |
| 03 50 08.27 | 25 30 51.7 | 19.578 | 18.202 | 17.248 | 16.579 | 16.007 | — | — | — | cand | UGCSPl52 |
| 03 50 13.39 | 23 59 29.8 | 20.404 | 19.093 | 17.845 | 16.892 | 16.205 | — | — | — | cand | UGCSPl53 |
| 03 50 16.09 | 24 08 34.8 | 19.872 | 18.458 | 17.338 | 16.664 | 16.077 | 15.01 | 36.98 | 0.619 | memb | Roque30 |
| 03 50 19.15 | 24 16 34.0 | 16.370 | 15.687 | 15.081 | 14.547 | 14.174 | 17.25 | 44.27 | 0.926 | memb | BPL228 |
| 03 50 22.01 | 23 55 30.4 | 17.248 | 16.292 | 15.692 | 15.077 | 14.673 | 29.42 | 25.82 | — | cand | UGCSPl54 |
| 03 51 05.97 | 24 36 16.9 | 17.082 | 16.231 | 15.654 | 15.122 | 14.703 | 10.72 | 34.15 | 0.664 | memb | CFHTPLIZ1 |
| 03 51 26.60 | 22 48 46.0 | 18.839 | 99.999 | 16.661 | 15.898 | 15.309 | — | — | — | cand | UGCSPl55 |
| 03 51 38.96 | 24 30 44.8 | 18.723 | 17.316 | 16.408 | 15.702 | 15.148 | 18.71 | 41.66 | 0.751 | memb | UGCSPl56 |
| 03 51 42.34 | 25 57 25.6 | 16.116 | 15.540 | 14.967 | 14.376 | 14.006 | 24.40 | 26.00 | — | cand | UGCSPl57 |
| 03 51 44.94 | 23 26 39.3 | 17.732 | 16.805 | 16.031 | 15.401 | 14.971 | 13.26 | 38.62 | 0.912 | memb | CFHTPLIZ10,BPL240 |
| 03 51 59.27 | 23 17 17.8 | 17.351 | 16.490 | 15.811 | 15.245 | 14.859 | 23.58 | 35.81 | 0.898 | memb | UGCSPl58 |
| 03 52 02.10 | 23 15 45.4 | 18.648 | 17.523 | 16.700 | 16.032 | 15.474 | 20.83 | 37.87 | 0.737 | memb | BPL249 |
| 03 52 05.82 | 24 17 31.1 | 16.470 | 15.771 | 15.186 | 14.614 | 14.251 | 13.32 | 41.59 | 0.909 | memb | NoName |
| 03 52 06.72 | 24 16 00.5 | 17.040 | 16.168 | 15.523 | 14.967 | 14.503 | 13.37 | 48.12 | 0.638 | memb | CFHTPLIZ3,CFHTPl13_Teide2 |
| 03 52 55.92 | 24 57 41.8 | 16.279 | 15.671 | 15.099 | 14.518 | 14.148 | 25.39 | 41.63 | 0.870 | memb | BPL275 |
| 03 53 23.13 | 23 19 20.4 | 17.768 | 16.798 | 15.963 | 15.327 | 14.818 | — | — | — | cand | BPL283 |
| 03 53 24.24 | 25 14 37.7 | 16.722 | 15.951 | 15.332 | 14.772 | 14.381 | 13.82 | 45.98 | — | cand | UGCSPl59 |
| 03 54 05.35 | 23 33 59.3 | 18.668 | 17.505 | 16.666 | 15.961 | 15.426 | 14.61 | 39.84 | 0.717 | memb | CFHTPLIZ20,CFHTPl25_BPL |
| 03 54 15.28 | 25 09 52.2 | 17.828 | 16.913 | 16.164 | 15.550 | 15.071 | 16.71 | 20.27 | — | cand | BPL306 |
| 03 54 31.48 | 22 39 01.6 | 16.552 | 15.766 | 15.173 | 14.571 | 14.187 | 15.83 | 40.39 | 0.948 | memb | UGCSPl60 |
| 03 55 12.61 | 23 17 37.3 | 17.759 | 16.765 | 15.962 | 15.330 | 14.835 | — | — | — | cand | CFHT15 |
| 03 55 18.11 | 24 17 05.7 | 16.242 | 15.660 | 15.100 | 14.526 | 14.185 | 21.11 | 22.06 | — | cand | BPL326 |
| 03 55 27.06 | 25 14 45.8 | 16.048 | 15.299 | 14.643 | 14.046 | 13.659 | 22.98 | 39.83 | 0.936 | memb | BPL328 |
| 03 55 47.14 | 25 14 39.6 | 17.188 | 16.421 | 15.772 | 15.201 | 14.797 | 8.24 | 29.85 | — | cand | UGCSPl61 |
| 03 55 47.45 | 22 50 50.2 | 19.883 | 18.435 | 17.421 | 16.667 | 16.088 | — | — | — | cand | UGCSPl62 |
| 03 56 11.38 | 25 03 36.5 | 16.606 | 15.895 | 15.229 | 14.675 | 14.323 | 22.99 | 41.23 | 0.932 | memb | BPL334 |
Appendix B Table of faint proper motion non-members in the Pleiades extracted from the UKIDSS GCS DR1
| R.A. | Dec. | |||||||
|---|---|---|---|---|---|---|---|---|
| 03 41 45.82 | 23 14 26.1 | 16.003 | 15.484 | 14.953 | 14.256 | 13.957 | 14.50 | 14.79 |
| 03 42 04.72 | 23 29 04.2 | 16.183 | 15.652 | 15.107 | 14.438 | 14.118 | 6.28 | 11.03 |
| 03 42 10.17 | 22 48 44.6 | 17.200 | 16.245 | 15.528 | 14.893 | 14.443 | 19.91 | 82.78 |
| 03 43 53.05 | 23 21 50.2 | 16.062 | 15.560 | 15.019 | 14.336 | 14.015 | 23.88 | 14.35 |
| 03 44 09.39 | 23 17 07.2 | 16.319 | 15.751 | 15.168 | 14.586 | 14.233 | 16.32 | 4.32 |
| 03 44 10.08 | 22 43 57.8 | 16.275 | 15.691 | 15.175 | 14.569 | 14.246 | 3.75 | 12.96 |
| 03 44 33.80 | 22 42 49.2 | 16.485 | 15.857 | 15.333 | 14.709 | 14.331 | 2.88 | 18.30 |
| 03 45 21.12 | 21 46 17.5 | 16.262 | 15.793 | 15.149 | 14.562 | 14.230 | 14.43 | 38.91 |
| 03 45 22.14 | 21 52 40.0 | 16.220 | 15.655 | 15.115 | 14.550 | 14.191 | 4.94 | 66.09 |
| 03 45 28.34 | 23 48 09.6 | 16.983 | 16.259 | 15.577 | 14.721 | 14.285 | 21.69 | 0.94 |
| 03 45 29.86 | 22 24 14.6 | 16.335 | 15.699 | 15.176 | 14.555 | 14.221 | 40.98 | 85.07 |
| 03 45 34.50 | 23 41 43.5 | 16.959 | 16.237 | 15.608 | 14.846 | 14.430 | 17.30 | 14.64 |
| 03 45 36.44 | 24 18 15.4 | 16.079 | 15.561 | 15.037 | 14.415 | 14.095 | 8.91 | 6.78 |
| 03 45 36.85 | 23 44 47.8 | 16.669 | 16.245 | 15.423 | 14.641 | 14.244 | 7.10 | 12.74 |
| 03 45 37.25 | 23 49 21.0 | 16.279 | 15.725 | 15.116 | 14.203 | 13.866 | 21.11 | 9.22 |
| 03 45 43.12 | 25 40 23.1 | 16.150 | 14.905 | 13.924 | 13.220 | 12.638 | 102.76 | 38.74 |
| 03 45 49.90 | 23 45 59.8 | 16.124 | 15.484 | 14.810 | 13.887 | 13.578 | 6.17 | 7.13 |
| 03 46 08.22 | 23 21 38.7 | 17.011 | 16.367 | 15.720 | 14.986 | 14.614 | 14.77 | 6.54 |
| 03 46 14.47 | 22 20 51.1 | 16.639 | 15.992 | 15.456 | 14.964 | 14.587 | 72.99 | 67.54 |
| 03 46 26.76 | 24 49 18.1 | 16.210 | 15.604 | 15.109 | 14.497 | 14.196 | 30.58 | 28.37 |
| 03 46 33.00 | 23 38 00.9 | 16.537 | 15.946 | 15.377 | 14.425 | 14.120 | 9.39 | 7.18 |
| 03 46 34.16 | 23 25 12.5 | 16.210 | 15.672 | 15.079 | 14.377 | 14.041 | 9.28 | 4.89 |
| 03 46 36.83 | 23 33 01.8 | 16.659 | 15.959 | 15.359 | 14.488 | 14.113 | 6.73 | 11.83 |
| 03 46 44.04 | 23 38 13.5 | 17.114 | 16.411 | 15.786 | 14.916 | 14.564 | 20.68 | 7.25 |
| 03 46 50.99 | 25 40 44.6 | 16.230 | 15.655 | 15.164 | 14.450 | 14.174 | 2.52 | 13.87 |
| 03 46 52.29 | 21 47 43.1 | 16.695 | 15.996 | 15.417 | 14.783 | 14.401 | 22.89 | 8.81 |
| 03 47 06.65 | 24 45 47.4 | 16.051 | 15.414 | 14.968 | 14.414 | 14.093 | 75.15 | 40.22 |
| 03 47 08.31 | 22 33 10.0 | 16.500 | 15.881 | 15.332 | 14.804 | 14.422 | 9.26 | 17.59 |
| 03 47 13.69 | 23 46 28.4 | 16.347 | 15.706 | 15.221 | 14.656 | 14.329 | 14.07 | 7.48 |
| 03 47 36.27 | 24 28 50.1 | 16.049 | 15.482 | 14.967 | 14.279 | 13.929 | 9.18 | 5.59 |
| 03 48 23.62 | 24 22 35.2 | 16.151 | 15.466 | 14.890 | 14.299 | 13.938 | 15.18 | 6.70 |
| 03 48 36.30 | 23 33 25.3 | 16.054 | 15.512 | 15.035 | 14.472 | 14.147 | 16.67 | 28.01 |
| 03 48 48.46 | 21 59 00.3 | 16.514 | 15.869 | 15.332 | 14.779 | 14.470 | 18.96 | 3.15 |
| 03 49 11.59 | 24 26 17.5 | 16.030 | 15.415 | 14.930 | 14.412 | 14.078 | 35.55 | 81.10 |
| 03 49 12.12 | 23 12 55.9 | 16.821 | 16.077 | 15.427 | 14.815 | 14.414 | 67.42 | 4.88 |
| 03 50 03.94 | 24 56 02.9 | 16.179 | 15.630 | 15.102 | 14.494 | 14.124 | 6.50 | 42.38 |
| 03 50 15.55 | 26 06 30.1 | 16.821 | 16.081 | 15.407 | 14.810 | 14.390 | 45.38 | 60.60 |
| 03 51 04.04 | 24 32 57.9 | 16.032 | 15.447 | 14.981 | 14.371 | 14.053 | 83.02 | 39.72 |
| 03 51 09.72 | 25 18 52.4 | 16.705 | 15.956 | 15.399 | 14.872 | 14.515 | 8.24 | 31.78 |
| 03 51 10.52 | 22 48 14.5 | 16.717 | 16.031 | 15.451 | 14.754 | 14.406 | 9.03 | 22.58 |
| 03 51 27.90 | 22 48 12.9 | 16.073 | 15.332 | 14.720 | 14.081 | 13.693 | 24.54 | 5.16 |
| 03 51 38.18 | 23 03 11.2 | 16.859 | 16.116 | 15.533 | 14.952 | 14.580 | 8.79 | 0.54 |
| 03 52 07.88 | 23 59 13.1 | 16.135 | 15.284 | 14.620 | 14.057 | 13.620 | 22.45 | 86.80 |
| 03 52 17.49 | 22 51 01.9 | 16.583 | 15.973 | 15.412 | 14.759 | 14.389 | 8.79 | 3.35 |
| 03 53 48.72 | 25 04 20.1 | 16.729 | 16.213 | 15.240 | 15.098 | 14.797 | 3.44 | 18.98 |
| 03 53 59.92 | 23 41 00.3 | 16.175 | 15.572 | 15.052 | 14.450 | 14.115 | 5.34 | 13.33 |
| 03 54 17.46 | 23 11 56.9 | 16.131 | 15.574 | 15.017 | 14.432 | 14.088 | 9.91 | 5.36 |
| 03 54 39.33 | 23 03 12.4 | 16.394 | 15.588 | 14.992 | 14.444 | 14.053 | 10.21 | 1.55 |
| 03 54 40.56 | 23 42 23.7 | 16.106 | 15.547 | 15.060 | 14.425 | 14.155 | 7.21 | 4.10 |
| 03 54 46.11 | 23 00 20.6 | 17.017 | 16.309 | 15.704 | 15.103 | 14.741 | 26.85 | 1.64 |
| 03 54 54.51 | 22 50 21.5 | 16.403 | 15.752 | 15.216 | 14.651 | 14.338 | 0.85 | 0.54 |
| 03 55 14.72 | 22 42 08.5 | 16.637 | 15.962 | 15.384 | 14.731 | 14.381 | 23.51 | 12.75 |
| 03 55 30.07 | 23 54 53.5 | 16.466 | 15.829 | 15.296 | 14.788 | 14.421 | 7.60 | 1.05 |
Appendix C Table of faint photometric non-members in the Pleiades extracted from the UKIDSS GCS DR1
| R.A. | Dec. | |||||||
|---|---|---|---|---|---|---|---|---|
| 03 41 31.46 | 23 05 12.3 | 18.520 | 19.416 | 16.757 | 16.269 | 16.179 | — | — |
| 03 41 36.55 | 22 41 01.7 | 16.248 | 15.641 | 15.136 | 14.585 | 14.250 | 35.42 | 33.96 |
| 03 42 27.94 | 25 25 20.0 | 19.822 | 19.332 | 17.711 | 17.062 | 16.874 | — | — |
| 03 43 12.21 | 23 09 16.6 | 18.540 | 17.489 | 16.670 | 16.022 | 15.589 | — | — |
| 03 43 52.03 | 22 55 24.5 | 18.874 | 17.727 | 16.970 | 16.272 | 15.782 | — | — |
| 03 44 12.68 | 25 24 35.1 | 18.058 | 17.144 | 16.455 | 15.949 | 15.527 | — | — |
| 03 45 33.16 | 25 34 30.0 | 18.079 | 17.112 | 16.422 | 15.843 | 15.381 | — | — |
| 03 46 04.92 | 22 15 40.2 | 17.386 | 16.555 | 15.899 | 15.246 | 15.018 | — | — |
| 03 47 46.15 | 25 21 42.3 | 19.444 | 18.280 | 17.382 | 16.876 | 16.331 | — | — |
| 03 48 19.02 | 24 25 12.8 | 17.666 | 16.597 | 15.972 | 15.375 | 14.951 | 19.35 | 34.91 |
| 03 48 49.03 | 24 20 25.3 | 19.165 | 18.125 | 17.229 | 16.543 | 16.037 | — | — |
| 03 48 58.61 | 23 37 03.9 | 19.567 | 18.221 | 17.389 | 16.735 | 16.231 | — | — |
| 03 49 21.17 | 23 34 02.0 | 18.409 | 17.353 | 16.637 | 16.030 | 15.530 | — | — |
| 03 49 48.77 | 23 42 59.4 | 19.147 | 18.083 | 17.235 | 16.608 | 16.099 | — | — |
| 03 49 51.23 | 25 26 06.6 | 19.698 | 18.476 | 17.608 | 17.059 | 16.494 | — | — |
| 03 50 15.33 | 24 35 40.4 | 16.124 | 15.521 | 15.070 | 14.470 | 14.175 | 8.32 | 22.94 |
| 03 51 37.72 | 25 42 46.6 | 19.070 | 17.672 | 16.338 | 15.428 | 14.640 | — | — |
| 03 51 59.93 | 23 24 25.6 | 19.627 | 18.336 | 17.387 | 16.694 | 16.250 | — | — |
| 03 52 13.44 | 24 28 52.3 | 20.026 | 18.527 | 17.772 | 17.224 | 16.643 | — | — |
| 03 52 46.44 | 24 24 16.9 | 19.536 | 18.447 | 17.533 | 16.955 | 16.317 | — | — |
| 03 53 26.55 | 24 46 44.9 | 16.022 | 15.487 | 14.996 | 14.417 | 14.107 | 2.92 | 47.58 |
| 03 54 55.92 | 24 37 43.0 | 20.857 | 19.356 | 18.324 | 17.897 | 17.734 | — | — |
| 03 55 39.58 | 24 12 51.1 | 20.442 | 19.165 | 17.853 | 17.285 | 16.634 | — | — |
| 03 55 42.01 | 22 57 01.4 | 18.624 | 17.246 | 15.954 | 14.995 | 14.189 | — | — |
Appendix D Table of faint candidates in the Pleiades extracted from the UKIDSS GCS DR1.
| R.A. | Dec. | Memb? | ||||||
|---|---|---|---|---|---|---|---|---|
| 03 42 14.28 | 22 43 02.5 | 19.977 | 18.526 | 18.017 | 17.482 | — | — | photNM |
| 03 42 59.30 | 25 37 39.1 | 19.727 | 18.241 | 17.367 | 16.647 | — | — | Memb |
| 03 44 30.52 | 24 21 17.4 | 19.458 | 18.396 | 17.684 | 17.301 | — | — | dubious |
| 03 44 31.28 | 25 35 14.8 | 19.336 | 18.282 | 17.394 | 16.658 | 13.96 | 39.80 | Memb |
| 03 44 47.32 | 24 21 35.8 | 19.553 | 18.411 | 17.477 | 16.898 | — | — | photNM |
| 03 45 01.81 | 24 04 17.8 | 20.431 | 19.025 | 18.800 | 18.030 | — | — | dubious |
| 03 45 11.56 | 23 25 35.1 | 20.233 | 18.911 | 18.104 | 17.485 | — | — | photNM |
| 03 45 33.30 | 23 34 34.3 | 19.576 | 18.130 | 17.182 | 16.485 | 13.67 | 9.64 | PM_NM |
| 03 45 35.06 | 21 56 22.3 | 19.364 | 18.168 | 17.575 | 17.114 | 11.06 | 1.62 | PM_NM |
| 03 46 27.94 | 23 42 38.9 | 19.681 | 18.570 | 17.708 | 17.437 | 8.48 | 26.82 | PM_NM |
| 03 46 29.11 | 22 59 47.7 | 18.992 | 17.740 | 16.768 | 15.924 | — | — | Memb |
| 03 46 51.05 | 22 34 28.9 | 19.779 | 18.581 | 18.075 | 17.292 | — | — | dubious |
| 03 47 33.15 | 23 36 32.6 | 19.210 | 17.894 | 18.063 | 16.898 | — | — | dubious |
| 03 47 38.47 | 23 56 27.7 | 19.827 | 18.334 | 17.435 | 16.661 | — | — | Memb |
| 03 47 44.16 | 24 57 24.1 | 20.088 | 18.692 | 17.877 | 17.246 | — | — | photNM |
| 03 47 46.52 | 24 55 46.6 | 19.426 | 18.247 | 17.398 | 16.590 | — | — | Memb |
| 03 48 05.47 | 21 57 31.2 | 20.043 | 18.753 | 17.929 | 17.311 | — | — | photNM |
| 03 48 15.64 | 25 50 09.0 | 19.785 | 18.497 | 17.631 | 16.758 | 25.82 | 44.45 | Memb |
| 03 48 39.56 | 23 56 11.7 | 20.619 | 19.223 | 18.728 | 18.153 | — | — | photNM |
| 03 49 17.16 | 23 19 42.8 | 19.726 | 18.548 | 17.657 | 16.738 | — | — | Memb |
| 03 49 28.92 | 23 22 49.1 | 19.975 | 18.385 | 18.095 | 16.706 | — | — | dubious |
| 03 50 15.96 | 24 23 28.7 | 20.017 | 18.711 | 17.774 | 16.887 | — | — | Memb |
| 03 50 39.54 | 25 02 54.7 | 19.677 | 18.208 | 17.331 | 16.565 | — | — | Memb |
| 03 51 29.47 | 24 00 37.4 | 19.610 | 18.412 | 17.463 | 16.696 | 25.57 | 44.48 | Memb |
| 03 51 41.62 | 25 55 45.4 | 20.484 | 19.107 | 18.453 | 18.047 | — | — | photNM |
| 03 52 05.33 | 25 37 34.0 | 18.874 | 17.699 | 17.937 | 17.520 | — | — | dubious |
| 03 52 27.18 | 23 12 08.1 | 19.216 | 18.005 | 17.069 | 16.351 | 1.58 | 9.79 | PM_NM |
| 03 52 34.75 | 22 56 04.5 | 19.524 | 18.437 | 17.554 | 17.070 | — | — | photNM |
| 03 52 39.15 | 24 46 29.5 | 19.189 | 18.069 | 17.098 | 16.486 | 1.52 | 33.36 | Memb |
| 03 52 59.62 | 24 42 35.6 | 20.584 | 19.093 | 18.681 | 18.220 | — | — | dubious |
| 03 53 18.93 | 23 12 39.1 | 19.959 | 18.327 | 17.604 | 16.880 | — | — | photNM |
| 03 54 10.28 | 23 41 40.1 | 19.156 | 18.124 | 17.141 | 16.377 | 7.50 | 27.69 | Memb |
| 03 54 30.49 | 25 11 21.8 | 19.884 | 18.657 | 18.116 | 17.519 | — | — | photNM |
| 03 54 49.89 | 24 16 23.4 | 19.451 | 18.279 | 18.241 | 17.260 | — | — | dubious |
| 03 55 08.18 | 23 58 08.7 | 19.528 | 18.388 | 17.863 | 17.393 | — | — | dubious |
Appendix E Table of faint candidates in the Pleiades extracted from the UKIDSS GCS DR1.
| R.A. | Dec. | Memb? | |||||
|---|---|---|---|---|---|---|---|
| 03 50 41.16 | 25 44 24.2 | 18.776 | 17.580 | 16.556 | 15.09 | 16.61 | dubious |
| 03 48 32.69 | 25 06 05.1 | 18.539 | 17.993 | 17.412 | 15.82 | 12.52 | dubious |
| 03 55 57.94 | 24 41 41.6 | 18.876 | 18.173 | 18.215 | 2.06 | 0.57 | dubious |
| 03 55 15.80 | 24 49 32.6 | 17.727 | 17.004 | 16.698 | 8.77 | 8.36 | dubious |
| 03 51 35.09 | 24 03 36.9 | 18.247 | 17.319 | 16.492 | 9.06 | 25.29 | dubious |
| 03 54 47.20 | 23 56 48.0 | 18.845 | 18.429 | 18.556 | 19.94 | 10.38 | dubious |
| 03 55 45.48 | 23 51 25.5 | 18.855 | 18.416 | 18.242 | 2.55 | 6.91 | dubious |
| 03 54 13.41 | 23 32 22.2 | 18.674 | 18.123 | 18.104 | 23.27 | 2.48 | dubious |
| 03 45 35.26 | 23 36 39.6 | 18.898 | 18.388 | 18.123 | 17.73 | 5.33 | dubious |
| 03 44 19.50 | 22 39 03.5 | 18.718 | 18.342 | 17.709 | 30.75 | 16.71 | dubious |
| 03 42 43.46 | 22 38 31.5 | 18.301 | 17.735 | 17.398 | 4.35 | 0.25 | dubious |
| 03 43 24.88 | 22 50 22.2 | 18.018 | 17.310 | 17.065 | 0.25 | 1.76 | dubious |
| 03 52 47.30 | 22 38 42.4 | 17.579 | 16.773 | 15.969 | 13.24 | 0.48 | dubious |
| 03 52 54.90 | 24 37 18.2 | 18.798 | 17.742 | 16.922 | 14.70 | 44.77 | Memb |
| 03 40 30.34 | 25 58 26.0 | 18.856 | 18.271 | 17.747 | 28.78 | 5.64 | PM_NM |
| 03 47 51.19 | 25 26 57.9 | 18.200 | 17.745 | 17.611 | 28.59 | 6.22 | PM_NM |
Appendix F Table of low-mass multiple system candidates in the Pleiades extracted from the UKIDSS GCS DR1.
| R.A. | Dec. | Mass | q | |||||||
|---|---|---|---|---|---|---|---|---|---|---|
| 03 41 40.90 | 25 54 24.1 | 16.829 | 15.900 | 15.173 | 14.562 | 14.114 | 23.78 | 37.48 | 60+60 | 1.00 |
| 03 41 54.16 | 23 05 04.8 | 17.336 | 16.297 | 15.499 | 14.912 | 14.385 | 10.66 | 24.90 | 55+55 | 1.00 |
| 03 42 07.99 | 22 39 33.5 | 18.717 | 17.397 | 16.515 | 15.809 | 15.191 | — | — | 40+35 | 0.87 |
| 03 42 59.92 | 22 42 51.5 | 16.067 | 15.267 | 14.666 | 14.109 | 13.708 | 25.70 | 41.46 | — | 0.00 |
| 03 43 34.48 | 25 57 30.6 | 16.471 | 15.605 | 14.888 | 14.322 | 13.896 | 9.23 | 40.49 | 70+70 | 1.00 |
| 03 44 22.14 | 23 10 54.8 | 15.753 | 15.130 | 14.495 | 13.890 | 13.503 | 19.04 | 39.79 | — | 0.00 |
| 03 44 23.24 | 25 38 44.9 | 16.288 | 15.349 | 14.692 | 14.133 | 13.744 | 16.08 | 28.17 | — | 0.00 |
| 03 44 35.16 | 25 13 42.8 | 17.567 | 16.482 | 15.651 | 14.979 | 14.439 | 21.14 | 39.28 | 50+50 | 1.00 |
| 03 44 35.90 | 23 34 42.0 | 16.224 | 15.551 | 14.991 | 14.369 | 13.973 | 21.72 | 32.67 | — | 0.00 |
| 03 45 09.46 | 23 58 44.7 | 16.820 | 16.099 | 15.417 | 14.830 | 14.382 | 30.39 | 47.73 | 65+40 | 0.62 |
| 03 45 31.37 | 24 52 47.5 | 17.246 | 16.226 | 15.471 | 14.842 | 14.329 | 19.65 | 30.23 | 55+55 | 1.00 |
| 03 45 37.76 | 23 43 50.1 | 16.129 | 15.320 | 14.710 | 14.149 | 13.731 | 28.02 | 41.71 | — | 0.00 |
| 03 45 41.27 | 23 54 09.8 | 17.039 | 16.055 | 15.345 | 14.761 | 14.281 | 15.29 | 42.72 | 70+40 | 0.57 |
| 03 45 50.66 | 24 09 03.5 | 17.352 | 16.451 | 15.692 | 15.060 | 14.569 | 17.66 | 53.57 | 60+35 | 0.58 |
| 03 46 02.52 | 23 45 33.2 | 18.077 | 17.254 | 16.460 | 15.458 | 15.012 | — | — | 40+40 | 1.00 |
| 03 46 03.75 | 23 44 35.6 | 18.074 | 17.137 | 16.410 | 15.528 | 15.040 | — | — | 40+40 | 1.00 |
| 03 46 08.02 | 23 45 35.5 | 18.787 | 17.829 | 16.857 | 15.832 | 15.324 | — | — | 35+35 | 1.00 |
| 03 46 10.23 | 21 52 55.8 | 16.114 | 15.233 | 14.572 | 13.948 | 13.547 | 36.60 | 41.94 | — | 0.00 |
| 03 46 22.25 | 23 52 26.6 | 17.013 | 16.179 | 15.526 | 14.879 | 14.440 | 16.52 | 39.19 | 65+40 | 0.65 |
| 03 46 26.09 | 24 05 09.5 | 16.660 | 15.824 | 15.127 | 14.561 | 14.097 | 17.99 | 40.76 | 60+60 | 1.00 |
| 03 46 27.10 | 21 48 22.6 | 19.764 | 18.557 | 17.387 | 16.557 | 15.845 | — | — | 30+30 | 1.00 |
| 03 46 29.11 | 22 59 47.7 | 99.999 | 18.992 | 17.740 | 16.768 | 15.924 | — | — | — | 0.00 |
| 03 46 40.94 | 22 22 38.2 | 19.193 | 18.048 | 16.910 | 16.151 | 15.495 | — | — | 35+30 | 0.86 |
| 03 46 48.56 | 23 09 57.6 | 16.434 | 15.709 | 15.087 | 14.515 | 14.078 | 20.25 | 36.11 | — | 0.00 |
| 03 46 50.03 | 24 00 23.6 | 17.295 | 16.335 | 15.594 | 14.987 | 14.502 | 18.70 | 36.10 | 60+40 | 0.62 |
| 03 46 51.82 | 23 23 09.4 | 19.574 | 18.324 | 17.182 | 16.399 | 15.647 | — | — | 30+30 | 1.00 |
| 03 47 02.35 | 23 32 36.0 | 15.568 | 14.861 | 14.294 | 13.715 | 13.320 | 20.44 | 42.56 | — | 0.00 |
| 03 47 11.79 | 24 13 31.3 | 16.182 | 15.444 | 14.805 | 14.234 | 13.860 | 9.97 | 28.34 | — | 0.00 |
| 03 48 04.67 | 23 39 30.2 | 16.964 | 15.939 | 15.294 | 14.683 | 14.256 | 21.59 | 29.33 | 65+50 | 0.77 |
| 03 48 31.52 | 24 34 37.3 | 19.163 | 17.784 | 16.727 | 15.964 | 15.343 | 18.05 | 39.05 | 35+35 | 1.00 |
| 03 50 13.39 | 23 59 29.8 | 20.404 | 19.093 | 17.845 | 16.892 | 16.205 | — | — | 30+20 | 0.67 |
| 03 51 38.96 | 24 30 44.8 | 18.723 | 17.316 | 16.408 | 15.702 | 15.148 | 18.71 | 41.66 | 40+35 | 0.87 |
| 03 52 51.79 | 23 33 48.0 | 15.881 | 15.353 | 14.807 | 14.114 | 13.761 | 21.92 | 43.64 | — | 0.00 |
| 03 53 23.13 | 23 19 20.4 | 17.768 | 16.798 | 15.963 | 15.327 | 14.818 | — | — | 50+35 | 0.70 |
| 03 55 12.61 | 23 17 37.3 | 17.758 | 16.765 | 15.962 | 15.330 | 14.835 | — | — | 50+35 | 0.70 |
| 03 55 27.06 | 25 14 45.8 | 16.048 | 15.299 | 14.643 | 14.046 | 13.659 | 22.98 | 39.83 | — | 0.00 |