First CO J=6–5, 4–3 detections in local ULIRGs: the dense gas in Mrk 231, and its cooling budget
Abstract
We report on detections of the high-excitation CO J=6–5, J=4–3 lines in Mrk 231, a prototypical Ultra Luminous Infrared Galaxy (ULIRG) and Seyfert 1 QSO. These observations are combined with CO J=3–2, HCN J=4–3 (this work), and CO J=2–1, J=1–0, 13CO J=2–1, HCN J=1–0 measurements taken from the literature to provide better constraints on the properties of the molecular gas in an extreme starburst/QSO in the local Universe. We find that the CO J=4–3 and J=6–5 transitions trace a different gas phase from that dominating the lower three CO transitions, with and . This phase is responsible for the luminous HCN emission, and contains most of the H2 gas mass of this galaxy. The total CO line cooling emanating from this dense phase is found similar to that of the [C ii] line at , suggesting a very different thermal balance to that seen in lower IR-luminosity galaxies, and one likely dominated by dense photon-dominated regions. Our dense “sampling” of the CO rotational ladder and the HCN lines enables us to produce well-constrained Spectral Line Energy Distributions (SLEDs) for the dense molecular gas in Mrk 231 and compare them to those of high redshift starbursts, many of which have SLEDs that may be affected by strong lensing. Finally, we use our local molecular line excitation template to assess the capabilities of future cm and mm/sub-mm arrays in detecting CO and HCN transitions in similar systems throughout the local and distant Universe.
1 Introduction
Luminous and Ultraluminous Infrared Galaxies ((U)LIRGs) represent a truly remarkable class of objects. With far-infrared luminosities of , these galaxies emit a significant fraction of their total bolometric luminosity at infrared wavelengths (Soifer et al. 1986; Sanders 1989). Although these rapidly evolving and often merging objects are frequently hosts of both powerful starbursts and AGN (Sanders & Mirabel 1996), there is increasing observational evidence to suggest that most of this IR and FIR emission is produced by extreme star formation events (Genzel et al. 1998, Downes & Solomon 1998). Observations suggest that the evolutionary track followed by ULIRGs once their molecular gas supply is exhausted will likely be towards field elliptical/lenticular galaxies of moderate mass (Genzel et al. 2001; Tacconi et al. 2002), rather than towards hosts of optically bright QSOs as originaly suggested by Sanders et al. (1988).
Several studies of the molecular gas have been made since its ubiquitous presence in (U)LIRGs was first established (Tinney et al. 1990; Sanders, Scoville & Soifer 1991; Solomon et al. 1997; see Sanders 1997 for a review). Intense far-UV radiation and strong tidal fields in these merging/starburst objects are likely to be responsible for the differing physical properties of the molecular gas relative to those prevailing in lower-power starbursts (Aalto et al. 1991, 1995; Casoli, Dupraz & Combes 1991), while interferometer maps reveal compact ( kpc) CO-emitting regions (Bryant 1997; Downes & Solomon 1998; Bryant & Scoville 1998). A large fraction of the total molecular gas mass in these objects is in a warm, dense gas phase (Solomon, Radford, & Downes 1990; Solomon, Downes, & Radford 1992a), and the same type of gas may be also responsible for the bright high-excitation CO lines detected in several dust-enshrouded and more luminous starbursts and QSOs () at high redshifts over the last decade (see Solomon & Vanden Bout 2005 for a review).
Detections of high-excitation CO transitions such as J=4–3 and J=6–5 in local galaxies were first made in the early 1990s (e.g., Harris et al. 1991, Wild et al. 1992, Güsten et al. 1993). Poor atmospheric transmission under all but the very best observing conditions has prevented systematic surveys of these transitions in galaxies other than in local, compact ( pc) and low luminosity () starbursts such as M 82 (White et al. 1994; Mao et al. 2000, Wild et al. 1993, Ward et al. 2003), and the centers of a few nearby spirals (Nieten et al. 1999). The lack of large-format array receivers at these frequencies makes imaging of high excitation CO transitions difficult except with special instrumentation (Fixsen, Bennett, & Mather 1999; Kim et al. 2002). This is unfortunate since, when combined with lower-J CO and 13CO transitions, CO J=4–3, J=6–5 line emission with K, and critical densities of and , can provide excellent diagnostics of the excitation conditions of the molecular gas.
To fill this gap, we initiated a multi-transition CO, 13CO and HCN survey of LIRGs with which to undertake a detailed study of their molecular gas component, with particular emphasis on the warm and dense phase fueling their prodigious star formation rates. In this paper we report on the principal result of the ULIRG/QSO Mrk 231, the first galaxy in our sample for which multi-transition observations have been completed. We present an assesssment of the physical conditions of its molecular gas reservoir based on an LVG analysis, which we then use to compute the cooling budget of the reservoir and to construct CO and HCN Spectral Line Energy Distributions (hereafter SLEDs). We compare the Mrk231 SLEDs to the typically poorly constrained SLEDs of high-z starbursts, and use them to assess the capabilities of both future cm/mm interferometers and ESA’s high frequency spaceborne observatory Herschel in detecting these important line diagnostics in starbursts in the distant Universe. Throughout this work we assume a flat -dominated cosmology with km s-1 Mpc-1 and .
2 Observations and results
The 15-meter James Clerk Maxwell Telescope (JCMT)111The James Clerk Maxwell telescope is operated by the Joint Astronomy Centre on behalf of the Science and Technology Facilities Council of the United Kingdom, the Netherlands Organisation for Scientific Research and the National Research Council of Canada. on Mauna Kea in Hawaii was used for observations of the CO J=6–5, CO J=4–3, CO J=3–2 and HCN J=4–3 transitions in the archetypal ULIRG/QSO Mrk 231. These observations are part of our large and ongoing CO, 13CO and HCN line survey of 30 LIRGs () which is being undertaken using the JCMT and the IRAM 30-m telescope (see Papadopoulos et al. 2007 for a description).
2.1 The CO J=6–5, 4–3 observations
Receiver W at D-band (620-710 GHz) was used on February 20, 2005 in SSB mode to observe the CO J=6–5 line ( ) under excellent atmospheric conditions (), with typical system temperatures of (including atmospheric absorption). The Digital Autocorrelation Spectrometer (DAS) was deployed in wideband-mode (1.8 GHz), with a resulting instantaneous bandwidth of which was more than sufficient to cover the full width of the CO line (). Rapid beam switching with a chop frequency of 1-2 Hz and a beam throw of 60′′ (in Az) yielded flat baselines after a total of 2 hours of integration (on+off). Pointing at D-band is complicated by the paucity of suitably bright, compact pointing sources. Differential pointing was therefore employed using a combination of B-band (330-360 GHz, B3 receiver) and D-band measurements, with the relative pointing offsets of the two different receivers determined prior to the observing run. Initial pointing and focus checks were made using Jupiter which, at the time of the observations, had a semi-diameter of – we note that pointing using sources that are extended relative to the primary beam has been shown to work well at these high frequencies. Pointing checks with B3 were made prior to, and during our observations, and were applied to the telescope pointing model for D-band, resulting in a typical rms scatter in the latter of . The CO J=4–3 line () was observed with receiver W tuned to SSB mode in C-band (430-510 GHz) on April 23 2005. Dry conditions () yielded typical system temperatures of . A DAS bandwidth of 920 MHz () was used, which was sufficient to cover the line with ample margin for baseline subtraction. Beam switching at 1-2 Hz with a beam throw of 30′′ (Az) produced excellent flat baselines after a total of 40 mins (on+off) of observations. Pointing checks were again differential, with an rms uncertainty of .
Estimates of the aperture efficiencies at both frequencies were made from repeated observations of Mars, resulting in a value of (for ) which is consistent within with values reported by others for the same observing period.222http://www.jach.hawaii.edu/JCMT/spectral_line/Standards/eff_web.html The scarcity of measurements at 691 GHz did not allow such comparisons and so we adopted the mean value, , of our two measurements ( from a Mars beam map). This value has a larger uncertainty – of around 30% – due to larger calibration uncertainties as well as the effects of thermal distortions/mechanical deformations of the dish affecting high-frequency observations even on prime sub-mm telescopes such as the JCMT.
2.2 The CO J=3–2 and HCN J=4–3 observations
The CO J=3–2 (345.7960 GHz) and HCN J=4–3 (354.5054 GHz) observations were made on July 10th 1999 (CO) and January 26th 2005, January 17th 2006 (HCN), with receiver B3 tuned in SSB mode with effective system temperatures of and respectively. A DAS configuration with GHz bandwidth was used for CO J=3–2 (), whilst a narrower-band 920 MHz/dual-channel mode was used for HCN J=4–3 () for increased sensitivity. Beam switching at 1 Hz and a chop throw of 60′′ (Az) was employed in both cases, giving flat baselines for total integration times of 20 min (CO) and 4 hours (HCN). A number of aperture efficiency measurements were made using Mars, yielding (for ). Frequent pointing checks were made by observing strong sources in both continuum and spectral line mode, yielding an rms uncertainty of for the pointing model residuals. Finally, observations of strong spectral line standards such as IRC 10216, OMC1, W75N and W3(OH) were used to verify the amplitude calibration, to estimate calibration uncertainties (), and to monitor the overall performance of the telescope.
2.3 Data reduction, results
All data were reduced using the JCMT spectral line reduction package SPECX. Zero-order baselines were removed and spectra inspected individually, prior to being co-added to produce the final spectra shown in Figs. 1 and 2, where an excellent line profile agreement, with a , is evident for all the transitions observed. The velocity-integrated line flux densities were estimated from these spectra using
| (1) |
where the term , with and =source diameter, accounts for the geometric coupling of the gaussian component of the beam with a finite-sized, disk-like source. For Mrk 231 we have used a value of (likely to be even smaller for the high-J CO transitions and the HCN emission), obtained from interferometric observations of CO J=1–0 (Downes & Solomon 1998), yielding an upper limit of in the case of the CO J=6–5 line. The line fluxes obtained from observations presented in this paper, those extracted from observations reported in the literature and brightness temperature line ratios are listed in Tables 1 and 2.
2.3.1 CO J=1–0 line flux: single dish versus interferometers
It can be seen from Table 1 that, with the exception of a single measurement by Krügel et al., all CO J=1–0 single dish measurements are in good agreement with oneanother, but that they are higher than those obtained using interferometers (which are, in turn, good agreement among themselves). The difference between the average of all the single dish data and that of the two interferometric measurements is significant at a level. If confirmed at a higher significance level, this discrepancy may result from the presence of a colder and more extended gas phase that is missed in typical interferometer maps because of its low brightness (and the resulting low S/N per beam), rather than the lack of short baselines. The dust content of such a gas phase, present even in some luminous starburst/QSOs, has been detected via its sub-mm continuum emission (e.g. Papadopoulos & Seaquist 1999a), where dust with , concomitant with HI and low surface brightness CO J=1–0 emission has been found. Sub-mm continuum imaging and multi-transition CO observations of LIRGs have shown that unless one has sufficient angular resolution to separate the warm, star-forming gas and dust from the typically, more extended non star-forming phase, the global dust continuum and CO line ratios will be dominated by the warm gas (e.g., Papadopoulos & Allen 2000). In this paper we assume that such an extended phase of non star-forming molecular gas is not present in Mrk 231.
3 The state of the molecular gas in Mrk 231
The combination of the large number of CO and HCN line detections for the ULIRG/QSO Mrk 231 (Table 2) and the upper limit on the (J=2–1) line ratio of (Glenn & Hunter 2001) offers an excellent opportunity to place strong constraints on the state of its molecular gas, with emphasis on the dense gas phase. To do this, we used a Large Velocity Gradient (LVG) code, based on work by Richardson 1985, that searches a large grid of values, where (, : cloud velocity gradient, X: the molecule used) and locates the minima, where and are observed and model line ratios, and is the measurement uncertainty. A parameter space of , , and an range corresponding to (for the standard CO and HCN abundances) was searched, where
| (2) |
(e.g. Papadopoulos & Seaquist 1999b; Goldsmith 2001) indicates whether a virialized gas phase ( within factors of 2-3), or a non-virialized one () is responsible for the molecular line emission ( depending on the assumed cloud density profile, Bryant & Scoville 1996). Strictly speaking, values of are not physical (i.e. gas motions cannot be slower than those dictated by self-gravity), however they can be used to indicate the possibility of enhanced molecular abundances instead (so that the revised can reach at least ). Additional constraints to the modelling are provided from estimates of the dust temperature – (Glenn & Hunter 2001; Gao & Solomon 2004a) – and the assumption that photoelectric and/or turbulent gas heating (and its cooling via atomic/molecular lines rather than continuum emission) results in (e.g. Wilson et al. 1982; Tielens & Hollenbach 1999). The chosen range for therefore encompasses that expected for the molecular gas in Mrk 231, with the temperature of C+-cooled, Cold Neutral Medium HI gas setting its upper limit.
The results of single-phase modeling make it clear that the CO J=4–3 and J=6–5 trace a different gas phase from that traced by the J=1–0, 2–1, 3–2 transitions, i.e. we find no region of the parameter space compatible with both the observed values of , , , and the high ratio ( over the entire parameter space). The LVG solutions derived solely from , and converge to , (best fit when , and for ; ), and (for ). This warm, non-virialised, gas phase with is typically found in ULIRGs, a possible result of strongly evolving dynamical and far-UV-intense environments (Aalto et al. 1995), but has expected ratios of and , which are (for ) to (for ) times lower than those observed in Mrk 231. This result is illustrated in Fig. 3, where we show the observed CO line luminosities (in solar units) together with the values expected from the best-fitting LVG model derived from the lowest three CO lines and the 13CO line only. The fluxes of the high- lines far exceed the values predicted from this model, demonstrating the presence of a distinct gas component, the emission from which dominates the observed line fluxes.
3.1 The dense gas phase
The presence of a massive gas phase in Mrk 231 that is much denser than that dominating the low-J CO line emission can be inferred from its luminous HCN J=1–0 line which makes this galaxy stand out even amongst ULIRGs as the one with the highest HCN/CO J=1–0 luminosity ratio (, Solomon et al. 1992a). The detection of HCN J=4–3 () certainly corroborates this, however a single line is not sufficient to point uniquely to the presence of gas with . Much lower densities are still possible if sub-thermal excitation and/or radiative trapping (due to their considerable optical depths) were to be significant. Intensity ratios of widely-spaced HCN transitions are excellent probes of the dense star-forming gas, and provide the key to differentiating between different excitation processes, revealing a considerable range of properties even in starbursts with similar FIR and low-J CO luminosities (Jackson et al. 1995; Paglione, Jackson, & Ishizuki 1997).
The ratio measured in Mrk 231 indicates a sub-thermally excited HCN J=4–3 line which is well below that of Arp 220 (; Greve et al. 2006), another archetypal ULIRG often used as a typical template for high-z starbursts. The physical conditions compatible with the dense-gas-dominated and HCN(1–0)/CO(6–5) () brightness temperature ratios were explored with our LVG code using HCN collisional rates for the first 11 levels taken from the Leiden Atomic and Molecular Database LAMDA.333http://www.strw.leidenuniv.nl/moldata/ The value of helps discriminate over the considerable range of conditions compatible solely with , while two additional constraints can be set by a) assuming that the HCN emission emanates from virialized gas “cells” (; as is the case for the dense star-forming gas in the Galaxy), and b) by stipulating that . The best solution ranges found are those with and (see Table 3), though the latter satisfies only for a times higher abundance than that considered typical for the Milky Way. In starburst environments values of may be possible because of a higher ionization fraction of the molecular gas (Lepp & Dalgarno 1996), or higher C, C+ abundances (which favor HCN production, Boger & Sternberg 2005) deeper inside molecular clouds caused by a more vigorous turbulent diffusion of their atom-rich outer layers inwards.
The mass of the HCN-emitting gas phase can be estimated in a manner similar to that used to determine the total molecular gas mass (using the 12CO J=1–0 line), since the same arguments about line emission from an ensemble of self-gravitating, non-shadowing (in space or velocity), clouds apply. Following Gao & Solomon (2004a),
| (3) |
where and are the area/velocity-averaged brightness temperature and the line luminosity of an optically thick HCN J=1–0 line (the case for all solutions in Table 3). For the two sets of conditions that best fit the dense gas line ratios, the coefficient in the equation above becomes (for ) and (for ).
The HCN J=1–0 luminosity of Mrk 231 is estimated using
| (4) |
where and are the total linewidth and the area of the emitting source (where in this case x=HCN(1–0)) respectively. Substituting and converting to astrophysically useful units yields
| (5) |
For (z=0.042)=183.4 Mpc and (HCN J=1–0) the HCN J=1–0 velocity-integrated flux density (Table 2) yields . For the range of values derived previously, this corresponds to , while the total H2 gas mass estimated from the CO J=1–0 line luminosity of (, and the CO J=1–0 flux in Table 2), and a standard Galactic conversion factor of , is . Thus, at least and maybe all of the molecular gas mass in the ULIRG/QSO Mrk 231 is dense (), quite unlike the state of the bulk of the molecular gas in our Galaxy and in low intensity starbursts where (e.g. Paglione et al. 1997; Weiss, Walter, & Scoville 2005).
The dynamical mass within a radius of , estimated from high-resolution CO images, is (Downes & Solomon 1998, corrected for the adopted cosmology). Thus, either all that mass is molecular gas, or is overestimated by adopting an factor. Extensive studies of ULIRGs suggest the latter because in these extreme systems the molecular gas phase encompasses significant amounts of non-gaseous mass (i.e. stars) and thus one of the main assumptions underlying a standard Galactic factor (that of an ensemble of self-gravitating molecular clouds) breaks down. These studies find (Solomon 1997; Downes & Solomon 1998), which for Mrk 231 yields , making it times smaller than estimated from Equation 3. This is clearly impossible, and argues for a revision also of the values derived from Equation 3. Such a revision can be understood in much the same terms underlying that of the factor, since the dense gas phase seems responsible for both HCN and most of the CO J=1–0 line emission. It must be noted that this is not done for many HCN-deduced dense gas masses in ULIRGs reported in the literature (e.g. Solomon et al. 1992a) and thus these could be systematically overestimated by a factor of 5.
Interestingly, by adopting the same correction factor of for yields for Mrk 231 which, for its starburst-related IR luminosity of (Downes & Solomon 1998) and (Sanders et al. 2003), raises the star formation efficiency to , effectively bracketing the maximum value of expected from O, B, star radiation-feedback effects on the accreted dust/gas in star-forming GMCs (Scoville 2004). These may therefore be the hallmark features of the star-forming molecular gas phase in galaxies – densities of , and star formation efficiencies of – which in Mrk 231 amounts to most of its molecular gas mass.
3.2 The diffuse gas phase
Unlike the HCN J=1–0, 4–3, and CO J=6–5 line emission which are dominated by the dense gas, the lower-J CO lines have contributions also from a diffuse phase. The observed CO (6–5)/(1–0) line ratio can then be expressed as
| (6) |
where expresses the contribution of emission from the dense phase (b) to that from a diffuse and more extended phase (a), with being their relative geometric filling factor, and their CO J=1–0 brightness temperatures (all quantities are velocity/area averages). All other CO line ratios where both phases contribute to both transitions can be expressed as
| (7) |
Typically we find which, along with the known range of values (obtained from the dense gas properties outlined in Section 3.1), allows the subtraction of the dense phase contribution from the observed ratios and the estimate of the values. These and the ratio (which we assume to be dominated by the diffuse phase) are then used as inputs into our LVG code. This in turn yields () for the diffuse phase (a), with still lower densities of but also possible. In all cases (reaching as high as ), which suggests the presence of highly unbound gas whose large values and high are responsible for its modest CO J=1–0 optical depths (). This phase could be confined around individual GMCs “enveloping” their much denser self-gravitating regions, or could be distributed over very different scales. Interferometric CO line imaging reveals a disk distribution with much of the lower-density molecular gas in the outer regions (Downes & Solomon 1998). In either case, the diffuse non self-gravitating gas phase is a minor contributor to the total molecular gas mass of Mrk 231.
3.3 Thermal balance of the molecular gas in Mrk 231
The temperature of the molecular gas in a galaxy is determined by the equilibrium between heating and cooling processes. Gas heating is dominated by the photoelectric effect on dust grains and polycyclic aromatic hydrocarbons (PAHs), as discussed by e.g., Wolfire et al. (1995). Cooling proceeds through line radiation which, in normal galaxies, is dominated by the [C ii] line (e.g., Wolfire et al. 1995, 2003; Kaufman et al. 1999), which can carry up to % of the total far-infrared (FIR) luminosity of a galaxy (e.g., Stacey et al. 1991; Malhotra et al. 1997; Leech et al. 1999; Pierini et al. 1999; Negishi et al. 2001). In thermal equilibrium, the heating and cooling rates are balanced: increased heating, such as that resulting from enhanced star formation will be compensated by increased cooling. This has been used to estimate star formation rates in nearby galaxies using the observed [C ii] line luminosity (e.g., Crawford et al. 1985; Stacey et al. 1991; Boselli et al. 2002).
Measurements obtained with the Long Wavelength Spectrograph (LWS) on the Infrared Space Observatory (ISO) have shown that the [C ii]/FIR flux ratio decreases in galaxies of very high FIR luminosity, i.e., the increase in [C ii] line luminosity is no longer proportional to the FIR luminosity. This effect was first discovered in deep ISO measurements of a small sample of nearby ULIRGs (Luhman et al. 1998), where the observed [C ii]/FIR luminosity ratio was found to be smaller than % in some of the most FIR-luminous galaxies - a value more than factor of 10 lower than that observed in less luminous galaxies. Various explanations for this effect have been proposed, including dust absorption and saturation effects, self-absorption in the [C ii] line and more subtle explanations related to the detailed physics of dense photon dominated regions (PDRs) (Luhman et al. 2003).
The high luminosity of the [C ii] line suggests that the line should be observable (redshifted into the submillimeter regime) out to very high redshifts (e.g., Loeb 1993; Stark 1997; Suginohara et al. 1999). Indeed, ALMA will be able to detect the [C ii] emission from a Milky Way-type galaxy out to (Van der Werf & Israel 1996). It is therefore imperative to understand the physical conditions determining the strength of the [C ii] line more fully. The first attempts to detect this line in the distant Universe were carried out by Isaak et al. (1994) on the QSO BR 12020725, with an upper limit implying a [C ii]/FIR ratio lower than in the nearby starburst galaxy M82. In a deeper integration on this same object, an upper limit on the [C ii] luminosity was found which is less than 0.06% of the total FIR luminosity (Van der Werf 1999). Recently, the first detections of [C ii] at high redshift have been obtained in the QSO SDSS J1148+5251 (Maiolino et al. 2005), and in the QSO BR 12020725 (Iono et al., 2006) where the [C ii] luminosity is % of the total far-infrared luminosity. All these results are consistent with ISO observations of local ULIRGs, and suggest that the same physical mechanisms are responsible.
Our present results for Mrk 231 amount to the most complete picture of the molecular gas attained for a local ULIRG enabling us to analyze the cooling budget of its molecular medium in detail, and thereby shed light on the [C ii] problem. The results are summarized in Table 4 where we have used the mean values from our LVG models to calculate luminosities for CO lines which have not been observed. The HCN lines (not relevant for the cooling budget) resulting from the same models are presented in Table 5. The [C ii] m line luminosity has been derived from the line flux of W cm-2 measured using the ISO LWS by Luhman et al. (1998). The cooling due to the and [C i] lines was estimated from a measurement of the latter (Gerin & Phillips 2000) and by assuming LTE (the [C i] energy levels are expected to be fully thermalized for the dense gas phase). The range of the best two LVG solution ranges (Table 3) constrains the CI(2–1)/(1–0) brightness temperature ratio to , for which we adopt the mean value of (which is actually measured in M 82; Stutzki et al. 1997). We also list the total luminosity in CO lines up to for the dense phase only, as well as those the total luminosity in CO lines from the diffuse phase, calculated from the difference between observed fluxes and the modeled fluxes from the dense phase. Line strengths are presented in flux units ( in Jy km s-1), in luminosity units ( in ), and in luminosities (in K km s-1 pc2, estimated using Eq. 5); the last quantity scales directly with the intrinsic brightness temperature of the line, and is thus constant for thermalized optically thick lines originating from the same medium.
Table 4 shows the remarkable result that the cooling luminosity for the dense molecular gas in Mrk 231 considering only CO approaches that of the [C ii] line, with while , for in Mrk 231 (Sanders et al., 2003 for the cosmology adopted here). The situation is further illustrated in Fig. 4, where we show a bar histogram of the cooling lines of the interstellar gas in Mrk 231. Error bars are observational errors for the luminosities based on measured fluxes, and indicate the range allowed by the LVG models for the remaining values. For the latter values we adopted a minimum uncertainty of at least 30% based on the measurement errors of the CO and lines. The error bars thus give a good indication of the expected ranges taking into account uncertainties in both the observations and the LVG modeling. It is instructive to compare these results to the corresponding results for the Milky Way, where global CO line fluxes have been measured using the COBE data, and converted into luminosities using a model for the spatial distribution of the emission within the solar circle by Wright et al. (1991). For the Milky Way the total CO cooling (relative to FIR luminosity) is , while for [C ii] , i.e., the cooling is totally dominated by [C ii] with neglible CO cooling. The importance of the CO line cooling is also reflected in the CO line ratios: the flux ratio CO (which has been observed both objects) is 1.5 in the Milky Way (Wright et al., 1991), but 5.4 in Mrk 231. We can also compare these results to a recent survey in mid- CO lines and the two [C i] lines by Bayet et al. (2006) of a small sample of local starburst galaxies. In these objects the mid- CO lines are also found to be much stronger than in the Milky Way, with cooling by CO lines significantly exceeding that from [C i]. However, CO cooling in these objects is still insignificant compared to [C ii], in contrast to the much more extreme results obtained here for Mrk 231.
The cooling associated with the diffuse molecular gas (contributing only to the lowest three CO transitions) of Mrk 231 is relatively unimportant. Thus it is natural to identify the dense phase with the actively star forming gas, which experiences the strongest heating, and must therefore also cool efficiently. Unlike the Milky Way and lower intensity starbursts in Mrk 231 this phase contains most of the molecular gas mass, forming stars at what is thought to be a maximum efficiency (Section 3.1), at rates found only in dense star-forming cores in the Milky Way.
The resulting picture of a dense and dominant (in terms of mass) molecular gas phase, emitting strongly in CO but with a suppressed [C ii] line, points towards dense PDRs (e.g., Kaufman et al., 1999). In such PDRs, the high density leads to a high formation rate for CO (proportional to ), while the CO photodissociation rate is less strongly enhanced (proportional to ). As a result, the ionized carbon layer is thin, leading to a suppressed [C ii] line. In addition, the transition from ionized and atomic carbon to CO now takes place closer to the source of heating, resulting in a large column density of warm molecular gas with strong emission in the mid- CO lines. Generalizing to ULIRGs as a population, our Mrk 231 result suggests that the suppressed [C ii] cooling in ULIRGs is a result of high densities for most of their molecular gas, bathed in strong far-UV radiation fields, quite unlike lower intensity starburst or quiescent galaxies where much more modest amounts of molecular gas reside in such a high density phase.
Our explanation predicts strong emission in CO lines up to in ULIRGs. While such high-J transitions are not observable from the ground, they will be accesible with HIFI onboard the Herschel satellite. Observations of high excitation CO lines from space or the ground, as well as careful estimates of the fraction of molecular gas mass with cm-3 in local ULIRGs using HCN transitions, will provide a critical test of the hypothesis that dense PDRs lie at the heart of the [C ii] cooling problem in ULIRGs.
4 Molecular lines at high redshifts: caveats and expectations
The wealth of molecular line and dust continuum data used to constrain the state of molecular gas in Mrk 231 and assign most of its mass to a dense phase is rarely available for objects in the distant Universe. Typically, two high- CO lines are detected (Solomon et al. 1992b; Solomon & Vanden Bout 2005 and references therein), with a similar sparsity of dust continuum measurements. The few frequencies observed (usually at the Rayleigh-Jeans part of a SED) provide poor estimates of , which in turn provides little constraint on the range of . In most cases, the often (but not always) large CO line ratios of high- lines measured in high redshift objects are interpreted in terms of a warm phase, yet infact they trace a wider range of physical conditions. This degeneracy can be easily demonstrated by setting the high ratio measured in Mrk 231 as the only constraint available. It can then be seen (Table 6) that besides the typical warm gas phase with moderate optical depths, gas as cold as but times more dense also reproduces the high ratio that we have observed. In such a phase the large CO line optical depths, and the resulting radiative trapping, thermalize transitions up to high levels so that
| (8) |
(), which for e.g. yields (the observed value).
The degeneracies alluded to above reflect real conditions found in GMCs: warm, dense gas associated with star formation, and dense-but-cold gas in regions with no such significant activity. In ULIRGs a massive, dense but cold phase is unlikely but not impossible during the rapid dynamic evolution expected for mergers (e.g., Aalto 2005). Observing at least one 13CO transition is pivotal to discriminating between cold dense gas with an optically thick CO J=1–0 line and a less dense warmer phase where . Indeed, the cold/dense solutions in Table 6 correspond to J=1–0 intensity ratios of , much lower than those even in the coldest GMCs (). Interestingly, setting as a constraint selects the conditions with (Table 6), and thus may also be useful in “breaking” such degeneracies, though it will always depend on the assumed abundances.
4.1 Molecular gas SLEDs for Mrk 231: towards establishing local benchmarks
High resolution imaging of molecular lines and their relative strengths with the next generation of mm/sub-mm arrays holds the key to unobscured views of deeply dust-enshrouded star forming regions in galaxies, their dynamical masses, and the molecular gas fueling the embedded star formation.
This is apparent now that CO-bright H2 gas has been detected out to (Walter et al. 2003), and distant dust-enshrouded optically faint starbursts, responsible for building large fractions of the stellar mass at present epochs, have been discovered (e.g. Smail, Ivison, & Blain 1997). The need for local molecular line SLEDs for the bulk of the molecular gas in galaxies (and not just for their starburst sub-regions) is underlined by the fact that currently there are more detections of CO J=4–3 or higher-J lines in high redshift rather than local starbursts (e.g. Solomon & Vanden Bout 2005).
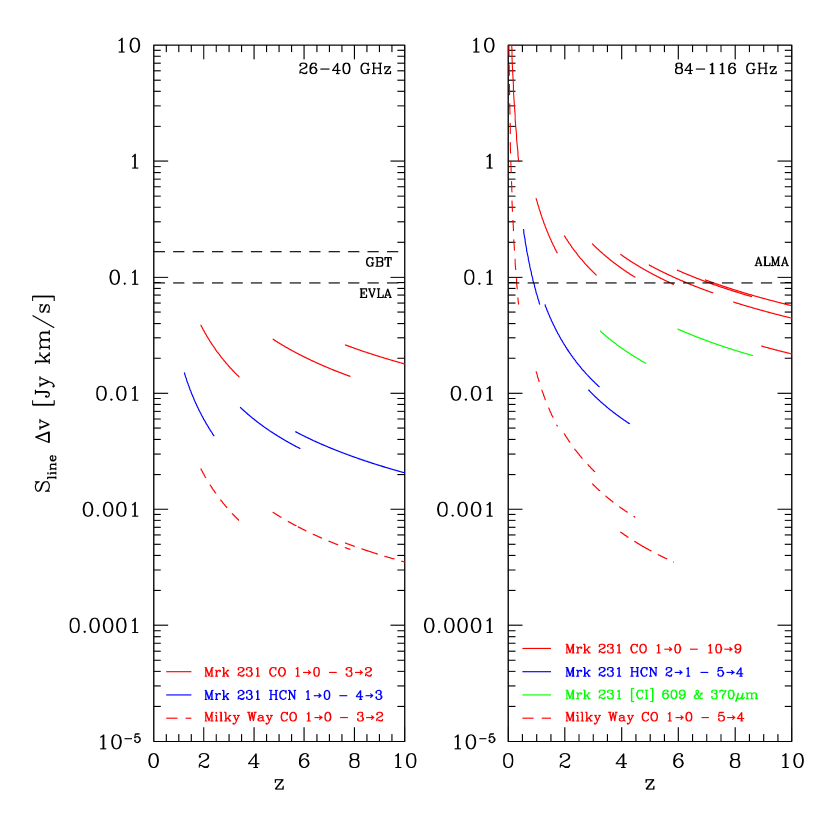
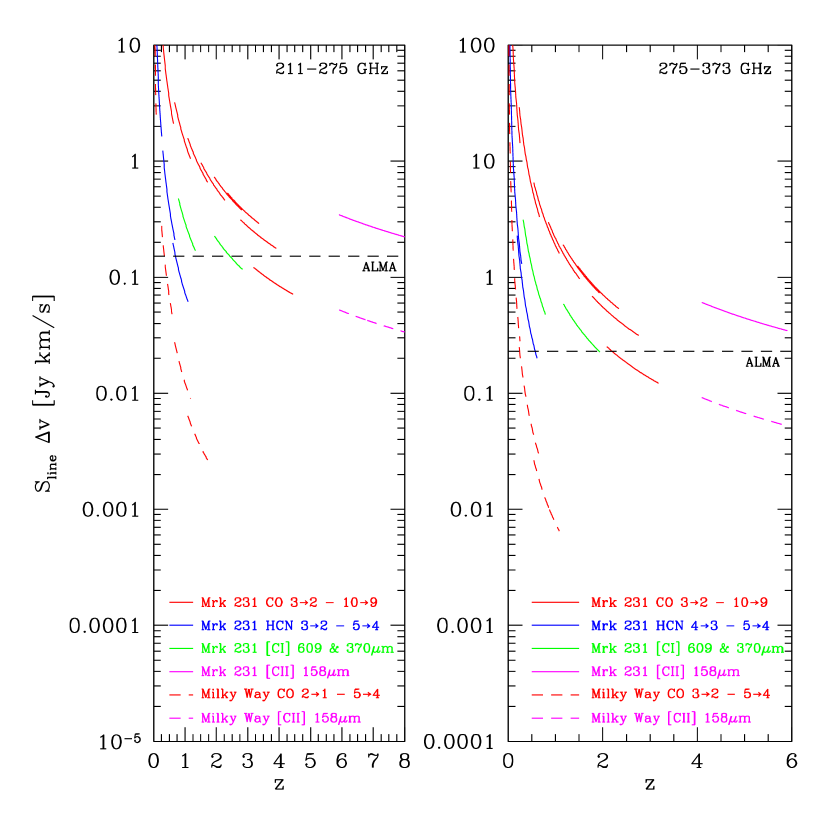
The compact distribution of the CO, HCN emission in local ULIRGs and their large IR and molecular line luminosities makes them ideal objects for establishing such SLEDs – single pointings encompass all the H2 distribution – a situation mirrored in high-z galaxies. The extreme-starburst/QSO present in Mrk 231 makes this galaxy in particular an often- used benchmark for similar high-z systems (e.g. Wagg et al. 2005). We use the constraints on its dense gas properties to derive the expected strengths of the unobserved CO and HCN transitions. The resulting CO and HCN SLEDs can then be used to assess the capabilities of the next generation cm (EVLA, SKA) and mm/sub-mm (ALMA) arrays, as well as the spaceborne Herschel Observatory in detecting star-forming molecular gas throughout the Universe (e.g. Van der Werf & Israel 1996). The line fluxes, calculated for a range of redshifts, are presented in Fig. 5, where we also show the analogous values for the Milky Way, with luminosites again from the COBE data (Wright et al., 1991) for all lines except CO . The luminosity of the latter line in the Milky Way was estimated using the CO luminosity from Wright et al. (1991) and the CO line ratio in the inner of the Milky Way as measured by COBE, which is within the errors equal to the global line ratio over the inner Galaxy (Fixsen, Bennett, & Mather, 1999). The Milky Way and Mrk 231 bracket the two extremes of quiescent and starburst galaxies. A luminosity of (Wright et al., 1991) makes the Milky Way detectable with ALMA out , using CO in the GHz band. Higher CO lines will not be detectable however, though redshifted [C ii] will be observable with ALMA out to with significant integration time. In the case of a Mrk 231-like object, the situation is quite different, with transitions up to CO detectable with ALMA out to . The two [C i] lines can be detected out to , and the [C ii] line will be readily detectable at . The high-density tracing HCN lines will typically be detectable only out to , where the GHz band of ALMA will be the most suitable frequency range.
It is instructive to investigate how existing detections of CO lines at high redshift fit on the Mrk 231 template. We use the comprehensive compilation by Solomon & Vanden Bout (2005; their Appendix 2) of all detections of (sub)millimeter lines from high- galaxies to 2005, supplemented with more recent data by Riechers et al. (2006). In Fig. 6 we plot again the CO cooling budget of Mrk 231 but now overlay the observed line luminosities of all high- objects with at least two detected CO lines (one of them being CO or ). Ideally all fluxes should be scaled relative to one common line, but unfortunately there is no line which is detected in all (or even most) objects. However, almost all high- objects with CO detections have either the or the line detected (but, remarkably, so far never both). We therefore scale the observed line fluxes to either the CO or the CO luminosity of Mrk 231 and show the results in Fig. 6. Inspection of this figure reveals a considerable range in line ratios, and it is clear that interpolation to a fictitious value would have introduced significant uncertainties. Therefore we prefer to normalize to either the or the line, which, although blurring the comparison somewhat, has the advantage of being based on measurements rather than an uncertain interpolation. Physically, this procedure is acceptable since these lines have similar contributions from the dense gas component (70% for the line, 80% for the line) in our Mrk 231 fiducial model.
Figure 6 shows that Mrk 231 is a reasonable template for most high- objects that have been detected in CO, with line ratios within a factor of two from those of Mrk 231 up to about . This does not imply that all high- objects would have similar line ratios: there is clearly a selection effect in the sense that high- objects are followed up with low- CO observations only after having being detected via their luminous high- line emission. With this caveat in mind, Mrk 231 appears to be a useful template for high- galaxies detected in CO to-date. It is interesting to note that this is the case also for its dust continuum emission (see e.g., Fig. 2 of Blain et al., 2002).
Two notable outliers in Fig. 6 are HR10 and APM 08279+5255. HR10 is an extremely red object at a modest redshift of which, while a ULIRG (), has line ratios indicative of low excitation conditions more similar to the Milky Way than to Mrk 231 (Papadopoulos & Ivison, 2002). Detections and imaging of such low excitation objects beyond (even with such large ) will be difficult even with ALMA. At the other extreme, APM 08279+5255 shows unusually high excitation, with CO line luminosities rising all the way up to at least : gas at high gas densities is indicated by the detection of luminous HCN by Wagg et al. (2005). While these authors can fit their data with a single gas phase of cm-3, this object is strongly lensed (Lewis et al., 2002), and so it is likely that the observed fluxes are dominated by a selectively amplified region of high-density molecular gas. Another indication of a singularly different molecular line excitation of this distant starburst/QSO is its HCN(5–4)/CO(4–3) luminosity ratio of (from Wagg et al. 2005 and Downes et al. 1999), while from the observed CO J=4–3 and the expected HCN J=5–4 luminosity (deduced from the best LVG solutions for the dense gas) the much lower values of are derived for Mrk 231.
Agreement with (or deviation from) the Mrk 231 SLED appears to depend primarily on the mean gas density of the phase dominating the emission. This is suggested by further inspection of Fig. 6 in relation to the HCN line luminosities where available. In IRAS F10214+4724, VCV J140955.5+562827, and the Cloverleaf quasar, HCN J=1–0 has been detected, but with an HCN(J=1–0)/CO(J=3–2) ratio much lower than in Mrk 231, and these galaxies reveal somewhat lower CO line excitation than Mrk 231 as well. In contrast, the HCN(J=2–1)/CO(J=2–1) ratio in SDSS J1148+5251 is higher than in Mrk 231, and this object shows also higher excitation in the CO lines. Construction of molecular gas SLEDs out to the high excitation regimes associated with the star-forming gas for a large number of local LIRGs will allow a more thorough examination of such differences, while establishing much-needed benchmarks for the interpretation of the still sparse data at high redshifts.
5 Conclusions
We report on the detections of the CO J=6–5, J=4–3 transitions of the archetypal nearby ULIRG/QSO Mrk 231. These first detections of high-excitation CO lines in a local extreme starburst, along with hereby reported CO J=3–2, HCN J=4–3 detections and CO J=1–0, 2–1, 13CO J=2–1, HCN J=1–0 literature data, allow robust constraints to be placed on its molecular gas properties. Our conclusions can be summarized as follows:
-
1.
The high excitation CO J=4–3 and J=6–5 lines trace denser (), gas phase different from that dominating the lower three CO transitions. This phase is also responsible for the observed HCN line emission, and contains of the total molecular gas mass in this galaxy, quite unlike quiescent or lower intensity starbursts where only a few percent of the total molecular gas mass reside in such a phase. This dominant dense gas phase fuels the starburst in Mrk 231 at almost the maximum expected star forming efficiency of .
-
2.
This preeminence of dense and relatively warm () gas in Mrk 231 presents a totally different thermal balance from that found in more quiescent galaxies, with CO comparable to [C ii] emission line cooling. If confirmed, through observations of other ULIRGs, this may provide the explanation of the long-standing issue of their very low [C ii]/IR luminosity ratios namely, bright high-excitation CO lines from dense far-UV photon-dominated molecular gas are the major and even dominant coolants with respect to their faint [C ii] line.
-
3.
Since the excitation conditions probed by the mid- CO lines and low-excitation atomic and ionic fine-structure lines are very similar, mid- CO lines provide an excellent diagnostic complementary to e.g., PACS on the ESA Herschel satellite, and proposed future missions such as the Japanese SPICA project. With ALMA these diagnostics will be available at unprecedented spatial resolution.
-
4.
The well-constrained dense molecular gas SLED of Mrk 231 provides a very valuable template for direct comparisons with starburst/QSO systems at high redshifts, with the caveat that it may not be representative of the ULIRG population as a whole (e.g. Mrk 231, unlike Arp 220, has a sub-thermal HCN(4–3)/(1–0) line ratio). Nevertheless it is a template unaffected by the strong differential lensing that may be skewing the intrinsic SLEDs of several high redshift galaxies towards those of a more compact, highly-excited, star-forming and even AGN-related molecular gas phase.
Facilities: JCMT
References
- (1) Aalto S., Black J. M., & Johansson L. E. B., & Booth R. S. 1991, A&A, 249, 323
- (2) Aalto S., Booth R. S., Black J. M.,& Johansson L. E. B. 1995 A&A, 300, 369
- (3) Aalto S., 2005, in: Astrochemistry: Recent Successes and Current Challenges, IAU Symposium No. 231, p. 261, D. C. Lis, G. A. Blake, & E. Herbst, eds.
- (4) Bayet, E., Gerin, M., Phillips, T.G., & Contursi, A. 2006, A&A, 460, 467
- (5) Blain, A. W., Smail, I., Ivison, R. J., Kneib, J.-P., & Frayer, D. T. 2002, Phys. Rep. 369, 111
- (6) Boselli, A., Gavazzi, G., Lequeux, J., & Pierini, D. 2002, A&A, 385, 454
- (7) Casoli F., Dupraz C., & Combes F. 1992, A&A, 264, 55
- (8) Blain A. W., Frayer D. T., Bock J. J., & Scoville N. Z. 2000, MNRAS, 313, 559
- (9) Bryant P. M., & Scoville N. Z. 1996, ApJ, 457, 678
- (10) Bryant P. M., & Scoville N. Z. 1999, AJ, 117, 2632
- (11) Crawford, M. K., Genzel, R., Townes, C. H., & Watson, D. M. 1985, ApJ, 291, 755
- (12) Downes D., Solomon, P. M. 1998, ApJ, 507, 615
- (13) Downes D., Neri R., Wiklind T., Wilner D. J., Shaver P. A., 1999, ApJ, 513, L1
- (14) Fixsen D. J., Bennett C. L., & Mather J. C. 1999, ApJ, 526, 207
- (15) Gao Y., & Solomon P. M. 2004a, ApJS, 152, 63
- (16) Gao Y., & Solomon P. M. 2004b, ApJ, 606, 271
- (17) Genzel R., Lutz D., Sturm E., Egami E., Kunze D., Moorrwood A. F. M., Rigopoulou D., Spoon H. W. W., Sternberg A., Tacconi-Garman L. E., Tacconi L., & Thatte N. 1998, ApJ, 498, 579
- (18) Genzel R., Tacconi L. J., Rigopoulou D., Lutz D., & Tecza M. 2001, ApJ, 563, 527
- (19) Glenn J. & Hunter T. R. 2001, ApJS, 135, 177
- (20) Goldsmith P. F. 2001, ApJ, 557, 736
- (21) Greve T. R., & Papadopoulos P. P. 2006, in preparation
- (22) Güsten R., Serabyn E., Kasemann C., Schinckel A., Schneider G., Schulz A., & Young K. 1993, ApJ, 402, 537
- (23) Hollenbach D. J., Tielens A. G. G. M. 1999, RvMP, 71, 173
- (24) Iono, D., Yun, M.S., Elvis, M., Peck, A.B., Ho, P.T.P., Wilner, D.J., Hunter, T.R., Matsushita, S., & Muller, S. 2006, ApJ, 645, L97
- (25) Irvine W. M., Goldsmith P. F., & Hjalmarson A. 1987, in Interstellar Processes, eds. D. J. Hollenbach & H. A. Thronson Jr. (Dordrecht: Reidel), p. 561
- (26) Isaak, K. G., McMahon, R. G., Hills, R. E., & Withington, S. 1994, MNRAS, 269, L28
- (27) Jackson J. M., Paglione T. A. D., Carlstrom J. E., & Nguyen-Q-Rieu 1995, ApJ, 438, 695
- (28) Kaufman, M. J., Wolfire, M. G., Hollenbach, D. J., & Luhman, M. J. 1999, ApJ 527, 795
- (29) Krüegel E., Chini R., & Steppe H. 1990, A&A, 229, 17
- (30) Krumholz M. R., & McKee C. F. 2005, ApJ, 630, 250
- (31) Kim S., Martin C. L., Stark A., Laine A. P. 2002, ApJ, 580, 896
- (32) Lahuis F., & van Dishoeck E. F. 2000, A&A, 355, 699
- (33) Leech, K. J., Völk, H. J., Heinrichsen, I., Hippelein, H., Metcalfe, L., Pierini, D., Popescu, C. C., Tuffs, R. J., & Xu, C. 1999, MNRAS, 310, 317
- (34) Lepp S., & Dalgarno A. 1996, A&A, 306, L21
- (35) Lewis, G. F., Carilli, C., Papadopoulos, P. P., & Ivison, R. J. 2002, MNRAS, 330, L15
- (36) Lisenfeld U., Hills R. E., Radford S. J. E., & Solomon P. M. 1996, in Cold Gas at High Redshift, Astrophysics and Space Science Library, Vol. 206, p. 55
- (37) Loeb, A. 1993, ApJ, 404, L37
- (38) Luhman, M. L., Satyapal, S., Fischer, J., Wolfire, M. G., Cox, P., Lord, S. D., Smith, H. A., Stacey, G. J., & Unger, S. J. 1998, ApJ, 504, L11
- (39) Luhman, M. L., Satyapal, S., Fischer, J., Wolfire, M. G., Sturm, E., Dudley, C. C., Lutz, D., & Genzel, R. 2003, A&A, 594, 758
- (40) Malhotra, S., Helou, G., Stacey, G., Hollenbach, D., Lord, S., Beichman, C. A., Dinerstein, H., Hunter, D. A., Lo, K. Y., Lu, N. Y., Rubin, R. H., Silbermann, N., Thronson, H. A., Jr., & Werner, M. W. 1997, ApJ 491, L27
- (41) Maiolino, R., Cox, P., Caselli, P., Beelen, A., Bertoldi, F., Carilli, C., Kaufman, M. J., Menten, K. M., Nagao, T., Omont, A., Weiß, A., Walmsley, C. M., & Walter, F. 2005, A&A, 440, L51
- (42) Mao R. Q., Henkel C., Schulz A., Zielinksy M., Mauersberger R., Störzer H., Wilson T. L., & Gensheimer P. 2000, A&A, 358, 433
- (43) Negishi, T., Onaka, T., Chan, K.-W., & Roellig, T. L. 2001, A&A, 375, 566
- (44) Neufeld, D. A., & Kaufman, M. K. 1993, ApJ, 418, 263
- (45) Nieten Ch., Dumke M., Beck R., & Wielebinski R. 1999, A&A, 347, L5
- (46) Papadopoulos P. P., & Seaquist E. R. 1999a, ApJ, 514, L55
- (47) Papadopoulos P. P., & Seaquist E. R. 1999b, ApJ, 516, 114
- (48) Papadopoulos P. P., & Allen M. L. 2000, ApJ, 537, 631
- (49) Papadopoulos P. P., & Ivison, R. J. 2002, ApJ, 564, L9
- (50) Papadopoulos P. P., Greve T. R., van der Werf P., Müehle S., Isaak K., & Gao Y. 2007, Astrophysics and Space Science (in press), astro-ph/0701829
- (51) Paglione T. A. D., Jackson J. M., & Ishizuki S. 1997, ApJ, 484, 656
- (52) Pierini, D., Leech, K. J., Tuffs, R. J., & Völk, H. J. 1999, MNRAS, 303, L29
- (53) Richardson, K. J. 1985, PhD Thesis, Department of Physics, Queen Mary College, University of London
- (54) Riechers, D. A., Walter, F., Carilli, C. L., Knudsen, K. K., Lo, K. Y., Benford, D. J., Staguhn, J. G., Hunter, T. R., Bertoldi, F., Henkel, C., Menten, K. M., Weiß, A., Yun, M. S., & Scoville, N. Z. 2006, ApJ 650, 604
- (55) Rigopoulou D., Lawrence A., White G. J., Rowan-Robinson M., & Church S. E. 1996, A&A, 305, 747
- (56) Sanders, D. B., Mazzarella, J. M., Kim, D.-C., Surace, J. A., & Soifer, B. T. 2003, AJ 126, 1607
- (57) Sanders D. B., Scoville N. Z., Young J. S., Soifer B. T., Schloerb F. P., Rice W. L., & Danielson G. E. 1986, ApJ, 305, L45
- (58) Sanders D. B., Soifer B. T., Elias J. H., Madore B. F., Matthews K., Neugebauer G., & Scoville N. Z. 1988, ApJ, 325, 74
- (59) Sanders D. B., Scoville N. Z., & Soifer B. T. 1991, ApJ, 370, 158
- (60) Sanders D. B., & Mirabel I. F. 1996, ARA&A, 34, 749
- (61) Sanders D. B. 1997, RMxAC, 6, 42
- (62) Scoville N. Z. 2004, in The Neutral ISM in Starburst Galaxies, eds. S. Aalto, S. Hüttemeister, & A. Pedlar, ASP Conference Series 320, p. 253
- (63) Smail I., Ivison R. J., & Blain A. W. 1997, ApJ, 490, L5
- (64) Soifer B. T., Sanders D. B., Madore B. F., Neugebauer G., Persson S. E., & Rice, W. L. 1987, ApJ, 320, 238
- (65) Solomon P. M., Radford S.J.E., & Downes D. 1990, ApJ, 348, L53
- (66) Solomon P. M., Downes D., & Radford S.J.E. 1992a, ApJ, 387, L55
- (67) Solomon P. M., Downes D., & Radford S.J.E. 1992b, ApJ, 398, L29
- (68) Solomon P. M., Downes D., Radford S.J.E., & Barrett J. W. 1997, ApJ, 478, 144
- (69) Solomon P. M., Vanden Bout P., Carilli C., & Guelin M. 2003, Nature, 426, 636
- (70) Solomon P. M., & Vanden Bout P. A., 2005, ARA&A, 43, 677
- (71) Stacey, G. J., Geis, N., Genzel, R., Lugten, J. B., Poglitsch, A., Sternberg, A., & Twones, C. H. 1991, ApJ 373, 423
- (72) Stark, A. 1997, ApJ, 481, 587
- (73) Suginohara, M., Suginohara, T., & Spergel, D. N. 1999, ApJ, 512, 547
- (74) Tacconi L. J., Genzel R., Lutz D., Rigopoulou D., Baker A. J., Iserlohe C., & Tezca M. 2002, ApJ, 580, 73
- (75) Tinney C. G., Scoville N. Z., Sanders D. B., & Soifer B. T. 1990, ApJ, 362, 473
- (76) Van der Werf, P. P., & Israel, F. P. 1996, in Science with Large Millimetre Arrays, ed. P. Shaver (Berlin: Springer), p. 51
- (77) Van der Werf, P. P. 1999, in Highly redshifted radio lines, ed. C. Carilli, S. J. E. Radford, K. M. Menten, & G. I. Langston, ASP Conference Series 156, p. 91
- (78) Wagg J., Wilner D. J., Neri R., Downes D., & Wiklind T. 2005, ApJ, 634, L13
- (79) Walter F. et al. 2003, Nature, 424, 406
- (80) Ward, J., Zmuidzinas, J., Harris, A.I. & Isaak, K.G. 2003, ApJ, 587, 171
- (81) Weiß, A., Walter, F., & Scoville, N. Z. 2004, in The Neutral ISM in Starburst Galaxies, eds. S. Aalto, S. Hüttemeister, & A. Pedlar, ASP Conference Series 320, p. 142
- (82) White G. J., Ellison B., Claude S., Dent W. R. F., Matheson D. N. 1994, A&A, 284, L23
- (83) Wild, W. et al. 1993, A&A, 265, 447
- (84) Wilson T. L., Ruf K., Walmsley C. M., Martin R. N., Pauls T. A., Batrla W. 1982, A&A, 115, 185
- (85) Wolfire, M. G., Hollenbach, D., McKee, C. F., Tielens, A. G. G. M., & Bakes, E. L. O. 1995, ApJ, 443, 152
- (86) Wolfire, M. G., McKee, C. F., Hollenbach, D., & Tielens, A. G. G. M. 2003, ApJ, 587, 278
- (87) Wright, E. L., Mather, J. C., Bennett, C. L., Cheng, E. S., Shafer, R. A., Fixsen, D. J., Eplee, R. E., Jr., Isaacman, R. B., Read, S. M., Boggess, N. W., Gulkis, S., Hauser, M G., Janssen, M., Kelsall, T., Lubin, P. M., Meyer, S. , Moseley, S. H., Jr., Murdock, T. L., Silverberg, R. F., Smoot, G. F., Weiss, R., & Wilkinson, D. T. 1991, ApJ, 381, 200
- (88) Wu J., Evans N. J., Gao Y., Solomon P. M., Shirley Y. L., & Vanden Bout P. A. 2005, ApJ, 635, L173
- (89) Young J. S. et al. 1995, ApJS, 98, 219


| Telescope | (Jy km s-1) | Reference |
|---|---|---|
| IRAM 30-meter | Solomon et al. 1997 | |
| NRAO 12-meter | Papadopoulos & Seaquist 1998 | |
| FCRAO | Young et al. 1995 | |
| IRAM 30-meter | Krügel et al. 1990 | |
| OVRO | Bryant & Scoville 1996 | |
| IRAM PdBI | Downes & Solomon 1998 |
| Transition | Line ratioaaVelocity/area-averaged brightness temperature line
ratios . |
Referencescc1. Papadopoulos & Seaquist 1998; 2. Downes & Solomon 1998 (two
values reported); 3. Glenn, & Hunter 2001 (CSO for ); 4. Lisenfeld et al. 1996; 5. Solomon, Downes, & Radford 1992a |
|
|---|---|---|---|
| (Jy km s-1) | |||
| CO J=1–0 |
bbAverages of the values extracted from the data in the
listed references. |
Table 1 (single dish data) | |
| CO J=2–1 |
bbAverages of the values extracted from the data in the
listed references. |
1, 2, 3 | |
| CO J=3–2 |
bbAverages of the values extracted from the data in the
listed references. |
4, this work | |
| CO J=4–3 | this work | ||
| CO J=6–5 | this work | ||
| HCN J=1–0 | 5 | ||
| HCN J=4–3 | this work |
|
aaParameters corresponding to best LVG solutions for ratio
(; see section 3) |
aaParameters corresponding to best LVG solutions for ratio
(; see section 3) |
aaParameters corresponding to best LVG solutions for ratio
(; see section 3) |
bbFrom Equation 2, (Irvine, Goldsmith &
Hjalmarson 1987; Lahuis & van Dishoeck 2000) ( see text). |
ccThe (dense gas)-dominated HCN(1–0)/CO(6–5) and HCN(4–3)/(1–0)
brightness temperature line ratios for each LVG set of parameters. Observed ratios: and ). |
|---|---|---|---|---|
| (K) | () | |||
| 15 | 2.67 (0.26) | |||
| 20-25 | 1.97-1.55 (0.24-0.28) | |||
| 30 | 0.90 (0.27) | |||
| 35 | 0.80 (0.28) | |||
| 40-45ddThe best solution ranges are indicated in boldface. | 0.72-0.64 (0.28-0.30) | |||
| 50-70ddThe best solution ranges are indicated in boldface. | 0.65-0.47 (0.23-0.28) | |||
| 75-90 | 0.25-0.21 (0.25-0.27) | |||
| 95-105 | 0.21-0.19 (0.27-0.28) | |||
| 110-150 | 0.19-0.15 (0.26-0.30) |
| Transition | Notes | |||
|---|---|---|---|---|
| [] | [] | [] | ||
| CO | 88 | |||
| CO | 315 | |||
| CO | 568 | |||
| CO | 980 | |||
| CO | aa line strength estimated by interpolation (CO ,
lines are dominated by the dense gas phase). |
|||
| CO | 1465 | |||
| CO | bb line strength estimated using the mean value resulting from the
LVG models |
|||
| CO | bb line strength estimated using the mean value resulting from the
LVG models |
|||
| CO | bb line strength estimated using the mean value resulting from the
LVG models |
|||
| CO | bb line strength estimated using the mean value resulting from the
LVG models |
|||
| CO dense phase | ccsum of CO line strengths from the dense phase using the mean
of our LVG models |
|||
| CO diffuse phase | ddsum of observed CO line strengths minus modeled CO line
strengths from the dense phase |
|||
| [C i] | 200 | |||
| [C i] | ee line strength estimated from the line (see text) | |||
| [C ii] |
| Transition | Notes | |||
|---|---|---|---|---|
| [] | [] | [] | ||
| HCN | 15 | |||
| HCN | aa line strength estimated using the mean value resulting from
the two best ranges of LVG solutions (Table 3) |
|||
| HCN | aa line strength estimated using the mean value resulting from
the two best ranges of LVG solutions (Table 3) |
|||
| HCN | 65 | |||
| HCN | aa line strength estimated using the mean value resulting from
the two best ranges of LVG solutions (Table 3) |
|||
| HCN | aa line strength estimated using the mean value resulting from
the two best ranges of LVG solutions (Table 3) |
|||
| HCN | aa line strength estimated using the mean value resulting from
the two best ranges of LVG solutions (Table 3) |
| bbFrom Equation 2, and . (ccThe optical depth of the CO J=1–0 line. ) | |||
|---|---|---|---|
| (K) | () | ||
| 15 | () | ||
| 20 | () | ||
| 25 | () | ||
| 30-35 | () | ||
| 40-45 | (1.2-1.5) | ||
| 50-75 | (5-10) | ||
| 80-135 | (0.08-0.45) | ||
| 140-150 | (0.77-0.88) |