Lyman Break Galaxies at and the evolution of dust attenuation in star-forming galaxies the redshift
Abstract
Ultraviolet (UV) galaxies have been selected from the deep imaging survey. The presence of a FUV-dropout in their spectral energy distributions proved to be a very complete (83.3 %) but not very efficient (21.4 %) tool for identifying Lyman Break Galaxies (LBGs) at . In this paper, we explore the physical properties of these galaxies and how they contribute to the total star formation rate. We divide the LBG sample into two sub-classes: red LBGs (RLBGs) detected at which are mainly Luminous IR Galaxies (LIRGs) and blue LBGs (BLBGs) undetected at down to the MIPS/GTO limiting flux density of 83 . Two of the RLBGs are also detected at 70 . The median SED of the RLBGs is similar (above ) to that of a luminous dusty starburst at , HR10. However, unlike local Luminous and Ultra Luminous IR Galaxies, RLBGs are UV bright objects. We suggest that these objects contain a large amount of dust but that some bare stellar populations are also directly visible. The median SED of the BLBGs is consistent with their containing the same stellar population as the RLBGs (i.e. a 250 - 500 Myrs old, exponentially decaying star formation history) but with a lower dust content. The luminosity function of our LBG sample at is similar to the luminosity function of NUV-selected galaxies at the same redshift. The integrated luminosity densities of LBGs and NUV-selected galaxies are very consistent. Making use of the RLBG sample, we show that star formation rates (SFRs) estimated from UV measurements and corrected using the method provide average total in agreement with the sum of the UV and infrared contributions: . However, -based shows a large dispersion. Summing up the detected UV ( rest-frame) and IR-based star formation rates of the detected objects, we find that only one third of the total (i.e. UV + dust) LBG SFR resides in BLBGs and two thirds in RLBGs, even though most LBGs at are BLBGs. On the other hand, the total SFR of LBGs accounts for only 11% of the total SFR at . Finally, we observe a regular decrease of the luminosity ratio from to for UV-selected samples.
keywords:
galaxies : starburst - ultraviolet : galaxies - infrared : galaxies - galaxies : extinction1 Introduction
The evolution of the star formation density with redshift contains fundamental information from the perspectives both of galaxy evolution and of cosmology. At intermediate redshift, star formation rates (SFRs) are estimated through a combination of UV, mid-IR, radio, and emission line techniques. Lyman Break Galaxies (LBGs) are used to estimate SFRs at high redshift. They are assumed to be related to FUV-selected samples selected via a color-color plane (e.g. Bouwens et al. 2006, Reddy et al. 2006). A major issue in determining the star formation density is to cross calibrate the several tracers used to estimate the SFRs. This paper tests whether the star formation rate estimated from the far ultraviolet (FUV) continuum (UV SFR or SFRUV) of UV-selected galaxies is equivalent to that from the infrared luminosity from dust estimated by integrating over the wavelength range (dust SFR or SFRdust, equivalently SFRTIR).
Even though we know that some dust is present in some LBGs (e.g. Chapman et al. 2002), it is difficult to get a direct estimate of how much in a statistically representative way because only a few LBGs at have been detected in the FIR and in the sub millimeter (submm) ranges (e.g. Chapman et al. 2000). Even has not detected a large sample of LBGs in the regime where the dust emission is the main component of the spectrum (e.g. Huang et al. 2005). Adelberger & Steidel (2000) concluded that the bulk of the submm background is produced by moderately obscured galaxies similar to the ones already detected in UV-selected surveys. Most of the dust-to-FUV luminosity ratios () for these galaxies are estimated from the observed optical and by using the UV slope vs. (IRX-) relation defined by Meurer, Heckman & Calzetti (1999). However, the validity of this law is debated (Bell 2002, Buat et al. 2005, Goldader et al. 2002). Nevertheless, using this law, dust luminosities are often estimated without FIR data (e.g. Adelberger & Steidel. 2000). Can we trust these results? Sawicki (2001) concluded that ”it is unlikely that a consensus about the amount of stellar light intercepted by dust will be reached on the basis of rest-frame UV and optical data alone”.
We therefore need rest-frame FIR data to advance our knowledge of the dust content of UV-selected galaxies. In this paper we approach this goal by observing LBGs at where we can directly evaluate the dust luminosity from data. Burgarella et al. (2006b) studied an initial sample of LBGs in the redshift range identified from data in the ultraviolet; a portion of this sample was also detected with in the IR. The remainder are below the limiting MIPS flux density of . Although this is a true Lyman Break sample at , the selection is different from LBGs at because the effect of the intergalactic medium is much lower at than at higher redshift. The same phenomenon applies, although at a lower level, for BM/BX galaxies selected at (e.g. Reddy et al. 2006). Thus, although exact analogs of the high redshift LBGs cannot be used, the main objective in the previous work was to define a rest-frame FUV-selected sample with a measured estimate of the dust luminosity from IR data.
In this paper, we expand upon this approach. We describe the selection of the sample in Section 2. Section 3 is devoted to the building and the analysis of the spectral energy distributions (SEDs) of LBGs (i.e. red LBGs (RLBGs) and blue LBGs (BLBGs)) and to their comparison to the SEDs of LBGs at . Then, in Section 4, we will derive the luminosity function of the LBG sample and compare it to the luminosity function of an ultraviolet-selected sample. In Section 5, we will address the question of the total star formation density at and whether this total star formation density can be evaluated from an ultraviolet-selected sample, an infrared-selected sample or whether both of them are required. In Section 6, we will study the evolution of the ratio for UV-selected samples or, in other words, of the evolution of the dust attenuation with redshift. We will finish this paper in Section 7 by estimating how we can detect LBGs in the infrared with facilities planned for the next decade.
We assume a cosmology with , and in this paper.
2 Definition of the UV and LBG Samples
Our first paper (Burgarella et al. 2006b) on the LBG sample at used GALEX pipeline data. Here, we use the deeper (76444 sec) NUV image available in GALEX Release 2 (GR2) whose central coordinates are = 03h32m30.7s, and = -27deg52’16.9” (J2000.0). An analysis of GALEX deep images shows that galaxies overlap, producing an apparent brightening of some of the detected objects in the tables available from the Multi Mission Archive at STScI (MAST). This effect starts to apply to objects brighter than .
To deal with these effects systematically, we put all of our images at a common resolution and extracted photometry by means of point spread function fitting. The spatial resolution of the GALEX images was slightly degraded by applying a median 3x3 filtering to the FUV and NUV images. The GALEX ”beam” is taken to be the solid angle of the 1 radius circle of a Gaussian point-spread function (PSF) : as defined in Hogg (2001). Note that for our GALEX analysis, arcsec which translates into arcsec. The final angular resolution in both bands therefore, matches the MIPS angular resolution.
Confusion noise is significant in these images (see Dole et al. 2004 for 24m). The size of the filtered GALEX beam sr. Since the total field of view of GALEX corresponds to sr, we obtain a confusion limit at :
or 16 beams per source at the 80% completeness limit defined below for the NUV-selected sample. This is deeper than the criterion published by Hogg (2001) of 20 beams per source but shallower than the 12 beams per source estimated by Dole et al. (2004) and Jeong et al. (2006). Takeuchi & Ishii (2004) have published a relation to estimate the confusion limit at . Our number counts can be fitted by a power law with a slope . Using and as recommended by Takeuchi & Ishii (2004), we can compute:
or 23 beams per source. Accounting for the difference in detection level ( for the former and for the latter), the two values are consistent.
We used DAOPHOT for photometry in these images with a PSF built from 10 bright point sources in the FUV and NUV. DAOPHOT was developed for point sources. Le Floc’h et al. (2005) show it is suitable to measure flux densities of Spitzer/MIPS sources. Our UV sources are restricted to the redshift range . De Mello et al. (2006) showed that UV-selected galaxies in the redshift range have kpc i.e. FWHM kpc. At this size corresponds to 0.7 arcsec. This is well below the angular resolution of our images, so we can safely use DAOPHOT for flux estimation in the targeted redshift range.
We detect about objects in the NUV down to 3 with the DAOPHOT DAOFIND task, which is in agreement with number counts by Xu et al. (2005). Using the DAOPHOT ADDSTAR task, we estimate the 80% completeness limit to be NUV=26.2 for the NUV-selected sample. The NUV-selected sample used hereafter corresponds to all objects with a NUV magnitude ; it contains 45366 objects in the GALEX field of view but only part of them have a COMBO 17 counterpart (i.e. a redshift) mainly because most GALEX objects lie outside the COMBO 17 field of view. This source density corresponds to 16 beams per source, that is, just at the 3- confusion limit.
To check the validity of our approach, we also apply DAOPHOT PHOT aperture photometry (integrated over 3 arcsec with an aperture correction estimated from the PSF) to a set of isolated objects (i.e. no COMBO 17 counterparts within a 4-arcsec radius) that we compare to DAOPHOT magnitudes for the same objects. The difference in magnitude (DAOPHOT - PHOT) amounts to which is about the uncertainty of a typical GALEX measurement (Morrissey et al. 2005) given that we reach very faint magnitudes, confirming that DAOPHOT provides good estimates for the GALEX magnitudes.
| n | idUV | RAUV | DecUV | FUV | errFUV | NUV | errNUV | idC17 | Rmag | err | z | zqal | NUVphot3 | err |
|---|---|---|---|---|---|---|---|---|---|---|---|---|---|---|
| 1 | 41129 | 52.946268 | -27.968764 | 23.967 | 0.050 | 23.636 | 0.038 | 12685 | 21.311 | 0.011 | 0.187 | 1 | 23.570 | 0.027 |
| 1 | 41130 | 52.934597 | -27.968940 | 27.583 | 0.221 | 25.409 | 0.039 | 12616 | 21.827 | 0.024 | 0.729 | 1 | 25.445 | 0.144 |
| 2 | 41133 | 52.852864 | -27.968810 | 26.600 | 0.111 | 24.159 | 0.038 | 12556 | 22.492 | 0.021 | 0.616 | 1 | 24.164 | 0.049 |
| 2 | 41133 | 52.852864 | -27.968810 | 26.600 | 0.111 | 24.159 | 0.038 | 12627 | 21.465 | 0.017 | 0.685 | 1 | 24.164 | 0.049 |
| 1 | 41134 | 52.830309 | -27.968789 | 24.451 | 0.060 | 22.685 | 0.046 | 12683 | 19.897 | 0.004 | 0.535 | 1 | 22.707 | 0.016 |
Next, we measure the FUV flux of those NUV-selected objects by applying DAOPHOT on the FUV images at the location of NUV-selected objects. Tests show that our FUV data are 80 % complete down to FUV=26.8. Then, we perform a cross-correlation with COMBO 17 (Wolf et al. 2004) within a radius r=2 arcsecs. We find a counterpart in COMBO 17 for about 71% of the NUV-selected sample. Table 1 provides the calibrated output from DAOPHOT (FUV and NUV) and the aperture photometry within a 3-arcsec radius for the resulting 7309 objects inside the in common with COMBO 17. 111Some additional information such as the redshifts and the R-magnitudes extracted from COMBO 17 are also provided. However, the original COMBO 17 database should be consulted for complete information, using the listed COMBO 17 identification. Some of the sources have several possible counterparts (several NUV counterparts for one COMBO 17 source or vice-versa). An object with an observed color is classified as a member of our LBG sample if the redshift of the counterparts (sometimes several within 2 arcsecs) from COMBO 17 is in the range (to be safe, we discard objects with variability flags larger than 8 and objects classified as ”Star”, ”WD”, ”QSO”; ”QSO (gal?)” and ”Strange Objects”). At this point, we have 420 LBGs (2 with four COMBO 17 counterparts, 40 with two counterparts and 378 with one counterpart). We estimated that the total completeness of the NUV-selected sample is about 80%. Correcting for this 80% UV completeness, the observed surface density of NUV-selected galaxies (including LBGs) down to in the 0.26 sq. deg. is .
The 80 % completeness is reached at FUV=26.8. Even though we still measure fluxes below this limiting magnitude, LBGs are missed for galaxies with because FUV-NUV cannot be measured. However, if we restrict ourselves to where we are able to estimate without the above restriction i.e. about 80% completeness, the respective surface densities of NUV-selected objects and LBGs are and i.e. about 75% of the NUV-selection are LBGs. A deeper analysis is postponed to Sect. 4.
Table 2 shows the completeness and the efficiency of the criterion for identifying star-forming galaxies in the redshift range . This method is very complete whenever the color is fully measurable i.e. when as described above. A more efficient method over all redshifts would need to use color-color diagrams as suggested by the statistics presented by Adelberger et al. (2004). However, this is not the goal of this paper, where COMBO 17 redshifts are available as inputs to the sample selection.
| Efficiency | |||
|---|---|---|---|
| 8206 | 2170 | 474 | 21.8 % |
| Completeness | |||
| 1943 | 568 | 473 | 83.3 % |
Finally, we carried out cross-correlations to complete the wavelength coverage with the UBVRIJK ESO Imaging Survey (EIS), four IRAC bands and finally with MIPS at 24 and . We stress that no additional selection effects enter into the final LBG sample since all the objects are kept in the following analysis with their own detections / non detections depending on the band. We have therefore, at the end of the cross-correlation process, the same number of UV objects as after the UV selection. Table 3 lists the best redshift as in Table 1, the UV luminosity estimated by interpolating the observed NUV and U-band and the total IR luminosity evaluated from the flux density and Chary & Elbaz (2001) calibration. An interesting point is that 62 of the 420 LBGs (i.e. 15%, but 17% if we restrict our sample to as above) have a MIPS counterpart down to the MIPS/GTO limiting flux density of 83 (all of them except one within r=2 arcsecs); we will call them Red LBGs (RLBGs hereafter). Huang et al. (2005) observed LBGs at with Spitzer and, excluding objects with possible contamination from AGN, they also classified about 15% as IR-luminous LBGs. Only two RLBGs are detected at but none of them are detected at . The remaining LBGs, undetected in the MIPS image are called Blue LBGs (BLBGs). Note that this is a practical notation and it does not imply a physical difference so far. The observed surface densities are for the much more numerous BLBGs, and for the RLBGs down to .
| idUV | RAUV | DecUV | L1150 | L1800 | Ldust | z | zqual | A1600 |
|---|---|---|---|---|---|---|---|---|
| 46333 | 53.106075 | -27.918961 | 9.800 | 10.193 | 11.249 | 0.900 | 1 | 2.092 |
| 39913 | 53.252274 | -27.980711 | 9.540 | 10.006 | -99.000 | 0.900 | 0 | -99.000 |
| 77655 | 52.931938 | -27.613210 | 10.054 | 10.185 | 11.008 | 0.903 | 1 | 1.587 |
| 50879 | 52.957910 | -27.876471 | 9.580 | 9.482 | -99.000 | 0.904 | 1 | -99.000 |
| 53306 | 53.220624 | -27.853428 | 10.190 | 10.084 | -99.000 | 0.905 | 1 | -99.000 |
3 The Spectral Energy Distributions of Lyman Break Galaxies
In this section, we analyse the median SEDs of RLBGs and BLBGs. In a previous paper (Burgarella et al. 2006b), we had stacked the 24 m images of BLBGs in a first LBG sample. Although we have improved our UV photometric measurements by using DAOPHOT, we consider that the stacked flux densities for RLBGs given in Burgarella et al. (2006b) are valid because i) most of the LBGs in the first sample are included in the present one and ii) the stacking process is designed to reduce the influence of objects around the central detection (i.e. the LBGs) to enhance the signal-to-noise ratio of individually undetected BLBGs. The effect of the confusion is therefore reduced. Burgarella et al. (2006b) had estimated an average flux density of at the observed wavelength of 24 m for those BLBGs. Table 4 gives the absolute B magnitudes (from the observed I band) of BLBGs and RLBGs and their FUV absolute magnitudes. As order-of-magnitude comparisons, our LBGs are more luminous than Blue Compact Galaxies (e.g. from Noeske et al. 2006); BLBGs are fainter than and RLBGs similar to LBGs at (e.g. in Sawicki & Thompson 2006).
| Blue LBGs | ||
|---|---|---|
| Red LBGs | ||
| All LBGs |
Ideally, to relate our galaxies to each other it would be better to use the redshift of each galaxy to calculate K corrections and put them all in the same frame before building the template SED. However, since we cannot simply interpolate between observed measurements because of high contrast spectral features (for instance an interpolation between the observed 8 and the observed 24 bands would produce catastrophic results), we would need to use some fiducial SED for interpolation in redshift. Since there are no observed FUV-to-FIR SEDs built from a large sample of high redshift galaxies, we would have to rely on models. We prefer to avoid the resulting unknown uncertainties. Given our small redshift range, K-corrections should be relatively small. We plot in Figs. 1-3 the extent of the wavelength range (except in Fig. 3 hidden by symbols) due to the range in redshifts, showing that the errors are small from assuming an average redshift of for all galaxies.
3.1 Red Lyman Break Galaxies (RLBGs)
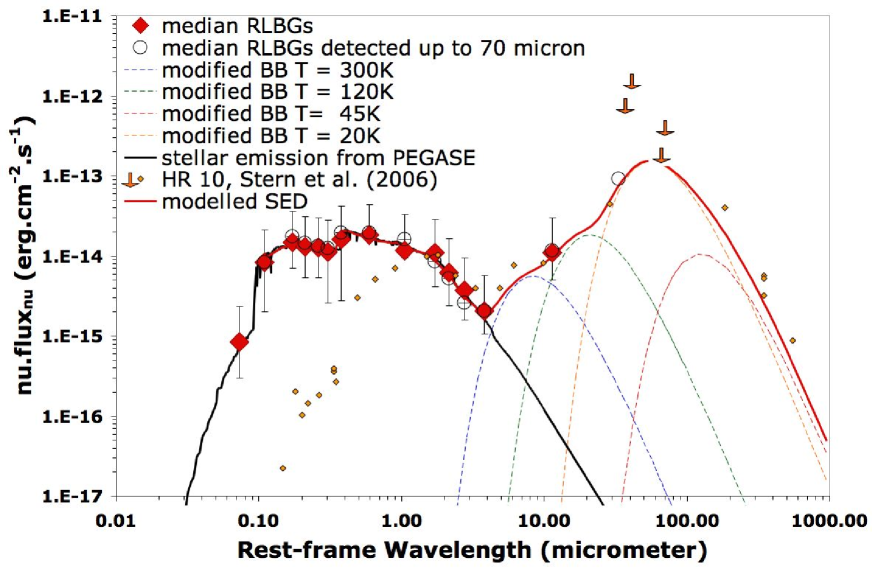
We can study for the first time a large sample of LBGs in the wavelength range where the emission by dust is predominant. Moreover, two IR-bright LBGs in our sample have a significant piece of SED in the FIR with data points at and . Interestingly enough, these two objects are consistent with being simultaneously ULIRGs (i.e. ) and very blue (UV slope ) UV luminous galaxies (UVLG) with moderate dust attenuation (). They will be described in a forthcoming paper (Burgarella et al. 2007). The other RLBGs are not detected at .
To build the UV-to-mm SED of RLBGs presented in Fig. 1, we proceed as follows:
-
•
We selected the RLBGs that are detected at all wavelengths from the observed NUV to (i.e. 37 objects). If we had computed the median SED of the full LBG sample, we would have derived a SED biased toward the brightest UV objects (and left undefined how to treat the many upper limits at 24m). By forcing the sample to have measured data points over the full wavelength range, we moderately bias the resulting SED toward red objects, which is consistent with our goal to characterize red LBGs.
-
•
We normalize the median SED of two RLBGs detected up to to the median SED of RLBGs in the observed IRAC band. This normalization demonstrates that the flux densities of these two RLBGs are very consistent with the flux density of the median SED of the RLBGs. The values at other wavelengths are fairly consistent as well. The two SEDs are very likely extracted from the same parent RLBG population. Therefore, we make the assumption that the normalized flux density of the two RLBGs detected at this wavelength can be used to extend the template SED of RLBGs. However, we must remember that the scatter in the two data points is very likely not representative of a larger sample.
-
•
We normalized the SED of HR 10, a dusty and luminous () starburst at z=1.44 (Stern et al. 2006) to the observed IRAC 3.6m band where the output should be dominated by stellar photospheres (). It is interesting that the SED matches very well that of the median RLBG SED for rest-frame wavelengths in the range - (Fig. 1). Again, it seems that we are dealing with the same kind of objects (e.g. Elbaz et al. 2002). Therefore, we tentatively use the SED of HR 10 to extend our median SED to wavelengths longer than up to 1mm.
The resulting RLBG template is listed in Table 5 and plotted in Fig. 1. The RLBG SED does not exhibit a power-law shaped continuum characteristic of AGN-dominated emission. Indeed, Ivison et al. (2004) showed that strong AGNs have nearly a constant slope from 2 to 10 while a distinct minimum in the 3 to 4 range is observed for starburst-dominated galaxies, and this property is being used to identify AGN through IRAC colors (e.g., Lacy et al. 2004; Stern et al. 2005; Alonso-Herrero et al. 2006). A key diagnostic for distinguishing AGN-dominated and starburst-dominated galaxies is a change of slope between the stellar and dust continua at 3-6 , which is one of the most noticeable features in the SEDs of our RLBGs.
However, even though HR 10 bears strong similarities in the IR to our RLBG population, its SED is very faint in the optical and UV and we cannot simply state that RLBGs are HR 10 - like objects. The RLBGs might represent a type of galaxy at that could be considered to be a missing link between the two high redshift populations of galaxies: the blue and almost dust-free LBGs and the IR/sub-mm bright LIRGs/ULIRGs. We might be observing complex objects where one component is emitting in the UV and the other in the IR. A related object might be VV114 (Le Floc’h et al. 2002), which is also considered to be a local counterpart of distant LBGs. Do we see different classes of unrelated objects or is there an evolution from one class to the other where RLBGs represent a temporary phase? We do not have enough information, yet, to decide and a morphological analysis of the full sample is under way from HST imaging to provide clues toward or against this hypothesis.
To understand this median SED, we model it using PEGASE (Fioc & Rocca-Volmerange 1997) in the UV + Optical + NIR (UVONIR) and several modified blackbodies in the FIR and sub-mm ranges. In the UVONIR, the best match is for a 500 Myr-old model (exponentially decaying SFR with 7 Gyr, 1/10 solar metallicity and a Salpeter IMF). To redden the model, we assume an attenuation law with where is the FUV dust attenuation. Since all RLBGs have estimated from IR data, we used their mean as a constraint. The slope, , is a free parameter and provides the best match to the observed SED. The UVONIR SED model is normalised to the observed R-band photometric point.
In the MIR/FIR, we use four modified blackbodies with an emissivity index set to (Klaas et al. 1997). These blackbodies are not meant to reproduce the detailed emission spectrum in the PAH region (i.e. below about , e.g. Marcillac et al. 2006, Smith et al. 2006) but only the underlying continuum. As a consequence, dust luminosities estimated from this approach are, strictly speaking, only lower limits. The temperatures of the four blackbodies are T = 300 K, 120 K, 45 K and 20 K. The normalization of the hottest one is fixed by setting the sum of the UVONIR model plus the 300 K model to the observed IRAC point at 8.0 . The warm blackbody is constrained by the 24 MIPS point. The cool blackbody is fixed by the observation of the two RLBGs detected at 70 and finally the cold blackbody by the 350 measurement of HR 10 (see above). The total IR luminosity from 1 to 1000 amounts to from the median RLBG SED. These RLBGs are therefore LIRGs on average. The UV luminosity integrated from 0.1 to 1.0 amounts to but to estimate the ratio, we estimate . These objects are therefore not UV luminous galaxies (UVLGs) on average. The resulting value of converts into using the calibration of Burgarella et al. (2006a). This value is in excellent agreement with the dust attenuation estimated from the fit.
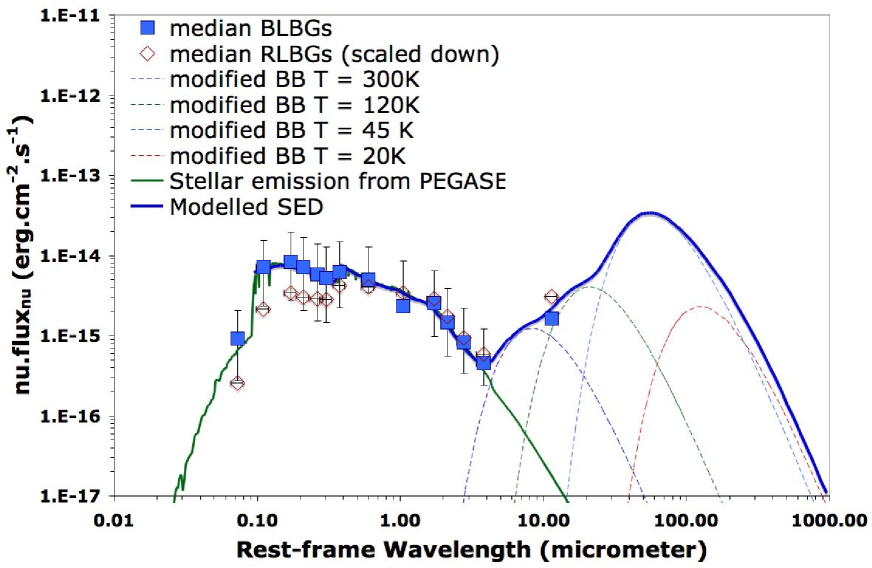
3.2 Blue Lyman Break Galaxies (BLBGs)
To build the UV-to-mm SED of the BLBGs presented in Fig. 2, we proceed as follows:
-
•
The median SED of BLBGs is computed for BLBGs detected at all wavelengths from the observed NUV to the IRAC band (i.e. 68 objects).
-
•
The point is the result from the stacking carried out in Burgarella et al. (2006b).
-
•
The median SED of RLBGs presented above is superimposed onto the median SED of BLBGs after normalizing it to the observed IRAC band, where stellar emission is still predominent. The match is fairly good from the IRAC 3.6m band to and we use this normalized RLBG SED to extend the BLBG one, which means that we make the assumption that the temperatures of dust grains in BLBGs are the same as in RLBGs. Only the amount of dust attenuation differs.
As for RLBGs, the median SED of the BLBGs does not show a power-law shaped continuum characteristic of AGN-dominated emission in the 3-4 range. As we showed for the RLBGs, the BLBGs should be starburst-dominated galaxies.
The UVONIR part of the SED is fitted again by a model from Fioc & Rocca-Volmerange (1997). The best match is for a 250-Myr model with the same global characteristics as the RLBGs except for the amount of dust attenuation. For the BLBGs, we do not have any individual measurements of . A constraint can be set by the upper limit at 83 flux density at 24 , which can be converted into an upper limit of . The best matching model corresponds to with the same slope as for the RLBGs. We conclude that the stellar populations in the BLBGs are only slightly younger than in the RLBGs and that the main difference between the two types comes from the amount of dust attenuation. The total IR luminosity of the median BLBG SED from 1 to 1000 amounts to . A median BLBG is therefore not a LIRG. The UV luminosity integrated from 0.1 to 1.0 amounts to . Again, to estimate , we estimate , which means that BLBGs are not UVLGs. The resulting value of converts to which, again, is consistent with the above value and with Schiminovich et al. (2005).
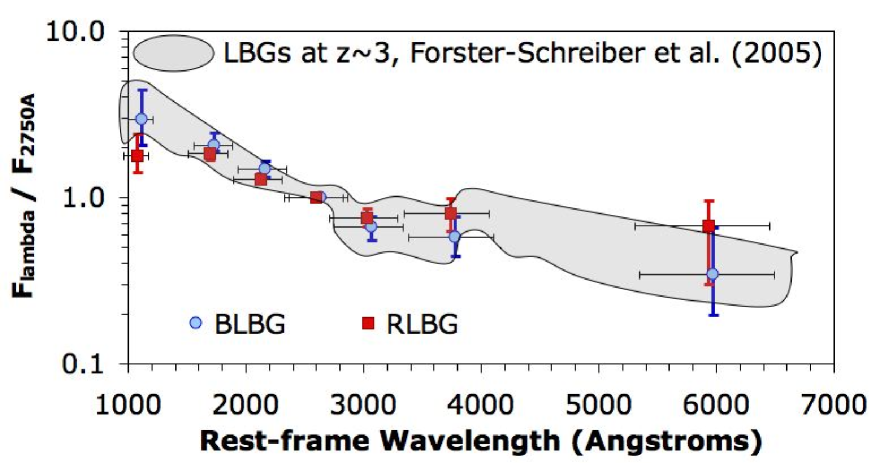
3.3 Comparison with LBGs at
Our two SEDs for BLBGs and RLBGs are compared in Fig. 3 to an average SED estimated for LBGs at in Förster-Schreiber et al. (2004) and normalised at 2750 . The grey cloud represents the standard deviation in Förster-Schreiber et al.’s LBG sample. Although marginally consistent with the latter, the SED of the RLBGs is too red in the UV and has an excess in the red part of the SED. Older stellar populations and/or more likely larger dust attenuation presumably are the origin of this difference. On the other hand, the SED of BLBGs has strong similarities to LBGs: all the data points appear to be consistent, within the uncertainty, with the hypothesis that the two populations are extracted from the same sample. More data are needed in the rest-frame NIR and in the MIR/FIR to provide information on the evolved stellar population and on the amount of dust to reach a definite conclusion. However, the present data and the results of Huang et al. (2005) suggest that we might observe LBGs at with the same SED characteristics (shape and distribution) as LBGs in the universe. Moreover, the LBG selection seems to favour starbursting galaxies with low dust attenuation whatever the redshift, that is BLBGs as defined in our sample. Nevertheless dustier LBGs (i.e. RLBGs) exist at and with a higher total SFR than BLBGs. However, we saw in Table 4 that LBGs at are brighter than BLBGs but have magnitudes similar to RLBGs. This means that a simple identification of BLBGs with high redshift LBGs is not strictly valid.
| 0.23 | 0.36 | 0.44 | 0.55 | 0.71 | 0.97 | 1.25 | |
| (RLBG) | 8.31E-15 | 1.47E-14 | 1.30E-14 | 1.27E-14 | 1.13E-14 | 1.63E-14 | 1.84E-14 |
| 1st quartile (RLBG) | 6.30E-15 | 7.68E-15 | 7.68E-15 | 7.34E-15 | 8.74E-15 | 1.35E-14 | 1.64E-15 |
| 3rd quartile (RLBG) | 1.28E-14 | 2.11E-14 | 1.81E-14 | 1.71E-14 | 1.69E-14 | 2.53E-14 | 2.50E-15 |
| (BLBG) | 7.16E-15 | 8.41E-15 | 7.25E-15 | 5.80E-15 | 5.27E-15 | 6.14E-15 | 5.05E-15 |
| 1st quartile (BLBG) | 4.84E-15 | 5.66E-15 | 5.22E-15 | 4.29E-15 | 3.80E-15 | 3.91E-15 | 1.64E-15 |
| 3rd quartile (BLBG) | 8.31E-15 | 1.13E-14 | 9.57E-15 | 8.15E-15 | 7.56E-15 | 8.85E-15 | 8.13E-15 |
| 2.2 | 3.6 | 4.5 | 5.8 | 8.0 | 24 | 70 | |
| (RLBG) | 1.18E-14 | 1.11E-14 | 6.15E-15 | 3.71E-15 | 2.05E-15 | 1.09E-14 | 9.17E-14 |
| 1st quartile (RLBG) | 2.32E-15 | 6.98E-15 | 3.77E-15 | 2.13E-15 | 9.88E-16 | 5.86E-15 | 2.54E-13 |
| 3rd quartile (RLBG) | 2.15E-14 | 1.74E-14 | 1.04E-14 | 5.80E-15 | 3.62E-15 | 1.90E-14 | 2.83E-13 |
| (BLBG) | 2.32E-15 | 2.56E-15 | 1.46E-15 | 8.23E-16 | 4.55E-16 | 1.63E-15 | - |
| 1st quartile (BLBG) | 2.32E-15 | 1.57E-15 | 9.85E-16 | 4.86E-16 | 2.13E-16 | - | - |
| 3rd quartile (BLBG) | 6.18E-15 | 3.92E-15 | 2.47E-15 | 1.36E-15 | 7.49E-16 | - | - |
4 The Ultraviolet Luminosity Function of Lyman Break Galaxies
The LBG selection process preferentially detects star-forming galaxies with low dust attenuation (see also, e.g., Steidel et al. 1996). This is generally true for UV-selected galaxies whereas IR-selected galaxies tend to be star-forming galaxies with a high ratio, that is, high dust attenuation (Iglesias-Paramo et al. 2006, Buat et al. 2006, Burgarella et al. 2006a). Xu et al. (2006) suggest that these differences are mainly caused by selection effects: both UV-selected and IR-selected galaxies would be extracted from the same population of star-forming galaxies. Buat et al. (2006) reach a somewhat similar conclusion. What can we say about high redshift LBGs?
LBGs are selected through colours. Therefore, strictly speaking they do not form a genuine UV-selected sample. Their spectral break is caused by the absorption of UV photons with in the outer atmospheres of massive stars, in interstellar H I gas, and in intervening H I gas along the line of sight. However, in the case of star-forming galaxies, the flux redward of the Lyman break (in the rest frame UV) is high, and high redshift LBGs are often assumed to be similar to a UV selected sample (Giavalisco 2002). High redshift LBGs are therefore used to estimate the UV star formation density. However, the intergalactic medium has little effect in producing the Lyman break in the SED of LBGs at and our objects are true Lyman break galaxies for which the break is produced by material inside the observed galaxies. We need therefore to check whether our LBG selection is equivalent to a UV selection before we can put local and high redshift LBG studies on the same ground to compare them.
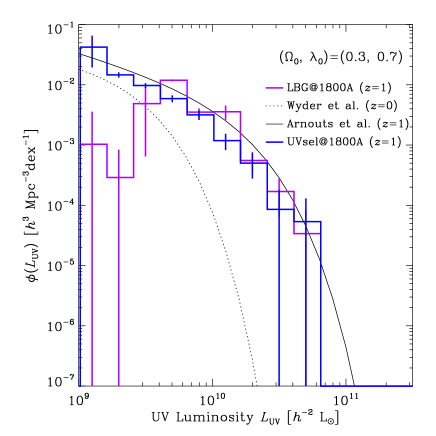
To address these questions, we need to compare the luminosity function (LF) of a UV-selected sample to the LF of a LBG sample. We address this point at . Arnouts et al. (2005) computed the LF of UV-selected galaxies at 150nm and . We evaluate the LF of our NUV-selected sample using the new DAOPHOT photometry and the and methods, to which we applied a K-correction to get LFs in the same wavelength range as for the higher redshift studies (e.g. Madau et al. 1996, Steidel et al. 1999, Sawicki & Thompson 2006). Both LFs at are very consistent (Fig. 4). We also compute the Far-UV (FUV) LF of our LBG sample (using and ). To select the z 1 LBG sample, we use a color selection . This means that there is a secondary selection in addition to the primary FUV selection on the sample. This secondary selection is properly addressed by the Kaplan-Meier estimator. By this method, we can utilize the information contained in the upper limits (see a more detailed description in Xu et al. 2006), and correctly estimate the LBG luminosity function. We compare it to the two FUV LFs in Fig. 4.
The UV luminosity density from Schiminovich et al. (2005) is . If we restrict Arnouts’ LF to our sample range, we obtain while our NUV-sel LF gives
The difference amounts to 20%. For LBGs,
which represents 85% of the total of NUV-selected galaxies in the considered luminosity range. The given uncertainties are 20%, so the two values are consistent. We can conclude that at , our LBG selection (which might be different from a higher redshift LBG selection i.e. without screening objects with high ) is similar to a UV selection.
Since most of our LBGs (83%) belong to the BLBG class, the difference between the LFs of BLBGs and LBGs is small. As expected, the LF of RLBGs (17 % of the sample) falls well below. While the shape above (i.e. UVLGs) of the RLBG LF is the similar to that of all LBGs, the RLBG LF seems to flatten at low luminosity. The contributions from blue and red LBGs to the LBG UV luminosity density are as follows:
i.e. 72.5% of the FUV flux density, and
i.e. 7% of the FUV flux density.
5 Contributions of UV- and IR-deduced SFR to the total Star Formation Density
Assuming a 250-500 Myr exponentially decaying star formation rate from PEGASE, in agreement with the SED fitting in the previous section, we can estimate for the UV-selected sample and for LBGs:
In determining this value, we used our 80 % complete NUV measurements, which apply to a rest-frame wavelength of . This wavelength corresponds to the observed V-band at . Since we will make comparisons within our own dataset, adopting this wavelength reduces the uncertainties due to K-corrections.
Using the observed flux density we can estimate the luminosity from emission by dust, , from the Chary & Elbaz (2001) calibration. However, it is necessary to evaluate how the aromatic bands could affect the estimated infrared luminosity. Based on analysis of a sample of local galaxies and assuming several galaxy SEDs, Dale et al. (2005) show the evolution of the ratio / with the redshift. In our redshift range, their figure suggests that the ratio can change by a factor of 2 - 3 for their galaxy sample. However, our galaxies are all luminous starburst galaxies. Smith et al. (2007) estimated that the ratio of the PAH-to-TIR luminosities for starburst galaxies . Marcillac et al. (2006) consider the scatter of the mid-IR indicators against each other and the radio (which should be a measure of the far infrared) and demonstrate that, for the best fitting templates, the scatter is only of order 30-40% rms. Using the relative band strengths in Smith et al., we can estimate that only of the flux density in the MIPS band is due to aromatic features in our redshift range. Since we apply the rest-frame calibration from Chary & Elbaz (2001) to estimate from , we include the aromatic contribution to first order. Therefore, the relative contribution of the aromatic features to the signal is not a major issue. As we show later, the ratio for our two galaxies detected at 70m, , is consistent with warm dust temperatures and of the same order as typical starburst galaxies such as Mark 33 in Dale et al. (2005). We therefore expect only a modest dispersion in the calibration from to (e.g. Papovich et al. 2002).
More crucial is the possibility that aromatic features move in and out of the MIPS band in the redshift range, creating a variable calibration. The main features of interest are at 11.3 , 12.0 and 12.6 . Any variability due to the first and second features is negligible since they remain within the MIPS band over almost all our redshift range. However, the 12.6 feature (plus the 12.8 [NeII] line) moves out of the filter at . To check whether this produces a calibration change (namely a decrease of the estimated luminosity above ), we divide our sample into two ranges below and above . The ratio of the flux densities is about unity in the two redshift ranges. This implies an increase of by a factor of with the redshift due to geometrical effects, which is consistent with our calculations. The average dust attenuations we calculate in the two adjacent redshift ranges are constant. We conclude that the derived behavior of the galaxies has no discontinuity at z 1.1 and that there is no strong variation due to the aromatic feature moving out of the 24m band. Therefore, we will assume that we can trust our estimated .
We apply Kennicutt’s (1998) calibration of into , which is valid for starbursts:
As already noticed in Sect. 2, our observed LBG sample is not complete below because of the FUV 80% limiting magnitude at . To estimate the total SFRs and surface densities down to , we assume that the characteristic percentages evaluated where we are complete can be applied below . Namely, that means that we assume, at and , the same percentages of LBGs in the UV-selected sample, the same percentages of BLBGs and RLBGs in the LBG sample and identical contributions to SFRs for the above classes. In other words, we make the assumption that the instrumental threshold is not related to a physical one and that no important trends exist as a function of the FUV luminosity . This is very likely not true over a wide range of but the two ranges (median, standard deviation) above and below are similar at and , respectively.
Although they are more numerous, BLBGs undetected at do not contribute much to the budget but only to one; they represent 23% of the LBG . RLBGs provide most of the LBG (77%) deduced from both the UV and infrared emission. However the surface densities of BLBGs and RLBGs follow an opposite trend: 83 % are BLBGs and 17 % are RLBGs. Most LBGs are therefore blue and contribute to a small percentage of the LBG while only a small proportion of dusty LBGs contribute the bulk of the LBG .
At , LBGs furnish 69% of . The ratio is larger than the ratio of SFR densities found at and in the redshift range by Takeuchi, Buat & Burgarella (2005). However, the data in Table 6 are integrated over the total IR luminosity range and . In addition to the wavelength difference, this might explain the different ratio. Indeed, if we sum up our TIR SFR density . For comparison, we can estimate for the IR-selected sample of LIRGs and ULIRGs defined by Le Floc’h et al. (2005) in the same CDFS field down to . The result is very consistent: . On the other hand, from the FUV luminosity density provided by Schiminovich et al. (2005) for , we can estimate in the same FUV luminosity range, which is very consistent with our sum in the UV luminosity estimated from . From the SFR densities provided by Le Floc’h et al. (2005) and Schminovich et al. (2005), we can compute: , which is very close to our ratio. A more complete analysis requires a more sophisticated analysis using bivariate LFs that will be performed in a forthcoming paper (Takeuchi et al. 2007).
| SFRLBG | SFRnot-LBG | SFRALL | |
| (BLBGs; RLBGs) | (UV; IR) | ||
| SFR1150 () | 11086 (78 %; 22 %) | 4937; 0 | 16023 |
| SFRIR () | 27029 (0 %; 100 %) | 0; 365445 | 394474 |
| SFRTOT () | 38115 (23 %; 77 %) | 372382 | 410497 |
| Surface Density () | 6003 (83 %; 17 %) | 1733;4312 | 6851; 5197 |
6 Can we estimate total star formation rates of UV-selected galaxies from UV and/or IR ?
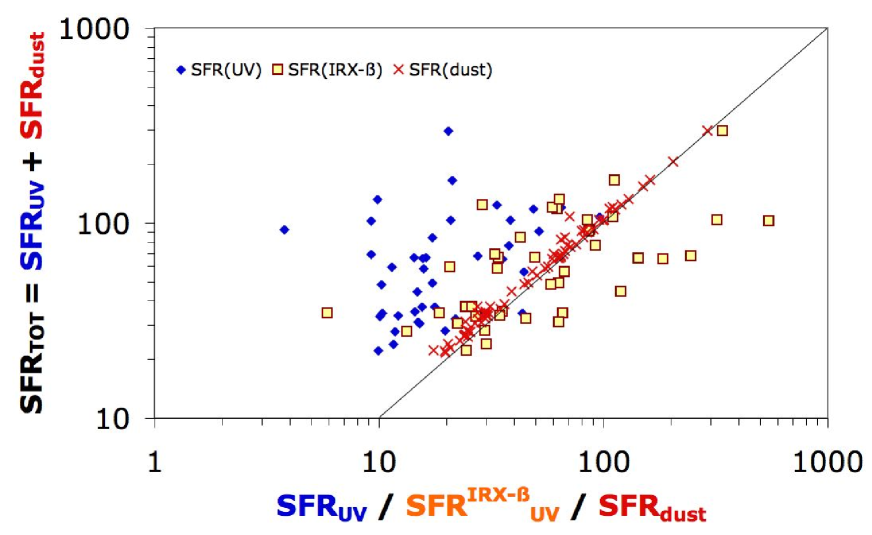
Since the early works by Steidel et al. (1996) and Madau et al. (1996), astronomers have tried to evaluate the cosmic star formation rate and its evolution with redshift from UV-selected galaxies. However, a correction for the dust attenuation must be applied to the UV measurements to obtain the total star formation density. The most widely used method is based on the Meurer, Heckman & Calzetti (1999) relation, whose validity is still debated (e.g. Goldader et al. 2002, Buat et al. 2005). Other methods have also been proposed (e.g. Kong et al. 2004, Burgarella et al. 2006a). Burgarella et al.’s (2006a) two-colour method, estimated for a sample of normal and local galaxies, does not seem to provide good dust attenuation estimates, which might indicate different dust attenuation laws for these local galaxies than for higher redshift star-forming LBGs. Burgarella et al. (2006b) presented a comparison of (i.e. FUV + dust) estimated from the FUV uncorrected for dust attenuation, the FUV corrected for dust attenuation using the method and from IR emission. In this paper, we update and complete this picture (Fig. 5). The main result is that IR-based SFRs provide the best estimate for of RLBGs, which are the only LBGs for which we have a direct estimate of the total SFRs. This was expected since RLBGs are dominated by their IR emission. It will be interesting, though, to extend the diagram to lower SFRs to follow the evolution. Iglesias-Paramo et al. (2006) performed a similar comparison at and found that and contribute about the same percentage to which is not inconsistent with an extrapolation from our present data. On the other hand, the method seems to provide, on average, a correct estimate of , even for IR-bright LBGs. However, the dispersion is much larger that for FIR-based SFRs.
7 The Evolution of the Total IR to Far UV luminosities of Lyman Break Galaxies
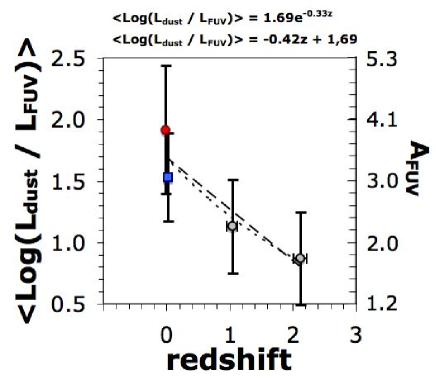
Buat et al. (2007b) defined a sample of 190 LIRGs at in the CDFS and compared it to a sample of 120 LIRGs at extracted from Buat et al. (2005). They found that the distribution of is different at the 95% level, as a result of different average FUV dust attenuations: and . Since the luminosity function of LBGs is statistically consistent with the luminosity function of a UV selection, we can compare for our objects to the UV-selected sample at of Buat et al. (2007a) and the BM/BX FUV-selected sample at of Reddy et al. (2006). Unfortunately, Buat et al.’s sample does not extend far into the regime where galaxies lie at and , making a direct comparison impossible. However, Buat et al.’s FUV-selected and FIR-selected samples do not show any difference up to . Therefore, we adopt two values at for the sake of a redshift comparison of the () ratio: first, we assume that we can extrapolate the FUV trend to higher through a linear regression and second we use the FIR value. At (i.e. a LIRG), the typical value of for the volume-corrected sample at is for the FIR-selected galaxies and for the FUV-selected ones. The comparative values are at and at (Fig. 6). The corresponding FUV dust attenuations, using the to calibration provided by Burgarella et al. (2006a), are respectively and 1.7.
We clearly observe a regular decrease of with redshift (Fig. 7). What is the evolution beyond ? We need more data at all luminosities and, of course, a better coverage of the redshift scale. The evolution of this ratio will be a very powerful tool to bring us some constraint on the dust formation timescale and process in galaxies with, later on, some idea of where in the UV or FIR we will have to look for high redshift star formation. Ultimately, dust-free star formation might be observed at an unknown redshift depending on the time needed to form dust in star forming regions. We must stress, however, that this decrease is based on a UV-selected sample (which is generally associated with lower stellar masses than IR-selected galaxies). Buat et al. (2007) find a smaller effect for an IR-selected sample at , which might suggest a mass-dependent phenomenon.

8 The Detectability of Lyman Break Galaxies
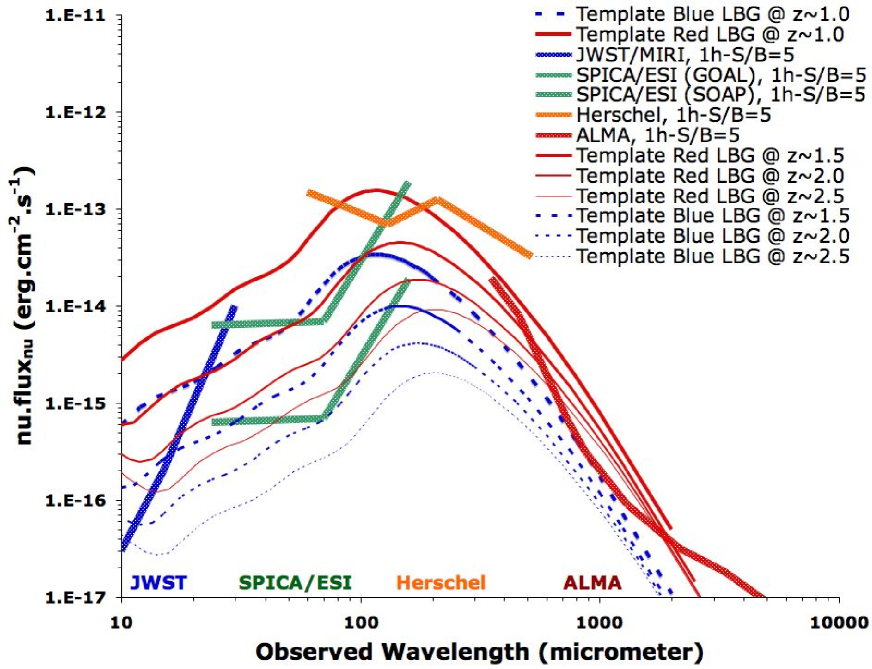
Will we be able to detect more UV-selected galaxies and LBGs at high redshift in the future? The main limitation for deep observations in the FIR are due to (i) thermal noise, (ii) cirrus and (iii) confusion limits (Helou & Beichman 1990, Dole et al. 2004, Kiss, Klaas & Lemke 2005). Using the information available on the next generation of FIR/submm instruments, we can assess whether they would be able to detect LBGs. In Fig. 8, we plot the average SED of RLBGs and BLBGs as determined in this paper (Table 4).
On top of our two template SEDs, the flux density limits of several telescopes are also drawn to evaluate the detectability of a larger sample of LBGs/UV-selected galaxies in the future. The comparison is based on a 1h exposure time with a detection for all the instruments. The Atacama Large Millimeter Array (ALMA) can detect RLBGs up to in 1h and can just detect BLBGs at . A positive K-correction applies in the millimeter range but those objects are fainter even at low redshift and the K-correction does not help. A longer exposure time is necessary for detections at z 1. The Herschel space telescope can detect the brightest RLBGs around but will not be able to detect fainter ones or higher redshift ones in 1h. Deeper exposure times are also needed to broaden the spectral range. However, important information will be provided at the tip of the dust emission SED to further constrain the dust temperatures and TIR luminosities. The European SPICA Instrument (ESI) on the Japanese-led cryogenically-cooled telescope SPICA can take advantage of the low background to benefit from the low confusion-limit for a 4-m FIR telescope. We assume, here, two kinds of detectors depending on which one will be available for ESI in the mid-2010 frame: Spitzer- or Herschel-like photo-detectors (GOAL) or state-of-the-art photodetectors (SOAP) utilizing bolometers with transition edge superconductor temperature sensors (TES) (Swinyard et al. 2006). ESI would do a fair job in 1h below for photoconductors and reach exceptional sensitivies for the TES-based devices. In the first case, it would provide us with individual data on BLBGs while in the second case, all LBGs would be detected up to in 1h. Finally on the blue side of the dust emission JWST/MIRI would be able to detect the mid-IR emission of low-redshift LBGs (z of 1 - 2) but higher redshift ones would be below the detection limits as the aromatic features shift out of the longest photometric band.
| (RLBG) | (BLBG) | |
|---|---|---|
| 0.1 | 8.09E-15 | 6.15E-15 |
| 0.2 | 1.36E-14 | 6.94E-15 |
| 0.3 | 1.26E-14 | 5.35E-15 |
| 0.4 | 2.10E-14 | 7.30E-15 |
| 0.5 | 1.88E-14 | 5.98E-15 |
| 0.6 | 1.72E-14 | 5.13E-15 |
| 0.7 | 1.59E-14 | 4.50E-15 |
| 0.8 | 1.50E-14 | 4.11E-15 |
| 0.9 | 1.45E-14 | 3.86E-15 |
| 1.0 | 1.42E-14 | 3.70E-15 |
| 2.0 | 7.13E-15 | 1.69E-15 |
| 3.0 | 2.86E-15 | 6.61E-16 |
| 4.0 | 2.05E-15 | 4.56E-16 |
| 5.0 | 2.72E-15 | 5.91E-16 |
| 6.0 | 4.10E-15 | 8.87E-16 |
| 7.0 | 5.25E-15 | 1.13E-15 |
| 8.0 | 6.04E-15 | 1.30E-16 |
| 9.0 | 6.70E-15 | 1.45E-16 |
| 10.0 | 7.49E-15 | 1.62E-15 |
| 12.0 | 9.87E-15 | 2.13E-15 |
| 12.5 | 1.06E-14 | 2.30E-15 |
| 15.0 | 1.48E-14 | 3.19E-15 |
| 17.5 | 1.82E-14 | 3.93E-15 |
| 20.0 | 2.08E-14 | 4.49E-15 |
| 22.5 | 2.39E-14 | 5.15E-15 |
| 25.0 | 2.88E-14 | 6.22E-15 |
| 27.5 | 3.67E-14 | 7.92E-15 |
| 30.0 | 4.76E-14 | 1.03E-14 |
| 32.5 | 6.09E-14 | 1.31E-14 |
| 35.0 | 7.56E-14 | 1.63E-14 |
| 37.5 | 9.07E-14 | 1.96E-14 |
| 40.0 | 1.05E-13 | 2.27E-14 |
| 42.5 | 1.18E-13 | 2.55E-14 |
| (RLBG) | (BLBG) | |
|---|---|---|
| 45.0 | 1.29-13 | 2.79E-14 |
| 47.5 | 1.38E-13 | 2.99E-14 |
| 50.0 | 1.45E-13 | 3.14E-14 |
| 52.5 | 1.50E-13 | 3.24E-14 |
| 55.0 | 1.53E-13 | 3.30E-14 |
| 57.5 | 1.54E-13 | 3.33E-14 |
| 60.0 | 1.54E-13 | 3.32E-14 |
| 62.5 | 1.52E-13 | 3.29E-14 |
| 65.0 | 1.50E-13 | 3.23E-14 |
| 67.5 | 1.47E-13 | 3.16E-14 |
| 70.0 | 1.43E-13 | 3.08E-14 |
| 72.5 | 1.38E-13 | 2.99E-14 |
| 75.0 | 1.34E-13 | 2.89E-14 |
| 77.5 | 1.29E-13 | 2.79E-14 |
| 80.0 | 1.24E-13 | 2.68E-14 |
| 82.5 | 1.19E-13 | 2.58E-14 |
| 85.0 | 1.15E-13 | 2.47E-14 |
| 87.5 | 1.10E-13 | 2.37E-14 |
| 90.0 | 1.05E-13 | 2.27E-14 |
| 92.5 | 1.01E-13 | 2.17E-14 |
| 95.0 | 9.62E-14 | 2.08E-14 |
| 97.5 | 9.20E-14 | 1.99E-14 |
| 100.0 | 8.80E-14 | 1.90E-14 |
| 125.0 | 5.64E-14 | 1.22E-14 |
| 150.0 | 3.71E-14 | 8.00E-15 |
| 200.0 | 1.75E-14 | 3.77E-15 |
| 300.0 | 5.01E-15 | 1.08E-15 |
| 400.0 | 1.84E-15 | 3.96E-16 |
| 500.0 | 8.00E-16 | 1.73E-16 |
| 1000.0 | 4.95E-17 | 1.07-17 |
9 Summary
We applied a PSF-fitting method to estimate the flux of a sample of NUV=26.2 UV-selected objects in the GALEX Deep Imaging Survey of the Chandra Deep Field South. The GALEX deep images start to be confusion-limited ( 20 beams per source) and fluxes of objects fainter than are over-estimated by the GALEX pipeline because objects can be blended. The selection of galaxies through a FUV dropout provides a very complete sample of star-forming galaxies in the redshift range . However, the efficiency is low as compared to a color-color method (e.g. Adelberger et al. 2004).
We analysed the spectral energy distributions and the luminosity function of this sample of LBGs, using both and data. We divide the sample into two sub-classes depending on whether they are detected at 24 (red LBGs, RLBGs) or are not (blue LBGs, BLBGs). The NIR/MIR part of both SEDs indicates that AGNs are unlikely to play a major role in these objects; they are dominated by star formation. The UV to NIR part of the two template SEDs can be fitted by PEGASE models with exponentially decaying star formation histories of ages 500 Myrs and 250 Myrs for RLBGs and BLBGs respectively and the same dust attenuation law proportional to . The only difference comes from the amount of dust attenuation: , constrained by the for RLBGs and for BLBGs. The mean for RLBGs (i.e. LIRGs) and for BLBGs.
The BLBG SED template at has a shape similar to the mean SED of LBGs at published by Förster-Schreiber et al. (2004). This means that the latter objects undergo low dust attenuation, as expected from the selection. However, observations by Huang et al. (2005) suggest that a population of dusty LBGs with large total SFRs also exists at high redshift. Such a population appears to be less numerous than the BLBGs, as is also the case at . On the one hand, we find that the summed UV star formation rate (uncorrected for dust attenuation) of our LBGs only represents of the total (i.e. UV + dust) star formation rate of all LBGs. That implies a large and uncertain extrapolation to get the total star formation density. On the other hand BLBGs, not detected in FIR, form the bulk (in number) of the galaxy population selected in UV.
Our LBG sample at has a UV luminosity function consistent with that of purely UV-selected galaxies. The similarity of the two luminosity functions implies that making use of color selection is not useful to study star-forming galaxies whenever redshifts are available. UV measurements corrected using th method provide correct (on average) but relatively uncertain total SFRs, even for our LBG / LIRG sample. The dispersion is larger than an estimate involving both UV and IR measurements. For RLBGs, provides the a reasonably accurate estimate of .
Finally, we observe an apparent regular decrease of the ratio for UV-selected galaxies from to , using Buat et al. (2005) and Reddy et al. (2006) values in addition to ours. If confirmed, this trend might have strong cosmological implications in terms of the star formation history of the universe and the timescales for dust formation in primordial galaxies.
Acknowledgments
DB and VB thank the French Programme National Galaxies and Programme National de Cosmologie for financial support. TTT has been supported by the 21st Century COE Program ”Exploring New Science by Bridging Particle-Matter Hierarchy”, Tohoku University. TTT has also been supported by the Special Coordination Funds for promotion Science and Technology (SCF). This work was also partially supported by contract 1255094 from JPL/Caltech to the University of Arizona.
References
- Adelberger & Steidel (2000) Adelberger, K.L.; Steidel, C.C. 2000, ApJ 544, 218
- Alonso-Herrero, A. et al. (2006) Alonso-Herrero, A. et al. 2006, ApJ, 640, 167
- Arnouts et al. (2005) Arnouts, S; Schiminovich, D.; Ilbert, O. et al. 2005, ApJ 619, L43
- Bell (2002) Bell, E.F 2002, ApJ 577, 150
- Bouwens et al. (2006) Bouwens R.J., Illingworth G.D., Blakeslee J.P., Franx M. 2006, ApJ 563, 53
- Buat et al. (2005) Buat V., Iglesias-Paramo J., Seibert M., Burgarella D., Charlot S., Martin D. C., Xu C. K., Heckman T. M., Boissier S., Boselli A., Barlow T., Bianchi L., Byun Y.-I., Donas J., Forster K., Friedman P. G., Jelinski P., Lee Y.-W., Madore B. F., Malina R., Milliard B., Morissey P., Neff S., Rich M., Schiminovitch D. S., Siegmund O. H. W., Small T., Szalay A. S., Welsh B., Wyder T. K. 2005, ApJ 619, L51
- Buat et al. (2007a) Buat V., et al. 2007a, ApJS in press, astro-ph/0609738
- Buat et al. (2007b) Buat V., et al. 2007b, A& A in press, astro-ph/0703014
- Burgarella et al. (2006a) Burgarella D., et al. 2006a, MNRAS 360, 1443
- Burgarella et al. (2006b) Burgarella D., Pérez-González P.G., Tyler K.D., Rieke G.H., Buat V., Takeuchi T.T. et al. 2006b, A& A 460, 69
- Chapman et al. (2000) Chapman S.C., Scott D., Steidel C.C., Borys C., Halpern M., Morris, S.L., Adelberger K.L., Giavalisco M., Pettini M. 2000, MNRAS, 319, 318
- Chapman et al. (2002) Chapman S.C., Shapley A., Steidel C.C., Windhorst R. 2002, ApJ, 572, L1
- Chary & Elbaz (2001) Chary R., Elbaz D. 2001, ApJ, 556, 562
- Dale et al. (2007) Dale D.A., Bendo G.J., Engelbracht C.W., et al. 2001, AJ, 633, 857
- De Mello et al. (2006) De Mello D.F., et al. 2006 AJ, 132, 2014
- Dole et al. (2004) Dole H., Rieke G.H., Lagache G., Puget J.-L., Alonso-Herrero A., Bai L., Blaylock M., Egami E., Engelbracht C.W., Gordon K.D. et al. 2004, ApJS 154, 93
- Elbaz et al. (2002) Elbaz D., et al. 2002, A & A, 381, L1
- Fioc & Rocca-Volmerange (1997) Fioc M., Rocca-Volmerange B. 1997, A & A 326, 950
- Forster-Schreiber et al. (2004) Forster-Schreiber N., et al. 2004, ApJ 616, 40
- Giavalisco (2002) Giavalisco, M. 2002, ARAA 40,579
- Goldader et al. (2002) Goldader J.D., Meurer G., Heckman T.M., Seibert M., Sanders D.B., Calzetti D., Steidel C.C. 2002, ApJ 586, 651
- Helou & Beichman (1990) Helou G., Beichman C.A. 1990, LIACo 29, 117
- Huang et al. (2005) Huang J.-S., Rogopoulou D., Willner S.P., Papovich C., Shu C., Ashby M.L., Barmby P., Bundy K., Conselice C., Egami E. et al. 2005, ApJ 634, 137
- Hogg (2001) Hogg D.W. 2001, AJ 121, 1207
- Iglesias-Paramo et al. (2006) Iglesias-Paramo J., et al. 2006, ApJS 164, 38
- Ivison et al. (2004) Ivison R.J., et al. 2004, ApJS 154, 124
- Jeong et al. (2006) Jeong W.-S., et al. 2006, MNRAS 369, 281
- Kennicutt (1998) Kennicutt R.C. 1998, ARAA 36, 189
- Kiss et al. (2005) Kiss C., Klass U., Lemke D. 2005, A& A 430, 343
- Klaas et al. (1997) Klass U., Haas M., Heinrichsen I., Schulz B. 1997, A& A 325, L24
- Kong et al. (2004) Kong X., et al. 2004, A& A 403, 877
- Lacy et al. (2004) Lacy, M., et al. 2004, ApJS, 154, 166
- Le Floc’h et al. (2002) Le Floc’h E., et al. 2002, A & A 391, L417
- Le Floc’h et al. (2005) Le Floc’h E., et al. 2005, ApJ 632, L169
- Madau et al. (1996) Madau P., et al. 1996, MNRAS 283, 1388
- Marcillac et al. (2006) Marcillac D., et al. 2006, A & A 451, 57
- Meurer, Heckman & Calzetti (1999) Meurer G.R., Heckman T.M., ,, Calzetti, D. 1999, ApJ 521, 64
- Morrissey et al. (2005) Morrissey P., et al. 2005, ApJ 609, L7
- Noeske et al. (2006) Noeske K.G., Koo D.C., Meurer G.R., Phillips A.C., Willmer C.N.A., Melbourne, A. 2006, ApJ 640, L143
- Reddy et al. (2006) Reddy N.A., et al. 2006, ApJ 653, 1004
- Sawicki (2001) Sawicki M., 2001, AJ 121, 2405
- Sawicki & Thompson (2006) Sawicki M., Thompson D. 2006, ApJ 648, 299
- Schiminovich et al. (2005) Schiminovich D., et al. 2005, ApJ 609, L47
- Smith et al. (2007) Smith J.T.D., et al. 2007, ApJ 656, 770
- Steidel & Hamilton (1993) Steidel C. C., Hamilton D. 1993, AJ 105, 201
- Steidel et al. (1996) Steidel C. C., et al. 1996, AJ 112, 352
- Steidel et al. (1999) Steidel C. C., et al. 1999, ApJ 519, 1
- Stern et al. (2005) Stern, Daniel, et al. 2005, ApJ, 631, 163
- Stern et al. (2006) Stern Daniel, et al. 2006, AJ 132, 1405
- Stetson et al. (1987) Stetson P.B., et al. 1987, PASP 99, 191
- Swinyard et al. (2006) Swinyard B., et al. 2006, SPIE 6265, 16
- Takeuchi et al. (2005) Takeuchi T.T, et al. 2005, A & A 440, L17
- Takeuchi & Ishii (2004) Takeuchi T.T, Ishii T.T. 2004, ApJ, 604, 40
- Wolf et al. (2004) Wolf C., et al. 2004, A & A 421, 913
- Xu et al. (2005) Xu C.K., et al. 2005, ApJ 609, L11
- Xu et al. (2006) Xu C.K., et al. 2006, ApJ 646, 834