11email: fabien@ster.kuleuven.be 22institutetext: Observatoire de Genève, Université de Genève, 51 Chemin des Maillettes, CH-1290 Sauverny, Switzerland
22email: yves@deber.ch 33institutetext: Institut d’Astrophysique et de Géophysique, Université de Liège, 17 Allée du 6 Août, Bât. B5c, B-4000 Liège, Belgium
33email: eggenberger@astro.ulg.ac.be, leyder@astro.ulg.ac.be 44institutetext: Observatoire de Paris-Meudon, GEPI, 5 Place Jules Janssen, F-92195 Meudon cedex, France
44email: frederic.royer@obspm.fr
A search for solar-like oscillations in the Am star HD 209625††thanks: Based on observations collected at the 3.6-m telescope at La Silla Observatory (ESO, Chile: program 073.D-0527 and 075.D-0614)
Abstract
Aims. The goal is to test the structure of hot metallic stars, and in particular the structure of a near-surface convection zone using asteroseismic measurements. Indeed, stellar models including a detailed treatement of the radiative diffusion predict the existence of a near-surface convection zone in order to correctly reproduce the anomalies in surface abundances that are observed in Am stars.
Methods. The Am star HD 209625 was observed with the Harps spectrograph mounted on the 3.6-m telescope at the ESO La Silla Observatory (Chile) during 9 nights in August 2005. This observing run allowed us to collect 1243 radial velocity (RV) measurements††thanks: The 1243 radial velocities are only available in electronic form at the CDS via anonymous ftp to cdsarc.u-strasbg.fr (130.79.128.5) or via http://cdsweb.u-strasbg.fr/cgi-bin/qcat?J/A+A/, with a standard deviation of 1.35 m s-1.
Results. The power spectrum associated with these RV measurements does not present any excess. Therefore, either the structure of the external layers of this star does not allow excitation of solar-like oscillations, or the amplitudes of the oscillations remain below 20–30 cm s-1 (depending on their frequency range).
Key Words.:
Stars: individual: HD 209625 – Stars: interiors – Stars: oscillations – Binaries: spectroscopic – Techniques: radial velocities1 Introduction
In the spectral range from A- to F-type stars, almost 70 of the non-chemically peculiar (CP) stars are currently classified as Sct variables, while most non-variable stars are Am-type stars. Although observations do not completly rule out variability in Am stars (or A-type metallic-line stars), they do rigorously constrain it: either variability is extremely rare, or the pulsations are of very low amplitude.
At their arrival on the ZAMS, Am stars have a HeII convection zone, typical of A–F stars. Due to their low rotational velocity, mixing processes are not efficient enough to prevent He from settling down. Helium leaves the external layers and is therefore no longer able to excite pulsations typical for the classical instability strip. Moreover, selective radiative acceleration causes the accumulation of iron-peak elements where these elements dominate the opacity, and leads to the appearance of iron-peak convection zones centered at a temperature of approximately 200 000 K (Turcotte et al. trmc00 (2000)). When assuming that there is a sufficient overshoot to homogenize the surface regions between the H, He and iron-peak convection zones, the predicted surface abundance variations closely resemble the abundance anomalies observed in Am stars (Richer et al. rich00 (2000)). Detailed models of Am stars thus predict the existence of a surface convection zone which may extend deeply into the external layers of the star. For instance, in a typical A-type star of 1.7 M⊙, the surface convection zone is predicted to only include the outer to M⊙ of the star, while it may include the outer to M⊙ of the star for an Am star with iron-peak convection zones (Richard et al. rich01 (2001)). The total mass of the convection zone for such an Am star is then found to be very similar to the mass of the surface convection zone of a 1.4 M⊙ star at solar metallicity which is able to drive solar-like oscillations as observed in the subgiant Procyon A (see e.g. Martić et al. mar04 (2004) and Eggenberger et al. ecbb04 (2004)).
In order to probe the structure of the predicted convection zone due to iron overabundances, we performed high-accuracy asteroseismic observations of an Am star. Indeed, depending on its structure, this convection zone may be able to drive solar-like oscillations similar to the ones detected for less massive stars (see e.g. the review by Bedding & Kjeldsen bed06 (2006)).
Typical A-type stars show only a few spectral lines (as opposed to F or G stars) and rotate fast, which prevents us from obtaining high-precision radial velocity (RV) measurements. However, this is not the case for Am stars characterized by under-abundances of calcium and scandium, and by over-abundances of iron-group elements. The large number of metallic absorption lines in Am spectra is particularly valuable to obtain precise radial velocities, needed to detect solar-like oscillations. Moreover, the rotational velocity distribution of Am stars is very different from that of regular A stars (Debernardi, dd02 (2002)): their mean rotational velocity lies below 50 km s-1, thus some Am stars have very low rotational velocities, a necessary condition to obtain accurate radial velocities. Therefore, Am stars are the only hot stars for which the high radial velocity accuracy needed to detect solar-like oscillations can be reached.
The target selected is the Am SB1 binary HD~209625 (A5/A9/F2; with a magnitude of 5.28). This object is representative of the Am main sequence stars while having a quite low rotational velocity km s-1 (deduced from our radial velocity measurements).
In this paper, we report on Doppler observations of HD~209625 performed with the Harps spectrograph, and resulting in the determination of a very high-accuracy time series for an Am star.
2 Observations and study of binarity
The Am star HD~209625 was observed during 4 half-nights in September 2004 and during 9 nights in August 2005 with the Harps spectrograph (Pepe et al. pmr02 (2002); see e.g. Carrier & Eggenberger ce06 (2006) for solar-like oscillations with this instrument) mounted on the 3.6-m telescope at the La Silla Observatory (ESO, Chile). We took consecutive exposures, each lasting between 140 and 300 s (depending on the airmass and the extinction), and separated by dead times of 30 s. In total, 430 and 1243 spectra were collected (for the first and second run respectively), with a typical signal-to-noise ratio (S/N) ranging from 100 to 300 at 530 nm. In parallel to the stellar exposures, the spectrum of a thorium lamp carried by a second fiber was simultaneously recorded, in order to monitor the spectrograph’s stability. The spectra obtained were extracted on-line. The radial velocities were computed online by weighted cross-correlation with a numerical mask constructed from a G2 dwarf spectrum. In addition, they were also determined by weighted cross-correlation with different masks built from more appropriate synthetic spectra (spectral type between A5 and F2, see Carrier et al. cardeb (2002)) and by the optimum-weight procedure (Connes c85 (1985), Carrier et al. 2005a ), although without significant gain. The use of a G2 template can introduce a small systematic shift in the radial velocities but without consequence for the variability analysis of this star.

The Am star HD~209625 being a SB1 binary, it is necessary to correct the observations for the Keplerian movement before studying the presence of p-mode oscillations. In order to accurately determine the period of this binary system, we used all Harps radial velocity measurements, along with previous Coravel measurements (Debernardi dd02 (2002)) and with data from Abt and Levy (al85 (1985)). Then, the other parameters were determined using only the Harps measurements, because they are far more accurate. The eccentricity was found to be very small (0.001) and was thus fixed to zero. The derived orbital parameters are listed in Table LABEL:orb. The RV modulation due to the binarity of the system is shown in the bottom panel of Fig. 1, while the top panel shows the RV measurements during the second run (the 9 nights in August 2005) with the orbital modulation removed.
| Parameter | Value |
|---|---|
| (days) | 7.83238 0.00002 |
| (HJD) | 53420.2304 0.0001 |
| 0 (fixed) | |
| (deg) | 0 (fixed) |
| (km s-1) | 20.2630 0.3 |
| (km s-1) | 7.2150 0.4 |
| (Gm) | 0.77708 0.00004 |
| (10-3 M⊙) | 0.30550 0.00005 |
| (m s-1) | 2.1 |
We note that most nights seem to exhibit the same shape: an increase of the RV, followed by a decrease. In fact, the radial velocities are correlated both with the airmass and with the ratio of the flux in the blue part of the spectrum to the flux in the red part. This modulation is related to the atmospheric extinction. At the accuracy of the m s-1, all spectrum orders show systematic differences in velocity. The time series computed from the cross-correlations, which are weighted means by the flux of correlations of each order, are thus correlated to the flux change. No corrections were applied in the online pipeline to take into account such atmospheric extinction changes. However, this effect should be corrected in the new online version of the pipeline (F. Pepe, private communication).
Although part of the analysis is based on both observing runs, the second run measurements are mainly used, because the complicated window function of the first run consisting of 4 half-nights leads to a less precise result, however in full agreement with the first run.
A very small variation, related to either intrinsic variations of the star or perhaps to a tiny eccentricity, remains in the data (i.e. shift of 1–2 m s-1 between nights). For this reason, the mean value for each night was also subtracted. This could slightly modify the power spectrum at very low frequencies, but has no influence in the range where oscillations are expected (Carrier et al. 2005b ).
| Date | Nb of spectra | Duration | Dispersion |
|---|---|---|---|
| (hours) | (m s-1) | ||
| 2005/08/01 | 134 | 7.63 | 2.09 |
| 2005/08/02 | 154 | 8.01 | 1.99 |
| 2005/08/03 | 169 | 8.57 | 1.94 |
| 2005/08/04 | 71 | 7.46 | 1.97 |
| 2005/08/05 | 72 | 8.66 | 2.27 |
| 2005/08/06 | 170 | 8.77 | 1.60 |
| 2005/08/07 | 167 | 8.61 | 2.67 |
| 2005/08/08 | 156 | 7.90 | 1.63 |
| 2005/08/09 | 150 | 8.23 | 3.05 |
3 Power spectrum analysis
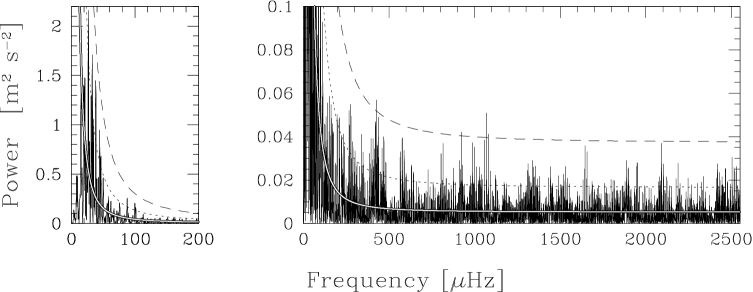
The power spectrum of the velocity time series was computed using the Lomb-Scargle modified algorithm (Lomb lomb (1976); Scargle scargle (1982)), and is shown in Fig. 2. Its time scale gives a formal resolution of 1.39 Hz. As typically observed in such a power spectrum, the noise is made of two distinct components:
-
•
At high frequencies the noise is flat, indicative of the Poisson statistics of photon noise. The mean white noise level calculated between 1.5 and 2.5 mHz is 0.00511 m2 s-2, corresponding to cm s-1 in amplitude (Kjeldsen & Bedding kb (1995)). With 1243 measurements, this high frequency noise corresponds to m s-1. This radial velocity uncertainty is exceptionally low for an A-star, but remains nevertheless over the photon noise uncertainty limit which is estimated by the pipeline at 0.5–1. m s-1. This small discrepancy could either be explained by an intrinsic variability of the star (such as granulation or stellar activity) or by an instrumental effect.
-
•
Towards the lowest frequencies, the power spectrum scales inversely with the square of the frequency, as expected for instrumental instabilities.
The mean noise is indicated by the white line in Fig. 2, along with the 2 value (dotted line) and 3 value (dashed line).
As discussed by Kjeldsen & Bedding (kb (1995)), the conversion to the power density requires multiplying the power spectrum by the effective observing time, calculated by integrating under the spectral window. Density spectra were built for both runs separately and also for the combined data. The effective observing time has a value of 0.87, 2.50 and 3.56 d for the first run, the second one and the combined data, respectively. The smoothed power density spectra are displayed in Fig. 3. The density spectrum of the first run is the most affected by noise because of the smaller number of measurements.
Scaling from the solar case (Kjeldsen & Bedding kb (1995)), the frequency of the greatest mode of HD~209625 would be expected to lie near 500–600 Hz, although this value cannot be trusted as the internal structure of an Am star is totally different from the one of a solar–type star. Solar-like oscillations are detected neither in the power spectrum (see Fig. 2) nor in a smoothed version of the density spectrum (see Fig. 3) at frequencies below 2500 Hz. Moreover, Fig. 2 shows that only two peaks (near 400 and 1100 Hz) have an amplitude greater than 3 , a result in agreement with pure noise (Carrier et al. 2005a ).

Although no oscillations could be detected by searching for a power excess directly in the periodogram or in the power density spectrum, we also tried to identify a comb-like structure in the power spectrum corresponding to solar-like oscillations, and in particular to = 0 modes, by computing autocorrelations (region by region and with different thresholds). However, no autocorrelation showed the presence of such a comb-like structure.

In order to determine a tighter upper limit on the oscillations, we also performed simulations: artificial modes were introduced while reproducing the overall noise level. The frequencies of these injected modes were separated by 20 Hz, while their amplitudes were described by a Gaussian enveloppe with a of 50 Hz; this corresponded to a few peaks over a small frequency range. The main free parameter in these simulations was the amplitude of the Gaussian. The other two parameters were also modified to check the independance of the results: no significant change was observed provided no more than 3 or 4 introduced peaks had a non-negligible amplitude. A Gaussian noise, randomly drawn (using Monte-Carlo simulations) and adjusted to give the same value as in the observed power spectrum, was then added to the time series. Using the same time sampling as observed, radial velocities were determined by assuming an infinite lifetime for the modes. Since the power spectrum of solar-like oscillations is known to depend on the poorly-known lifetime of the modes, we thus worked with the density spectrum, which is far less sensitive to the lifetime value. The density spectrum is expected to be flat if there is no signal. The noise introduces some modulation, characterized by the of the density spectrum. For each value of the introduced Gaussian amplitude, 1 000 different simulations were performed, leading to 1 000 density spectra. Different thresholds were used to determine the detection probability, ranging from to by steps of . Then, the number of density spectra where peaks larger than a given threshold were observed provided the detection probability, for this given threshold and Gaussian amplitude of the modes. Finally, the mean of the 3 highest amplitude modes was computed. Fig. 4 shows the detection probability of modes with a given mean amplitude, for different detection thresholds. In the observed density spectrum (Fig. 3), no peak above is seen. This threshold, when compared to the results of the simulations, means that oscillations with a mean amplitude of 3.05 (respectively 2.70) times the noise can be detected with a probability of 99 % (respectively 95 %).
4 Conclusion
We do not detect any solar-like oscillations in the Am star HD~209625: either this object does not exhibit any oscillations, or the amplitude of its oscillations is below our detection level.
To unambiguously detect a power excess due to solar-like oscillations (at the 99 % confidence level), the noise in the Fourier transform must be, at least, 3.05 times smaller than the amplitude of the oscillations. Therefore, the oscillation amplitude is below 20 cm s-1 if the star oscillates at frequencies above 800 Hz, and could reach 30 cm s-1 for oscillations with frequencies near 200 Hz. Such solar-like oscillations therefore remain, if they exist, very limited in amplitude.
This non-detection of solar-like oscillations with a clear upper limit puts strong constraints on the structure of near-surface convection zones predicted by theoretical models of Am stars. Indeed, these observations allow us to rule out all models of the Am star HD~209625 that predict a surface convection zone that would be able to excite solar-like oscillations with an amplitude larger than 30 cm s-1.
Acknowledgements.
Part of this work was supported by the Swiss National Science Foundation. JCL acknowledges support through the XMM-INTEGRAL PRODEX project and IAP contract P5/36.References
- (1) Abt, H.A., & Levy, S.G. 1985, ApJS, 59, 229
- (2) Bedding, T.R., & Kjeldsen, H. 2006, Memorie della Societa Astronomica Italiana, 77, 384
- (3) Carrier, F., Burki, G., & Burnet, M., 2002, A&A, 385, 488
- (4) Carrier, F., Eggenberger, P., & Bouchy, F. 2005a, A&A, 434, 1085
- (5) Carrier, F., Eggenberger, P., D’Alessandro, A., & Weber, L. 2005b, New Astron., 10, 315
- (6) Carrier, F., & Eggenberger, P. 2006, A&A, 450, 695
- (7) Connes, P. 1985, Ap&SS, 110, 211
- (8) Debernardi, Y. 2002, Ph.D. Thesis, Geneva Observatory, No 3362, ”Binarity of Am stars”
- (9) Eggenberger, P., Carrier, F., Bouchy, F., & Blecha, A. 2004, A&A, 422, 247
- (10) Kjeldsen, H., & Bedding, T.R. 1995, A&A, 293, 87
- (11) Lomb, N.R. 1976, Ap&SS, 39, 447
- (12) Martić, M., Lebrun, J.-C., Appourchaux, T., & Korzennik, S.G. 2004, A&A, 418, 295
- (13) Richer, J., Michaud, G., & Turcotte, S. 2000, ApJ, 529, 338
- (14) Richard, O., Michaud, G., & Richer, J. 2001, ApJ, 558, 377
- (15) Scargle, J.D. 1982, ApJ, 263, 835
- (16) Pepe, F., Mayor, M., Rupprecht, G., et al. 2002, Messenger, 110, 9
- (17) Turcotte, S, Richer, J., Michaud, G., & Christensen-Dalsgaard, J 2000, A&A, 360, 603