Nodeless Superconductivity in the Noncentrosymmetric Superconductor
Abstract
We measured the resistivity, diamagnetization and low temperature specific heat of the newly discovered noncentrosymmetric superconductor . It is found that the superconducting gap has an s-wave symmetry with a value of about 0.6 meV, and the ratio indicates a weak coupling for the superconductivity. The correlations among the normal state Sommerfeld constant , the slope near and the condensation energy are all consistent with the weak coupling picture. The separated phonon contribution from the specific heat shows that the conduction electrons of the atoms interact most strongly with the vibrations of themselves, instead of with that of the light element boron.
pacs:
74.20.Mn,74.20.Rp, 74.25.Bt, 74.70.DdThe study on superconductivity in noncentrosymmetric materials has attracted growing efforts in recent yearsGorkovPRL2001 ; FrigeriPRL2004 ; EdelsteinJETP1989 ; LevitovJETP1985 ; SamokhinPRB2004 . For most superconductors, the atomic lattice has a centrosymmetry, therefore the system is inversion symmetric. The orbital part of the superconducting order parameter has a subgroup which is confined by the general group of the atomic lattice. Due to the Pauli’s exclusion rule and the parity conservation, the Cooper pair with orbital even parity should have anti-parallel spin state, namely spin singlet, while those having orbital odd parity should have parallel spin state, i.e., spin triplet. If a system lacks the centrosymmetry, the triplet pairing may be instable leading to a mixture of singlet and triplet pairing. Theoretically novel features are anticipated in the noncentrosymmetric systemHayashiPhysicaC2006 . A nodal gap structure has been observed in showing the possibility of triplet pairing, while due to weaker spin-orbital couplingYuanHQPRL ; ZhengGQPRL , the nodal gap has not been observed in a material with similar structure. It is thus highly desired to investigate the paring symmetry in more materials with noncentrosymmetric structure.
The newly discovered superconductor (hereafter abbreviated as )Klimczuk with superconducting transition temperature K is one of the rare materials which have the noncentrosymmetry. This material has a space group of with large and complex unit cells each has about 45 atoms. To some extent it resembles the system since it has alkaline metals (Li, Mg), heavy transition elements (Pd, Pt, Ir) and the light element boron. Theoretically it was shown that the major quasiparticle density of states (DOS) derives from the d-orbital of the heavy transition elements. In this paper we present a detailed investigation and analysis on the superconducting properties, such as the energy gap, pairing symmetry, electron-phonon coupling strength and condensation energy etc. in . Our results suggest that the superconductivity in this system is of BCS type with an s-wave gap symmetry and a weak coupling strength.
The samples were prepared in two steps starting from pure elements of Mg (98.5%), Ir (99.95%) and B (99.999%) using a standard method of solid state reaction. Appropriate mixtures of these starting materials were pressed into pellets, wrapped in Ta foil, and sealed in a quartz tube with an atmosphere of 95% Ar/5% . The materials were then heated at 600 ∘ C and 900 ∘ C for 40 min. and 80 min., respectively. After cooling down to room temperature, the samples were reground and mixed with another 20% of Mg, then they were pressed into pellets and sealed in a quartz tube with the same atmosphere as used in the first step. In this process the sample was heated up to 900 ∘ C directly and maintained for 80 min. The synthesizing process here is similar to the previous work reported by the Princeton groupKlimczuk but still with some differences. For example, we used Mg powder instead of flakes to make the mixture more homogeneous. In addition the pressure in the sealed quartz tube may rise to nearly 4 atm at 900 ∘ C, which may considerably reduce the volatilization of Mg during the synthesis. The resistivity and the AC susceptibility were measured based on an Oxford cryogenic system (Maglab-Exa-12). The specific heat was measured on the Quantum Design instrument PPMS with temperature down to 1.8 K and the PPMS based dilution refrigerator (DR) down to 150 mK. The temperatures of both systems have been well calibrated showing consistency with an error below 2% in the temperature range from 1.8 K to 10 K.
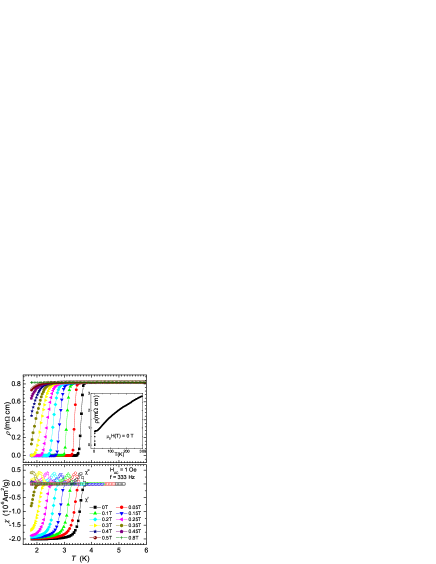
The x-ray diffraction (XRD) patterns taken on these samples show a single phase with very small amount of impurity which is comparable to that reported previouslyKlimczuk . After the first round of synthesizing, the superconducting transition inspected by the AC susceptibility occurs at about 5 K with a relatively wide transition. However, after the second step, the transition moves to about 3.7 K with a sharper transition width. This indicates a sensitive dependence of on the Mg content. In Fig. 1(a) we show the temperature dependence of resistivity under different magnetic fields. It is seen that the transition width ( ) is about 0.2 K. By applying a magnetic field the transition shifts to lower temperatures quickly with a rather low slope 0.3 . Using the Werthamer-Helfand-Hohenberg relationWHH , we get the upper critical field = 0.77 T. The AC susceptibility is shown in Fig.1 (b) revealing a similar behavior as the resistive transition. It is interesting to note that the value of the slope found here is lower than that in the earlier reportKlimczuk showing the tunability of superconducting properties in this system.
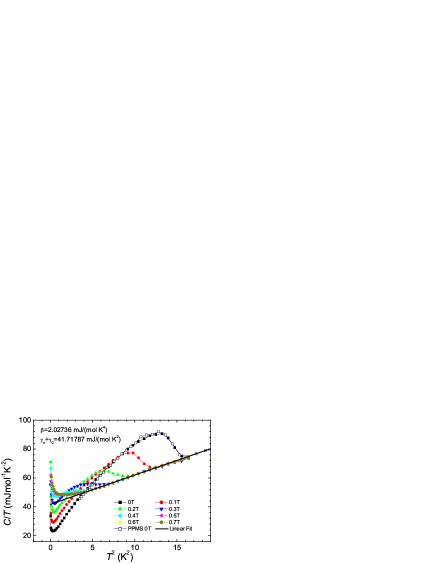
Shown in Fig.2 are the raw data of the specific heat. The open squares represent the data taken with PPMS, while all filled symbols show that taken with the DR. Both sets of data coincide very well at zero field. With increasing the magnetic field the specific heat jump due to the superconducting transition moves quickly to lower temperatures leaving a background which is consistent with that above at zero field. This provides a reliable way to extract the normal state specific heat as shown by the thick solid line since the normal state can be described by , where the first and the second terms correspond to the normal state electronic and phonon contribution, respectively. From the data it is found that = 2.03 and = 41.7 . In low temperature region ( 0.2 K) the superconducting state exhibits, however a residual value 22.1 indicating a non-superconducting fraction of about 53%. This high value of non-superconducting fraction is however difficult to be regarded as due to an impurity phase with completely different structure as since the XRD data is quite clean. We thus suggest that the superconductivity depends sensitively on the relative compositions among the three elements and some regions without superconductivity have the chemical composition and even the structure close to the superconducting phase. This will be justified in the following analysis. In any case, it is safe to conclude that the normal state Sommerfeld constant ranges from about 19.6 to 41.7 . Further analysis suggests that the real is close to the upper bound of the experimental values, i.e., 41. 7 .
Next we can have an estimation on . In , the electronic conduction is dominated by the 5d band electrons of atoms. The DOS at given by the LDA band structure calculationWiendlocha is about . Assuming a electron-phonon coupling constant in the system, one has
| (1) |
Using the band structure value of , we have = 25.98 . Taking the lower bound of the experimental value = 19.6 implies an un-physical value = - 0.25. Taking however, the upper bound of the experimental value = 41.7, we get = 0.6. Therefore it seems that the real value of is close to the upper bound of the experimental values. We can also use an alternative way to estimate . In the dirty limit, for a type-II superconductor, one hasJaffePRB1989
| (2) |
where =0.0081 for . Using , = 0.816 , and taking for the weak coupling case, we have = 45 which is also close to the upper bound of the experimental value.
In the raw data shown in Fig.2, one can see an upturn of in the very low temperature region. This upturn is known as the Schottky anomaly, induced by lifting the degeneracy of the states of the paramagnetic spins. We tried a two level (S=1/2) model to fit the low temperature data but found a poor fitting together with an extremely large Landé factor in the Zeeman energy , where is the Bohr magneton, = is the effective magnetic field which evolves into = , the crystal field at zero external field. In the most possible paramagnetic centers are from (S=5/2) or (S=2). The system energy due to Zeeman splitting in a magnetic field isSchottky
| (3) |
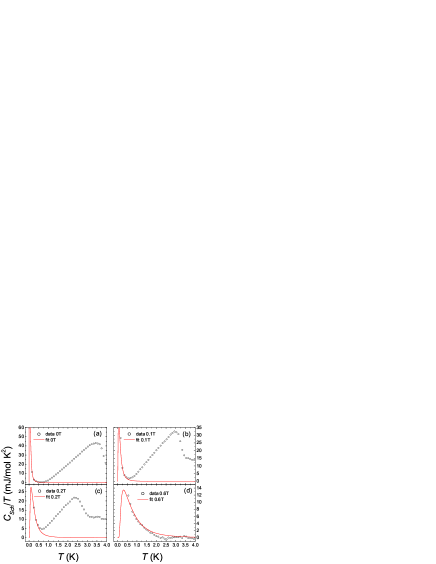
where and = -S, -S+1, …, S-1, S. The specific heat due to the Schottky effect is thus , where represents the concentration of the paramagnetic centers. For and the calculated results are very close to each other, therefore we show only the fit with correspoding to (six levels). This method allows us to deal with the data at zero and finite fields simultaneously. It is known that the Schottky term should be zero at T = 0 K. In the superconducting state, the total specific heat can be written as: with the contribution of the non-superconducting regions, is the electronic part. In the zero temperature limit only the contribution of the non-superconducting part is left. Applying a magnetic field gives rise to a finite value to due to the presence of vortices. Practically, in order to fit the Schottky term, we first remove the phonon contribution , then vertically move the experimental data downward with a magnitude = 22.1 and a field induced vortex term as shown in Table-I. Four sets of data after this treatment and the corresponding fits to the Schottky term at the fields of = 0.0, 0.1, 0.2, 0.6 T are shown in Fig.3. It is clear that low temperature upturn can be well described by the Schottky effect. The results yielded by the fitting are summarized in Table-I. One can see that when field is beyond 0.5 T which is close to the upper critical field, we take the total normal state value as the removed background which leads to a perfect fitting to the Schottky term as shown in Fig.3(d).
| (T) | (mJmol K2) | (T) | (mJmol K) | |
|---|---|---|---|---|
| 0.0 | ||||
| 0.1 | ||||
| 0.2 | ||||
| 0.3 | ||||
| 0.4 | ||||
| 0.5 | ||||
| 0.6 | ||||
| 0.7 |
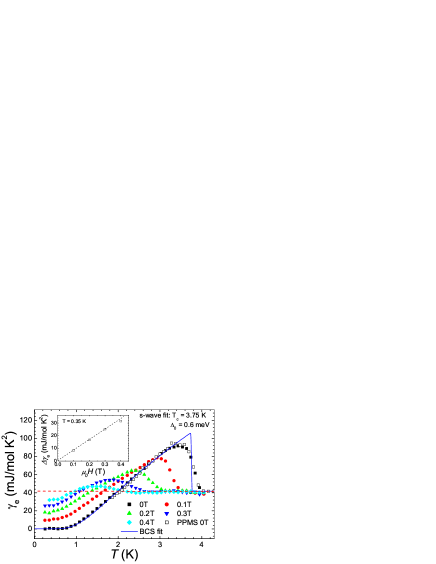
After successfully removing the Schottky term and the contribution from the non-superconducting region, we get the pure contribution from the superconducting regions (as shown in Fig.4). Note that here we used the value 41.7 as the normal state Sommerfeld constant if it would contain only the pure superconducting phase. One can see that the low temperature part is flattened out below about 0.8 K when the field is zero. Actually this flattening is already visible in the data shown in Fig.3(a) before the Schottky term is removed. Furthermore it can also be justified by the requirement of entropy conservation. Since the Schottky term gives only very small contribution in the high temperature region (above 1.5 K here), if had a power law instead of a flat temperature dependence here, the entropy would be clearly not conserved yielding a large negative entropy. This is of course unreasonable. In Fig.4 we present together the theoretical curve for calculated using the weak coupling BCS formula
| (4) |
where . In obtaining the theoretical fit we take the implicit relation derived from the weak coupling BCS theory for an s-wave superconductor and use the gap and as two trying parameters. The theoretical curve fits the experimental data very well leading to an isotropic gap value = and = . The ratio = 1.86 obtained here is quite close to the prediction for the weak coupling limit ( = 1.76). This is self-consistent with the conclusion derived from the estimation on . In addition, the specific heat anomaly at is 1.54 being very close to the theoretical value 1.43 predicted for the case of weak coupling. The inset in Fig.4 shows a field induced part . In an s-wave superconductor is mainly contributed by the vortex cores and a linear relation is anticipatedHussey in the low field region with . This linear relation is well demonstrated by the data below 0.4 T, indicating another evidence of s-wave pairing symmetry.
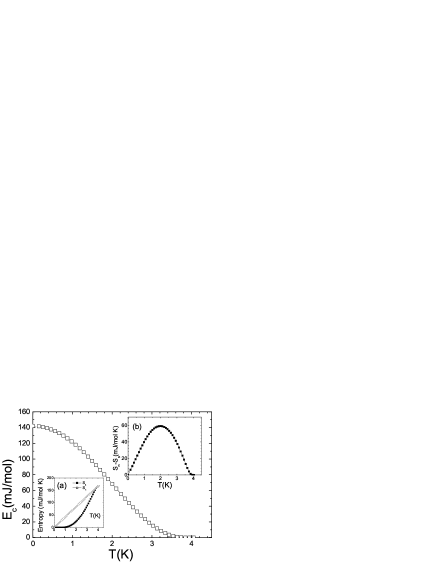
In the following we try to estimate the superconducting condensation energy . In calculating we get the entropy difference between the normal state and the superconducting state by , then is calculated through . The data of and as well as the difference between them are shown in inset (a) and (b) of Fig.5, respectively. The main frame of Fig.5 shows the temperature dependence of the condensation energy which is about 142 . This value can actually be assessed by the following equation
| (5) |
For a BCS s-wave superconductor, = 1. Taking and = 0.6 meV, we found a value of 154 which is very close to the experimental value 142 .
Now we get down to the electron-phonon coupling. From the normal state value we have derived that 2.03 . Using the relation =, where = 6.02 the Avogadro constant, Z=45 the number of atoms in one unit cell, we get the Debye temperature = 350.5 K. It is known that the Debye temperature for metallic is about 36 meV (420 K)Wiendlocha . While the crystalline boron has a very high Debye temperature = 100 meV (1200 K)Wiendlocha . The rather low Debye temperature found in our experiment = 350.5 K is close to that of metal, this may suggest that the conduction electrons from the 5d band of couple most strongly with the vibrations of themselves. However, as we stressed before, it seems that the can be tuned to higher values by changing the relative compositions among the three elements , and . This may enhance the electron-phonon coupling and/or the quasiparticle DOS at . The basic parameters and properties derived in this work provide a playground for the future study in this interesting system.
In summary, analysis on the low-temperature data in finds a s-wave pairing symmetry with a gap in the weak coupling regime. The conduction electrons interact primarily with the vibrations of the atoms leading to a weak coupling strength 0.6.
Acknowledgements.
We acknowledge the fruitful discussions with Tao Xiang and Junren Shi at IOP, CAS, and Guoqing Zheng at Okayama University, Japan. This work is supported by the National Science Foundation of China, the Ministry of Science and Technology of China (973 project No: 2006CB601000, 2006CB921802), and Chinese Academy of Sciences (Project ITSNEM).References
- (1) L. P. Gor’kov and E. I. Rashba, Phys. Rev. Lett. 87, 37004 (2001).
- (2) P. A. Frigeri et al., Phys. Rev. Lett. 92, 097001 (2002).
- (3) V. M. Edel’stein, Sov. Phys. JETP 68, 1244 (1989).
- (4) L. S. Levitov, Yu. V. Nazarov and G. M. Eliashberg, JETP Lett. 41, 445 (1985).
- (5) K. V. Samokhin, E. S. Zijstra and S. K. Bose, Phys. Rev. B 69, 094514 (2004); 70, 069902 (2004).
- (6) N. Hayashi et al., Physica C 437-438, 96 (2006).
- (7) H. Q. Yuan et al., Phys. Rev. Lett. 97, 017006 (2006).
- (8) M. Nishiyama, Y. Inada and Guo-qing Zheng, Phys. Rev. Lett. 98, 047002 (2007).
- (9) T. Klimczuk et al., Phys. Rev. B 74, 220502 (R)(2006).
- (10) N. R. Werthamer, E. Helfand, and P. C. Hohenberg, Phys. Rev. 147, 295 (1966).
- (11) J. E. Jaffe, Phys. Rev. B 40, 2558 (1989).
- (12) B. Wiendlocha, J. Tobola and S. Kaprzyk, Condmat/0704.1295.
- (13) H. M. Rosenberg, Low Temperature Solid State Physics (Oxford Univ. Press, 1963).
- (14) N. E. Hussey, Adv. in Phys. 51, 1685 (2002).