Properties of a Gamma Ray Burst Host Galaxy at 11affiliation: Based on observations obtained at the Gemini Observatory, which is operated by the Association of Universities for Research in Astronomy, Inc., under a cooperative agreement with the NSF on behalf of the Gemini Partnership: The National Science Foundation (United States), the Particle Physics and Astronomy Research Council (United Kingdom), the National Research Council (Canada), CONICYT (Chile), the Australian Research Council (Australia), CNPq (Brazil) and CONICET (Argentina)
Abstract
We describe the properties of the host galaxy of the gamma-ray burst GRB060510B based on a spectrum of the burst afterglow obtained with the Gemini North 8m telescope. The galaxy lies at a redshift of making it the fourth highest spectroscopically identified burst host. However, it is the second highest redshift galaxy for which the quality of the spectrum permits a detailed metallicity analysis. The neutral hydrogen column density has a logarithmic value of 21.0–21.2 and the weak metal lines of Ni, S and Fe show that the metallicity is in excess of a tenth of solar which is far above the metallicities in damped Lyman alpha absorbers at high redshift. The tightest constraint is from the Fe lines which place [Fe/H] in excess of . We argue that the results suggest that metallicity bias could be a serious problem with inferring star formation from the GRB population and consider how future higher quality measurements could be used to resolve this question.
Subject headings:
cosmology: observations — galaxies: distances and redshifts — galaxies: abundances — galaxies: evolution — gamma-ray: bursts1. Introduction
Long duration gamma-ray bursts are believed to form in the collapse of massive stars (e.g. Woosley 1993, Stanek et al. 2003) and hence to be a tracer of galaxies with ongoing star formation (Lamb and Reichert 2000). The afterglows associated with the burst are also extremely bright immediately post-burst and can be seen to very large redshifts, currently out to (Kawai et al. 2006). Prompt spectroscopy of the afterglow can therefore allow us to obtain the redshift of the galaxy in which the GRB has occurred and to study the metallicity of the interstellar medium in this host galaxy.
With the caveat that we still do not fully understand the selection biases introduced by the formation of the GRBs, this may be the best way in which we can study the properties of individual galaxies at very high redshifts () in detail. The galaxies themselves are too faint (magnitudes of about 25) for detailed spectroscopic study, nor can they be identified as damped L absorbers (DLAs) at these redshifts since the L forest becomes too thick to allow us to identify the DLAs and measure their column densities.
However, in order to take advantage of GRBs to study the high redshift galaxy population we must be able both to localize the GRB quickly and then to rapidly identify it as a candidate high redshift object. The satellite launched in 2004 (Gehrels et al. 2004) has made such studies possible by providing a large sample of GRBs with accurate positions to faint gamma ray detection thresholds. At the limits Jakobson et al. (2006a) estimate that about 7% of the GRBs are at so that there should be a handful of such objects available for study in each year of the mission.
Given this small number of available targets it is critical to observe as many as possible with the highest quality and highest resolution spectroscopy that we can obtain. However, even with the data this remains extremely challenging since we must first identify the afterglow and since the subsequent spectroscopy requires target of opportunity obervations (TOOs) on the largest ground based telescopes. Fortunately, some of the 8m class telescopes are operated in queue mode and can respond rapidly to such TOO events. The present program utilizes this capability on the two Gemini 8m telescopes where we can initiate observations with the GMOS spectrographs (Hook et al. 2004) almost immediately when a candidate high redshift burst is identified. The GMOS spectral resolution (R in the mode which we used) is not as high as desirable but is adequate for measuring the redshift and providing metallicity estimates if we can obtain high signal-to-noise spectra.
This Letter describes our GMOS observations of GRB060510B which we find to lie at a redshift of . This is the fourth highest redshift identified for a GRB (e.g. Jakobson et al. (2006b) for a recent summary) but is the second highest for which we can make a metallicity analysis. The highest redshift analysis is of the GRB (Kawai et al. 2006). We find that the metallicity is in excess of a tenth solar, which is much higher than is seen in DLAs at and also suggests that the metallicity of the GRB host galaxies is not changing as a function of redshift.
2. Observations
GRB060510B was detected by on May 10th 2006 at 8:22:24 UT. The XRT on began observing the area 119s after the trigger and a bright X-ray source was located at RA=15 56 29.3 and Dec=78 34 09.4 (J2000). The long duration gamma-ray burst was noted as a potential high redshift object (Krimm et al. 2006). A fading optical counterpart was detected by Mirabal and Halpern (2006) at RA=15 56 29.615 and Dec=78 34 13.02. The red (R-I) color was again suggestive of a possible high redshift candidate. NIRI observations with Gemini-North detected the counterpart with J19 at just over 2 hours after the trigger (Price et al. 2006a).
We obtained a spectrum with the GMOS spectrograph on Gemini North, commencing at 2006 May 10.547 UTC just over 2.5 hours after the burst (Price et al. 2006b). Four 1000s exposures were obtained with the 400 lines/mm grating giving a resolution of 1900 and wavelength coverage from 5950 Å to 10200 Å. Standard CCD reduction steps were performed with the gmos package within IRAF, pairs of exposures were sky-subtracted and combined, the spectra extracted using apextract, and the two spectra summed to yield the final product. The spectrum was approximately relatively flux calibrated using the instrument throughput. The final spectrum is shown in Figure 1.

The spectrum shows a damped L line and an exensive set of metal lines at a redshift of which we take to be the redshift of the host galaxy. Some of the stronger features in the spectrum are marked on Figure 1. The spectrum also shows a strong break across the L wavelength corresponding to the onset of the L forest at shorter wavelengths. The mean transmission in the L forest is 18%, consistent with L forest transmissions seen in quasar spectra at this redshift (Songaila 2004).
3. Host properties
We first measured a redshift of from the weaker singly ionized metal lines in the spectrum. Fits to the damped L and L lines centered at the wavelength corresponding to this redshift are shown in Figure 2. The best fit to the red wing of the damped L profile is given for a N(HI)= cm-2 and higher column densities are prohibited. The L profile favors a slightly lower value of N(HI)= cm-2 but this constraint is based on a single pixel which could be contaminated. We therefore adopt a range of for the logarithmic column density.


A second strong absorption feature seen in the L forest at 7100 Å is not saturated at L and is not a DLA. This neutral hydrogen excess may be caused by the higher density intergalactic medium in the vicinity of the galaxy and it will be interesting to see if this is common in GRBs at these redshifts since it could provide considerable infomation on the structure and ionization of the overdense regions in which the galaxies are forming.
Although we detect many lines from the galaxy, most are strong and, in low resolution spectra like the present one, the lower limits on the column densities which can be obtained from such lines are not particularly useful. We therefore focus on the weaker lines of Ni, S and Fe which are seen in the spectrum. The absorption profiles of some of these lines are shown in Figure 3.
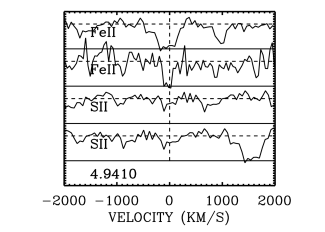

Even in these moderately weak lines saturation can be a problem and saturated components can be masked by unsaturated features in the lines. This problem, long familiar in interstellar medium studies, has recently been re-emphasized by Prochaska (2006) where an extensive discussion and critique of GRB host metallicity measurements can be found, as well as the many historical references on the topic. For the present work we measured the various Ni, S and Fe lines under the assumption that they are unsaturated and lie in the strictly linear portion of the curve of growth. The column densities measured in this way and their one sigma uncertainties are given in Table 1. We emphasize that these are only lower limits to the column density. If there are narrow saturated components concealed in the absorption lines the column density could be higher. However, even these lower limits already place a lower limit on the metallicity of about relative to solar (Asplund et al. asplund (2005) ; Table 2) which is already considerably higher than the values seen in DLAs at (Prochaska 2003). We illustrate this in Figure 4.
| Ion | (Å) | ||
|---|---|---|---|
| H I | 1215.67 | 0.416 | |
| Fe II | 1608.45 | 0.062 | |
| S II | 1250.58 | 0.005 | 15.6 (14.8 – 15.9) |
| 1253.81 | 0.011 | ||
| Ni II | 1317.22 | 0.145 | |
| 1370.13 | 0.131 | ||
| 1454.84 | 0.0595 | 14.4 (14.0 – 14.6) |
Note. — All errors are .
| Element | Solar | Relative |
|---|---|---|
| S | ||
| Fe | to | |
| Ni |
If the signal to noise is high enough we can use very weak lines to measure upper bounds on the metallicity even in low resolution spectra (e.g. Savaglio 2006). However, the quality of the very high redshift GRB spectra is not generally adequate to do this. We tested the limits we could obtain in the present data using the very weak Fe1611 and Ni1467 lines. In each case we created a model with two components each with and two broader () components and adjusted the column densities to fit the stronger lines. (Here is 0.60 times the full width at half maximum of the absorption line (Cowie & Songaila cs86 (1986)). We varied the column densities in the narrow components and compared the resulting Voigt profiles with the weak lines. Within the noise and continuum fitting uncertainties we cannot obtain a robust upper limit on the column densities.
The spectrum also shows strong high ionization lines with in excess of 14.5 and and in excess of 15. Strong fine-structure lines are seen for Si II, C II and O I, as is common to all the GRB absorbers (Vreeswijk et al. vreeswijk04 (2004); Berger et al. berger (2006); Chen et al. chen (2005)). Given the uncertainty in estimating the ground state column densities we do not attempt to infer gas densities but it is clear, as has been noted by many authors, that GRB absorption is produced in much higher gas density enviroments than DLAs in quasar sightlines, which only extremely rarely show such lines (e.g. Chen et al. chen (2005)).
4. Discussion

In Figure 4 we show all of the currently available metallicity measurements for GRB host galaxies from the references summarized in the figure caption. The present measurement of GRB060510B is shown as the filled diamond with upward pointing arrow to emphasize that it is strictly a lower limit. We have shown other measurements of the GRB hosts as open diamonds. We show measurements based on low resolution and moderate signal to noise spectra with upward pointing arrows on error bars while values based on high resolution or high signal to noise observations are shown with just the errors. Irrespective of redshift the bulk of the GRB metallicities reported so far lie at or above about a tenth solar. However, GRB hosts clearly have a wide range of metallicities, for example, compare GRB050730 (; Chen et al. 2005) with a metallicity of and GRB000926 (; Savaglio et al. 2003) with a value of .
The typical metallicity of GRB host galaxies is considerably higher than the metallicities found in DLAs, which are shown in Figure 4 as the filled squares. However, there is only one DLA with a measured metallicity (Songaila and Cowie 2002) so the comparison sample at the highest redshifts is very limited. This effect and the higher gas densities evidenced by the fine structure lines are natural consequences of the selection biases. GRB sightlines target star forming regions of galaxies where densities and metallicities will be higher, whereas the cross section-weighted DLAs in quasar sightlines probe more extended lower density and lower metallicity regions in galaxies and may also be weighted to intrinsically lower luminosity galaxies.
Ultimately we would like to use GRBs to probe the star formation history of the universe (Lamb and Reichert 2000, Price et al. 2006). They have many advantages for this purpose not the least of which is that they sample the rate at which individual stars form irrespective of the mass or luminosity of the host galaxy. We can therefore measure the total star formation over the entire range of galaxies. However, before we can do this we must understand the biases in the selection of the stars which become GRBs and determine whether we can succesfully allow for such selection effects.
The most probable bias is that GRBs occur only in low metallicity galaxies and that we may therefore miss all of the star formation occuring in more evolved systems. In the collapsar models GRBs are formed in single massive stars only if the metallicity is below 0.3 Z⊙ (e.g. Woosley and Heger 2006). If such a bias is present it could introduce a strong redshift dependence in the inferred star formation history if the average metallicity of the host galaxies is lower at high redshift.
The evidence of Figure 4 is somewhat confusing as regards this issue. In the first place it shows that while most metallicities in GRB hosts could fall below 0.3 Z⊙, at least one (GRB 000926, Z⊙, Savaglio et al. savaglio (2003)) has a metallicity well above the critical value. Fynbo et al. (2006) suggest that this indicates that collapsars resulting from single massive stars are not the only progenitors of long GRBs or that massive stars with Z 0.3 Z⊙ can also produce long GRBs. It is also possible that this particular GRB formed in a lower metallicity region of the galaxy than that traversed by the sight-line. However, if some of the measured metallicities are underestimates this problem would become much more severe and we would have to conclude that GRBs regularly formed in high metallicity environments. This issue clearly requires a much larger sample of very high quality spectra to resolve.
Furthermore if we do assume that GRBs are primarily formed in lower metallicity stars then Figure 4 strongly suggests that metallicity bias will be extremely important in determining star formation rates. Most of the measured values lie just below the critical value and presumably as their metallicity continues to increase would drop from the sample. Since a large fraction of the star formation would occur in the higher metallicity objects we would miss much of the activity. With precise metallicity measurements we could make a detailed comparison with models of the star formation to see if the distribution was consistent and the metallicity threshold was evident but such a comparison is premature given the present quality of the data.
References
- (1) Asplund, M., Grevesse, N., & Sauval, A. J. 2005, ASP Conference Series, 336, 25
- (2) Berger, E., Penprase, B. E., Cenko, S. B., et al. 2006, ApJ, 642, 979
- (3) Chen, H.-W., Prochaska, J. X., Bloom, J. S., & Thompson, I. B. 2005, ApJ, 634, L25
- (4) Cowie, L. L. & Songaila, A. 1986, ARAA, 24, 499
- fynbo et al. (2006) Fynbo, J. P. U., et al. 2006, A&A, 451L, 47
- (6) Gehrels, N., Chincarini, G., Giommi, P., et al. 2004, ApJ, 611, 1005
- (7) Hook, I., et al. 2004, PASP, 116, 425 ApJ, 611, 1005
- (8) Jakobsson, P., Levan, A., Fynbo, J. P. U., et al. 2006a, A&A, 447, 897
- (9) Jakobsson, P., Fynbo, J. P. U., et al. 2006b, A&A, 460L, 13
- Kawai et al. (2006) Kawai, N., Kosugi G., Aoki, K., et al., 2005, Nature 440, 184
- (11) Krimm, H. A., et al. 2006, GCN Circ. 5096
- (12) Lamb, D. Q., & Reichart, D. E. 2000, ApJ, 536, 1
- (13) Ledoux, C., Vreeswijk, P. and Ellison, S., 2005, GCN Circ. 3860
- (14) Mirabal, N., and Halpern, J., 2006, GCN Circ. 5097
- (15) Price, P., et al. 2006a, GCN Circ. 5101
- (16) Price, P., et al. 2006b, GCN Circ. 5104
- (17) Price, P. A., Cowie, L. L., Minezaki, T., et al. 2006, ApJ, 645, 851
- (18) Prochaska, J. X., Gawiser, E., Wolfe, A. M., Castro, S., & Djorgovski, S. G. 2003, ApJ, 595, L9
- (19) Prochaska, J. X., Chen, H.-W. & Bloom, J. S. 2006, ApJ, 649, 95
- (20) Prochaska, J. X., 2006, ApJ, 650, 272
- (21) Savaglio, S., Fall, S. M., & Fiore, F. 2003, ApJ, 585, 638
- (22) Savaglio, S., 2006, NJPh, 8, 195
- (23) Songaila, A. and Cowie, L., L., 2002, AJ, 123, 2183
- (24) Songaila, A., 2004, AJ, 127, 2598
- (25) Stanek, K. Z., Matheson, T., Garnavich, P. M., et al. 2003, ApJ, 591, L17
- (26) Starling, R. L. C., Vreeswijk, P. M., Ellison, S. L., et al. 2005, A&A, 442, L21
- (27) Vreeswijk, P. M., Ellison, S. L., Ledoux, C., et al. 2004, A&A, 419, 927
- (28) Vreeswijk, P. M., Smette, A., Fruchter, A. S., et al. 2006, A&A, 447, 145
- watson et al. (2006) Watson, D., et al. 2006, ApJ, 652, 1011
- (30) Woosley, S. E. 1993, ApJ, 405, 273