The inner jet of radio galaxy NGC 315 as observed with Chandra and the VLA
Abstract
We present Chandra X-ray results for the jet, nucleus, and gaseous atmosphere of NGC 315, a nearby radio galaxy whose jet kinematics are known through deep radio mapping. Diffuse X-ray synchrotron emission is detected from the jet out to 30 arcsec from the nucleus, through regions both of fast bulk flow and deceleration. The X-ray to radio flux ratio drops considerably where the flow decelerates, but the X-ray and radio emissions show similar transverse extents throughout, requiring distributed particle acceleration to maintain the supply of X-ray-emitting electrons. A remarkable knotty filament within the jet is seen in both the radio and X-ray, contributing roughly 10 per cent of the diffuse emission along its extent at both wavelengths. No completely satisfactory explanation for the filament is found, though its oscillatory appearance, roughly aligned magnetic field, and requirements for particle acceleration, suggest that it is a magnetic strand within a shear layer between fast inner and slower outer flow.
keywords:
galaxies: active – galaxies: individual: NGC 315– galaxies: jets – radiation mechanisms: non-thermal – radio continuum: general – X-rays: galaxies1 Introduction
The nearby elliptical galaxy NGC 315 has long been known to be the host of an FRI (Fanaroff & Riley, 1974) radio source whose jets extend for a degree on the sky (Fanti et al., 1976; Bridle et al., 1976; Willis et al., 1981; Jägers, 1987; Laing et al., 2006a). The radio jets are one-sided in their inner regions (with evidence for acceleration on parsec scales found by Cotton et al., 1999), but become increasingly symmetrical on kpc scales. This is consistent with the hypothesis of a decelerating relativistic flow, as discussed by Bicknell (1994). More recent modeling by Canvin et al. (2005) finds an on-axis flow speed of 0.9 prior to deceleration at a projected angle of 14 arcsec from the core, and a jet inclination to the line of sight of degrees. Deceleration is likely to result from mass-loading of the jets, either from entrainment of the external interstellar medium (ISM) or from stellar mass loss within the jet. The ISM fundamentally affects jet propagation via pressure gradients and buoyancy forces (e.g., Bicknell, 1994; Worrall, Birkinshaw & Cameron, 1995; Laing & Bridle, 2002b), so a knowledge of the density and pressure of the hot ISM, which can be determined directly from X-ray observations, is essential to an understanding of jet dynamics.
Earlier Chandra observations of NGC 315 found an X-ray jet coincident with the stronger radio jet (Worrall, Birkinshaw & Hardcastle, 2003). The present paper gives the results of a deeper Chandra observation, and in particular discusses the association of coherent, filamentary structures in the radio jet with X-ray emission. We also present the density and pressure of the ISM on the scales of the X-ray-emitting jet, as determined from this more sensitive observation.
The redshift of NGC 315 is (Trager et al., 2000). In this paper we adopt values for the cosmological parameters of km s-1 Mpc-1, , and . Thus 1 arcsec corresponds to a projected distance of 335 pc at NGC 315, and a deprojected distance along the jet of 544 pc. Spectral index, , is defined in the sense that flux density is proportional to . J2000 coordinates are used throughout.
2 Observations
2.1 Chandra
We observed NGC 315 in VFAINT data mode with the back-illuminated CCD chip, S3, of the Advanced CCD Imaging Spectrometer (ACIS) on board Chandra on 2003 February 22 (OBSID 4156, sequence 700835). Details of the instrument and its modes of operation can be found in the Chandra Proposers’ Observatory Guide111 http://cxc.harvard.edu/proposer. Results presented here use ciao v3.2.2 and the caldb v3.1 calibration database. We re-calibrated and analysed the data, with random pixelization removed and bad pixels masked, following the software “threads” from the Chandra X-ray Center (CXC)222 http://cxc.harvard.edu/ciao. Only events with grades 0,2,3,4,6 were used.
There were some intervals during the observation when the background rate as much as doubled, and these periods (about 5 per cent of the exposure) were removed, leaving a calibrated dataset with an observation duration of 51.918 ks.
The observation was made with a 512-row subarray, giving a 4 by 8 arcmin field of view in the S3 CCD. The S1, S2, and S4 CCDs were also active. The subarray was used to reduce the readout time to 1.74 s and so decrease the incidence of multiple events within the frame-transfer time. In our earlier 5 ks observation (Worrall et al., 2003) we used a 128-row subarray with a 0.44 s readout time, and pile-up was negligible at the core. With the knowledge of the core count rate from that observation, we selected the 512-row subarray for the longer observation in order to increase the field of view while still restricting pile-up at the core to 5 per cent. The jet was aligned in the 8 arcmin direction. We took advantage of VFAINT cleaning except for spectral analysis of the core, since piled-up events take on the appearance of VFAINT background events and removing them would lead to an underestimate (albeit small) of the core flux.
We shifted the X-ray image by 0.12 arcsec, mostly in right ascension, to register the X-ray core with the radio-core position given in the VLA Calibrator Database333 http://www.vla.nrao.edu/astro/calib/manual/csource.html, , . This amount of shift is within Chandra’s absolute aspect uncertainties444 http://cxc.harvard.edu/cal/ASPECT/celmon/.
2.2 Radio
The observations and reduction of the 5 GHz VLA radio data used in this work are described in Laing et al. (2006a). We used intensity images made with beams of 0.4 arcsec and 1.5 arcsec FWHM for comparison with the X-ray emission in the inner and outer parts of the jet, respectively. The radio images were shifted by arcsec to align the core with the position given in Section 2.1. We used Stokes , and images at a resolution of 0.4 arcsec to derive the distributions of degree of polarization and -vector position angle at 5 GHz. The degree of polarization was corrected to first order for Ricean bias (Wardle & Kronberg, 1974). The effects of Faraday rotation were removed from the position angles using a two-frequency rotation-measure image at 1.5 arcsec resolution (fig. 11d of Laing et al., 2006a). Ambiguities in the position-angle differences were determined using a five-frequency rotation-measure fit at 5.5 arcsec resolution. The average correction for Faraday rotation over the base of the jet is 16 degrees, and the maximum variation over the region is 2.4 degrees. Errors in the correction for Faraday rotation are estimated to be degree. Depolarization between 5 and 1.4 GHz is negligible (section 5.2 of Laing et al., 2006a), and there is therefore no evidence either for internal Faraday rotation or for significant unresolved gradients in foreground rotation.
3 Jet Results
3.1 Radio-jet morphology and polarization
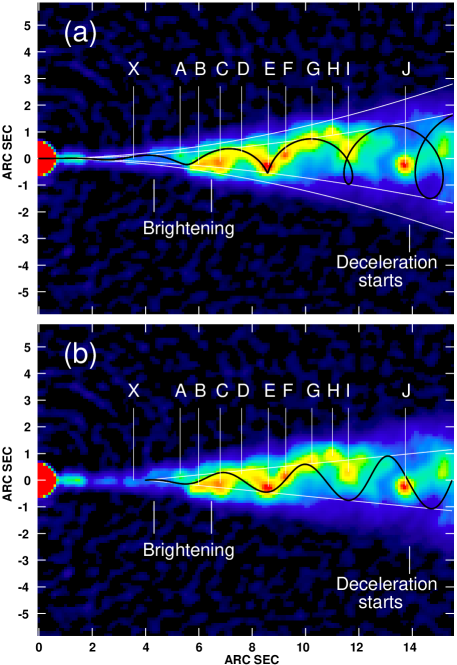
The radio jet is relatively faint and unresolved in width out to about 4 arcsec from the core, after which it brightens and contains a prominent oscillatory filament displaying a number of discrete knots (Fig. 1c). The radio ridge line is not perfectly straight closer to the core than 4 arcsec, but whether or not this is an inner extension of the filament cannot be addressed by our current data.
We have examined the polarization structure of the jet and filament. Figure 2a shows vectors whose lengths are proportional to the degree of polarization and whose directions are along the apparent magnetic field, superimposed on a grey-scale of total intensity. Canvin et al. (2005) concluded that the high polarization at the edge of the jet is from a roughly equal mixture of toroidal and longitudinal components, and that the average on-axis field (without treating the filament as a separate entity) is close to isotropic.
The high degree of polarization at the edges of the jet makes it difficult to separate the polarized emission due to the filament from that of the surrounding jet plasma. We derived a rough estimate of the polarization of the filament alone on the assumption that the emission from the rest of the jet is axisymmetric, as follows:
-
1.
We first chose the origin of polarization position angle to be along the jet axis so that Stokes and (corrected for Faraday rotation as described in Section 2.2) are respectively symmetric and antisymmetric under reflection in the axis for an intrinsically axisymmetric brightness distribution.
-
2.
We then blanked the , and images in the area covered by the filament (estimated by eye).
-
3.
The assumption that the remaining emission is, on average, axisymmetric then allowed us to replace pixels in the blanked region by their equivalents on the other side of the mid-line. This procedure does not work for points close to the mid-line, where we assumed instead that (exactly true on the mid-line for the models of Canvin et al., 2005) and interpolated from nearby pixels outside the filament area.
-
4.
Finally, we subtracted these estimates of the diffuse emission from the original , and data to leave images of the filament alone.
The results are shown in Figure 2b, on which the most prominent radio knots are labelled. Running along the radio filament, the apparent magnetic-field vectors appear roughly parallel to the filament out to component I, with knot G the main exception, making the filament a ‘magnetic strand’. The typical fractional polarization is high at for knots A through I. The exception is the bright knot E, where the average , but there is a null in the polarization at the brightness peak, plausibly resulting from averaging over a change in direction of the filament if the apparent field remains aligned. After component I, where the filament becomes poorly defined, the vectors are roughly perpendicular to the overall jet direction, as in the compact, radio-bright, and highly polarized component J. There is no evidence for any anomalous Faraday rotation or depolarization associated with the filament (see section 2.2).
3.2 The X-ray properties of the radio jet
The core, galaxy atmosphere, and resolved X-ray jet that were detected in the earlier short Chandra observation (Worrall et al., 2003) are measured with greater precision in the new data. Because the galaxy atmosphere has a soft X-ray spectrum, data from the relatively hard 0.8-5 keV X-ray band are selected for comparison with the radio data in Figures 1 and 3.
3.2.1 X-ray and radio morphological comparison
Working outwards from the core, the innermost 3 arcsec of the radio jet cannot be matched with X-ray features because here the X-ray emission from the core and the NGC 315 galaxy are relatively bright. The first X-ray feature we identify with the jet is 3.6 arcsec from the core at , . (Fig. 1b). To investigate the reality of this feature and the probability that it is associated with the jet, we extracted counts from a circle of radius 0.7 arcsec around the source. Following Worrall et al. (2003), we used the iraf stsdas task ellipse to model the galaxy atmosphere, based on the 0.3–2 keV data smoothed with a Gaussian of arcsec, and used the resulting intensity contours to define an elliptical annulus of full width 1.4 arcsec, centred on the core, in which the source circle falls. At 0.8–5 keV, the source circle contains 40 counts, whereas the average value for a circle of the same size lying anywhere in the annulus is 14.7 counts, making the detection highly significant. The largest number of counts in a circle of the same size positioned anywhere else in the annulus is 23, and therefore it is unlikely to be a coincidence that the circle with 40 counts lies in projection on the radio jet. This inner X-ray knot lies in a region of weak extended radio emission from the inner jet, and there appears to be no significantly enhanced radio emission at its position.
The complex incorporating knots A through D in Figure 2b is bright in both X-ray and radio (Fig. 1d), and shows particularly close structural similarities. Throughout the region to knot I there is distributed X-ray emission over the full extent of the diffuse radio jet, and localized X-ray peaks follow the ridge line.
The outermost structure in Figure 1, incorporating knot J in Figure 2b), is where the radio filament shows considerable brightness fluctuations, and by this point the coherent structure has been lost, with the filament broken into pieces. The filament appears to be breaking up where the jet broadens in both radio and X-ray, and the flow is thought to slow down. The general correspondence between the radio and X-ray emission is still good, despite the poorer X-ray photon statistics. However, the bright, compact radio component J () has only a faint X-ray equivalent, despite being as bright as knot E at 5 GHz.
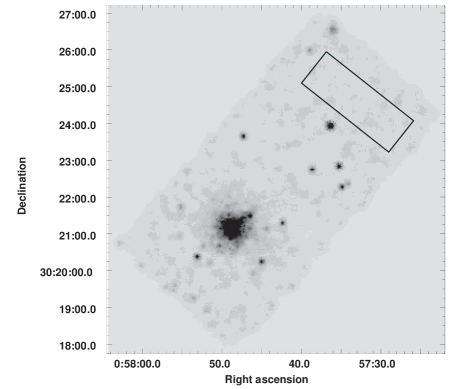
In the outer reaches of the X-ray jet (Fig. 3) where coherent and compact radio features cease, we nonetheless see a correspondence between brighter X-ray and radio emission as far out as the feature at . The X-ray source at has no particular relationship with the radio jet and is likely to be a background object. However, the faint structure at and the diffuse emission around it (about from the nucleus) do appear to be jet related, and mark the furthest extent to which we are confident that X-ray jet emission is detected. Thus although the X-ray emission is brightest in the first 14 arcsec of the jet, it is also detected in the region between 14 and 30 arcsec where the jet is decelerating.
3.2.2 Jet spectrum and Intensity
We used the on-source region shown in Figure 4 and the background region shown in Figure 5 to measure the composite spectrum of the X-ray jet in the region containing the radio filament, between 3.2 and 16.2 arcsec from the nucleus. There are 696 net counts between 0.3 and 5 keV. The emission has a soft spectrum. A fit to a single-component absorbed power law is poor ( for 18 degrees of freedom). As anticipated, since the jet is projected on significant thermal X-ray emission, an improvement was obtained when a thermal model was included, accounting for about 22 per cent of the counts. A fit with the only source of absorption being that in our own Galaxy ( cm-2; Dickey & Lockman (1990) gives for 15 degrees of freedom.


The jet X-ray spectrum is shown in Figure 6. The best-fit gas abundance is 0.25 solar, but while this parameter is very poorly constrained the other parameters of the fit (except for the gas emission measure) are insensitive to the value adopted. Uncertainties in and power-law index (Fig. 7) are found with the abundance constrained to lie between 10 and 100 per cent of solar. The gas temperature is consistent with that found generally for the NGC 315 galaxy (see Sec. 4.2). The jet spectrum, with its best-fit slope of is relatively steep, and steeper than the core spectrum (see Sec. 4.1). decreases slightly if a small level of intrinsic absorption, as may occur from cold gas in the NGC 315 galaxy, is included in the fits, and then the power-law index increases by a few tenths. While the statistics are insufficient to claim that this excess absorption is significant, we can conclude at 3 confidence that the power-law index is no flatter than .
The radio spectral index in the region over which the X-ray spectrum has been extracted is , whereas our best estimate for is . The X-ray luminosity in the region in which the jet spectrum has been extracted is ergs s-1 (0.3-5 keV), and the 1 keV flux density corrected for Galactic absorption is nJy. This is more accurately determined than our previously published value because we now have an X-ray spectral measurement. The corresponding radio flux density of 74 mJy leads to a radio-to-X-ray spectral index of . While the jet has yet to be detected in the optical, requires, in the simplest case, a broken power-law spectrum, and supports a synchrotron origin for the X-ray emission. Although the optical upper limits from the HST imaging of Verdoes Kleijn et al. (1999) lie significantly above an extrapolation of the radio spectrum between 1.4 and 5 GHz, the upper limit of Jy at 4500Å of Butcher et al. (1980), based on ground-based observations, requires the spectrum to steepen between the radio and optical.
The radio flux density of the filament alone (estimated from the image shown in Fig. 2b, convolved to a resolution of 0.6 arcsec FWHM to match the Chandra point-spread function) is 7.3 mJy, which is 10 per cent of the radio flux from the rectangular region shown in Figure 4 that contains 696 net X-ray counts (0.3–5 keV). The convolved radio image was used to define a mask covering the area of the filament, and 184 X-ray counts (0.3-5 keV) were summed over the mask. Since the mask allows through both filament and diffuse-jet X-ray counts, it was necessary to estimate and subtract the background contributed by the diffuse jet by sampling regions within the jet envelope that are adjacent to the filament. The wiggly nature of the filament means we sampled diffuse regions at similar transverse distances from the jet axis as the filament. The background estimate was 94 counts, giving a statistically significant 90 net X-ray counts. Within the rather large statistical uncertainties (13 per cent), and harder to quantify systematic uncertainties in the diffuse-jet contribution, this is consistent with being the same fraction of total jet emission as in the radio.


A comparison of the profiles of X-ray and radio emission down the jet are shown in Figure 8. The X-ray emission drops relative to the radio beyond 16 arcsec where the jet is decelerating. There is reasonable agreement in jet width between the radio and X-ray in both the fast and decelerating regions of the jet (Fig. 9), although the X-ray statistics in the decelerating region are relatively poor. An implication is that the processes which govern the relative amounts of diffuse X-ray and radio emission depend primarily on distance from the nucleus and do not vary significantly across the jet.
4 Other X-ray components
4.1 The central region
We extracted the X-ray spectrum for a circle of radius 1 arcsec centred on the core, using the background region shown in Figure 5. In contrast to the situation for the short observation, where a single-component power law gave a good fit, the improved statistics of the new data require the inclusion of a thermal component, as found also by Donato, Sambruna & Gliozzi (2004). 6.6 per cent of the counts (significant only below 1 keV) arise from the thermal component in our best composite fit, for which for 94 degrees of freedom. Although the abundance of the gas is poorly constrained, the best-fit value is solar, and this was frozen in the estimates of the uncertainties on the other parameters in this fit.


The X-ray spectrum of the core (Fig. 10) is strikingly harder than that of the jet (Fig. 6), and the fitted power-law index is indeed significantly flatter than that of the jet, taking into account the uncertainties (compare left panel of Fig. 11 with Fig. 7). Application of the pileup model available in xspec finds that pileup (estimated to be per cent) has negligible effect on our spectral fits. Table 1 gives the fitted power-law model parameters for both the core and jet regions.
| Structure | (cm-2)a | (nJy) | |
|---|---|---|---|
| Core | |||
| Jetb | 0 f |
90% uncertainties for 1 interesting parameter (). For both structures a thermal component is also included in the spectral fits. a. Excess over Galactic column density. f = fixed. b. For the region shown in Figure 4.
In agreement with our earlier results and those of Donato et al (2004), intrinsic absorption of cm-2 is required for the power-law component (Fig. 11) which, corrected for absorption and the point spread function, has a 1 keV flux density of Jy (90% uncertainty for 1 interesting parameter) and a 0.5-8 keV luminosity of erg s-1. The relatively low intrinsic absorption supports our earlier conclusions that the measured core emission from this source is predominantly jet-related in origin (Worrall & Birkinshaw, 1994; Worrall et al., 2003). NGC 315 is a dusty galaxy with a resolved disk-like structure (measured with the Hubble Space Telescope) that is responsible for a reddening of (de Ruiter et al., 2002). We can use the expression given in Wilkes et al. (1994) (based on Burstein & Heiles, 1978) to convert reddening into hydrogen column density under the assumption of a Galactic dust-to-gas ratio, and find cm-2, insufficient by an order of magnitude to account for the X-ray absorption. However, de Ruiter et al. (2002) also estimate a dust mass from IRAS 100 m data that is a thousand times larger than that inferred from the reddening absorption study, and Leon et al. (2003) report the detection of carbon monoxide with a double-horned line profile characteristic of a rotating disk or torus, and estimate a molecular gas mass of M⊙. The precise nature and location of most of the gas and dust in NGC 315 is currently unknown, and some could be associated with an inner torus. While (weak) broad emission lines have been detected (Ho et al., 1997), the results do not constrain the properties of a possible torus, as lines are seen in both direct and reflected (polarized) light (Barth, Filippenko & Moran, 1999).
If we wish to measure the accretion efficiency of the central source we should allow for the possible presence of a torus to prevent underestimating the central luminosity. Even with a fitted column density of less than cm-2, the X-ray observations do not rule out the presence of an inner torus with a line-of-sight column density of, for example, cm-2; they merely set an upper limit on the X-ray luminosity that can lie behind such a putative torus (e.g., Worrall & Birkinshaw, 2005; Evans et al., 2006). The high quality of the X-ray dataset for NGC 315 allows us to determine whether this luminosity is consistent with that expected for accretion at close to the Eddington limit onto a standard, geometrically thin and optically thick accretion disk (Shakura-Sunyaev or similar) or whether a radiatively inefficient accretion flow (e.g., Narayan & Yi, 1994; Blandford & Begelman, 1999) is suggested. In the case of NGC 315, for a photon spectral index of 2.0 we find that any concealed X-ray component has 90%-confidence upper limits at 0.5-8 keV of or erg s-1 if absorbed by gas with or cm-2, respectively. Since empirical relations find a black-hole mass of M⊙ (Bettoni et al., 2003; Marchesini et al., 2004), the limits must be compared with an Eddington luminosity of erg s-1. Even allowing for output at wavelengths other than the X-ray, accretion in NGC 315 must be greatly sub-Eddington or radiatively inefficient.
Scaling the 3690 counts (0.4-7 keV) from the core by observing time, we would have expected counts in our earlier short observation, in agreement with the counts detected (Worrall et al., 2003). Thus we have no indication that the core has varied in intensity over the 28 months between the observations. However, Fabbiano et al. (1992) and Worrall & Birkinshaw (2000) present evidence that the X-ray core intensity has varied historically, and the radio flux density from the parsec-scale core has shown considerable variation in the recent past (Cotton et al., 1999; Lazio et al, 2001).
The central gas as measured from the core spectrum (Fig. 11) is relatively cool as compared with the rest of the galaxy gas, consistent with a cooling time that is short compared with the Hubble time (Sec. 4.2). We find a density of 0.28 cm-3 and pressure5551 Pa = 10 dyne cm-2 of Pa when we model the gas as a uniform sphere of radius 1 arcsec. The consistency of this pressure with that of adjacent regions where the contribution from the core is small (Sec. 4.2) lends supporting evidence that we are applying the correct composite model to the core emission.
4.2 Properties of the X-ray-emitting gas
The deeper observation allows the temperature and distribution of the diffuse X-ray-emitting gas around NGC 315 to be measured with greater precision. As in Worrall et al. (2003) we extracted a radial profile and fitted it to the combination of a point source (for the core) and -model666Surface brightness proportional to , where is the core radius (Cavaliere, A. & Fusco-Femiano, 1978; Sarazin, 1986), both convolved with the point spread function. Out to a radius of about 40 arcsec the gas is well described by the model, but beyond this it drops off more sharply. This drop-off will be discussed elsewhere, together with the implications for the dynamics of the jet.
Out to the maximum radius of the resolved X-ray jet the gas is fitted with a model of core radius arcsec and (1 uncertainties for two interesting parameters). We can convert the distribution of integrated counts to an intrinsic profile of pressure using equations given in Birkinshaw & Worrall (1993) (for further details see Worrall & Birkinshaw, 2006) if the gas is isothermal. However, here there is a complication. The counts extracted from a source-centred annulus of radii 42 and 120 arcsec, using the region in Figure 5 as background, give a good fit ( for 77 degrees of freedom) to a thermal model with keV (90% uncertainties for 1 interesting parameter) which is significantly hotter than in the central region (Fig. 11). To estimate the temperature of gas at radii where the resolved X-ray jet is best measured, we used an on-source annulus of radii 4 and 20 arcsec (appropriate for projected distances along the jet between 2.5 and 12 arcsec for an adopted angle to the line of sight of 38 degrees) with background measured from an adjacent annulus of radii 20 and 42 arcsec, in each case excluding a pie slice of 30 degrees around the jet direction. The data fit mostly a thermal model, but include a small contribution from the wings of the point spread function that is fitted with a power law of spectral index and absorption consistent with those found from the central 1-arcsec circle. Uncertainties in the temperature and abundance are shown in Figure 12. The gas here is at a temperature between that in the core and that in the outer reaches of the gas distribution. Table 2 is a summary of the measured temperatures for different angular radii from the nucleus.

| Region | Radii from nucleus | (keV)a | |
|---|---|---|---|
| (arcsec) | |||
| Corec | 1 f | ||
| Inner gasd | 4 – 20 | ||
| outer gas | 42 – 120 |
a. 90% uncertainties for 1 interesting parameter (). b. Abundances as a fraction of Solar. f = fixed. c. Model-fit to data from region includes power-law core emission. d. Region excludes that of the X-ray jet. Model-fit to data includes small component of power-law emission from the wings of the point spread function describing the nucleus.

While there is a significant degree of non-isothermality in the gas distribution, the pressure structure is dominated by the change in gas density with radius, and the assumption of a constant temperature is an adequate description of the jet’s environment between 4 and 20 arcsec. Figure 13 shows the run of gas pressure with distance from the core. The external gas pressure will be combined with the kinematical models of Canvin et al. (2005) into a dynamical model for the jet in a forthcoming paper. The gas cooling time is short, at years and years at 15 arcsec ( kpc) and 4 arcsec ( kpc) from the core, respectively.
5 Discussion
5.1 Particle-acceleration constraints from the X-ray emission
The radio jet emission is well established as being synchrotron radiation from a plasma whose relativistic bulk motion produces the initial brightness asymmetry between the jet and the counterjet. The physical coincidence and morphological similarity of the X-ray and radio jets strongly suggest that they share a common origin within the relativistic bulk flow. Inverse-Compton models applied to the radio-emitting electron population for the dominant sources of scattered photons (jet synchrotron, cosmic microwave background), assuming minimum energy, significantly underpredict the observed X-ray emission. For the diffuse jet region over which the X-ray spectrum is extracted, the magnetic field strength, , would need to be at least a factor of 45 below the minimum-energy value, , increasing the total energy in the source by at least a factor of 280 as compared with minimum energy. This is in contrast to the range typically measured for diffuse radio-emitting plasma where the X-ray emission is reliably associated with inverse Compton scattering (Croston et al., 2005). The results therefore support a synchrotron origin for the X-ray emission, which thus marks regions where large numbers of electrons can be accelerated to high energies.
The X-ray knot closest to the core, at a distance of 4 arcsec, lies where the radio emission is still relatively weak but slowly increasing, before the abrupt brightening. NGC 315 is therefore similar to 3C 66B (Hardcastle, Birkinshaw & Worrall, 2001), 3C 31 (Hardcastle et al., 2002) and 3C 15 (Kataoka et al., 2003; Dulwich et al., 2007) in showing X-ray emission in the radio-faint region immediately before the abrupt radio brightening. In the symmetrical, relativistic model of NGC 315 developed by Canvin et al. (2005), the increase in rest-frame emissivity which leads to the radio brightening occurs at the same distance from the nucleus in the main- and counter-jet. This suggests that the brightening is related to a larger-scale phenomenon, perhaps associated with changes in external pressure. The occurrence of significant X-ray emission before the radio brightening complicates the simple picture.
There is also a clear variation in the ratio of X-ray to radio emission along the main jet at larger distances (Fig. 8). The ratio decreases by a factor at a projected distance of about 16 arcsec from the nucleus, consistent with the start of deceleration ( arcsec in the model of Canvin et al., 2005). X-ray emission is detected throughout the rapid deceleration zone (14 – 33 arcsec) but not beyond. 3C 31 shows a similar behaviour (Laing & Bridle, 2004), and a decline in X-rays is seen along the jet of 3C 66B (Hardcastle et al., 2001) although here no deceleration models have been constructed. Thus there appears to be a link between the speed of the jet flow and the X-ray/radio ratio, and consequently to the jet’s particle acceleration. Wherever X-ray emission is detected in 3C 31 and NGC 315, the variation of radio emissivity with distance from the nucleus is inconsistent with models in which the relativistic particles change energy only by adiabatic losses and the magnetic field is frozen into the flow (Laing & Bridle, 2004; Canvin et al., 2005). This provides independent evidence that dissipative effects are important, consistent with the requirement for particle acceleration.
The occurrence of X-ray emission throughout the jet volume implies that there must be distributed particle acceleration. The lifetime problem is particularly acute in the filament, where the X-ray emission is brightest: for knot E’s minimum-energy magnetic field of 4 nT, the lifetime for the X-ray-emitting electrons is 400 yr. This is comparable with the light-travel time across the knot, but far smaller than the equivalent for the entire X-ray emitting region (50,000 yr). As the flow in FRI jets is probably internally transonic (Bicknell, 1994; Laing & Bridle, 2002b), Fermi acceleration at strong shocks is not a plausible acceleration mechanism. It is more likely that strong shear associated with jet deceleration causes a small fraction of the kinetic energy of the jet to be fed, by turbulence in the shear layer, into the high-energy electrons responsible for the X-radiation (e.g., as in Stawarz & Ostrowski, 2002).
The synchrotron minimum-energy pressures of individual knots may slightly exceed the pressure of the external X-ray-emitting medium. For example, knot E’s internal minimum-energy pressure is Pa if the knot is moving with 0.9 at 38 degrees to the line of sight (higher if moving more slowly) as compared with the external pressure of Pa at its deprojected radius of 14 arcsec. A preliminary conservation-law analysis (work in preparation) finds that the diffuse radio emission at the start of rapid expansion in the jets is also overpressured, as found earlier for 3C 31 (Laing & Bridle, 2002b).
5.2 The nature of the filament
Complex, non-axisymmetric structure appears to be common in the jet-brightening (and geometrically flaring) regions of FRI jets observed with sufficiently high angular resolution. In addition to NGC 315, good examples are 3C 31, Cen A, B2 0326+39 and 3C 296 (Laing & Bridle, 2002a; Hardcastle et al., 2003; Canvin & Laing, 2004; Laing et al., 2006b). This non-axisymmetric radio emission is seen:
-
1.
downstream from where enhanced X-ray emission associated with the jet is detected, and thus where there is the first evidence of local particle acceleration, and
-
2.
before the region where significant jet deceleration begins, in sources where this has been modelled.
There is no evidence for variation in the average X-ray/radio ratio across the jet in NGC 315 (Fig. 9), although the constraints are poor close to the nucleus (because of inadequate resolution) and beyond arcsec where the X-ray emission is faint. Neither does the average X-ray/radio ratio differ grossly between the filament and the surrounding diffuse emission (Sec. 3.2.2), despite differences in fine-scale structure between the two wavelength bands. It therefore seems most likely that the filament is an emissivity enhancement within a region of distributed particle acceleration rather than a favoured location for particle acceleration.
The filament in NGC 315 differs both morphologically and in its polarization properties from features which have been identified as strong shocks, such as those producing bright X-rays in M 87 (Perlman et al., 1999) and 3C 15 (Dulwich et al., 2007). The latter tend to show apparent magnetic fields transverse to the jet axis, whereas the filament has a primarily longitudinal field. Although the non-axisymmetric structures observed in FRI sources other than NGC 315 are not well enough measured or resolved to separate their apparent field structures from those of the surrounding emission, as we have done for NGC 315, in several sources the composite polarization data are consistent with apparent fields aligned with the structures.
The radio filament lies wholly within the overall envelope of the diffuse jet emission, reaching about 60 per cent of the way from the axis to the edge in projection (Fig. 14a). It is possible that the filament appears to cross the jet axis only in projection, and that all of its emission comes from intermediate radii in the jet. If so, a promising explanation for the filament’s enhanced emissivity in both the X-ray and radio may be that it lies in a shear layer between faster inner jet plasma and slower outer flow. The development of such a shear layer as a jet propagates would occur at a rate that depends on the rate of mass entrainment through the boundary layer. The model transverse velocity-profiles fitted to this jet by Canvin et al. (2005) have a ratio of edge to on-axis velocity of in the region of interest. Given that the on-axis velocity is estimated to be , the best-fitting model implies a large velocity shear, although a top-hat profile is also consistent with the data. There is also evidence from much larger distances (fig. 7 of Canvin et al., 2005) where the jet is well resolved, that the truncated Gaussian functional form assumed for the transverse velocity profile may under-represent the maximum shear, and that much of the velocity gradient further down the jet in fact occurs about half way out from the jet axis. If a similar velocity profile applies closer to the nucleus, the maximum velocity shear could indeed occur roughly where we detect the radio and X-ray filament.
The filament could be a magnetic structure, sustained by the velocity shear, that becomes bright where it is exposed to the same relativistic electron distribution that causes the brightening of the diffuse radio emission in the jet. This is consistent with the filament representing a similar fraction of the jet emission in both the radio and X-ray (Sec. 3.2.2) and is also consistent with the strong longitudinal polarization seen in the filament (Sec. 3.1), but theoretical work is required to test its viability. A specific mechanism — field-amplification by the dynamo action of the turbulence in the shear layer — is described by Urpin (2006). In that case, the filament would be a basically longitudinal feature, distorted by motions within the shear layer. The seed field might then either be internal to the jet or a magnetic structure in the interstellar medium of NGC 315, entrained into the shear layer where the jet brightens.
5.3 The filament as a helical structure?
If the filament is a coherent, quasi-helical structure in three dimensions, rather than a superposition of random, non-axisymmetric knots which merely appears helical in projection, then we might constrain its properties further.
The jet envelope is relatively symmetric about the jet axis. Within this, the appearance of the filament suggests a series of knots in a helically-wound structure with roughly two periods of oscillation across the axis (from A to D, then from D to the region FGH; Fig. 14). The oscillation amplitude is a roughly constant fraction of the jet width. The filament can be traced as far as knot I, after which the structure becomes less ordered. It is tempting to interpret knot E as a cusp where the filament is close to the line of sight. The black curve in Fig. 14a shows the projection of a spiral curve whose radius is 0.6 of the jet width and whose phase has been adjusted to form such a cusp at knot E; the wavelength along the jet is 1.7 kpc, which projects to 3.1 arcsec on the plane of the sky.
A simple projection of this sort is only appropriate for a stationary pattern. The flow speed must be relativistic, in order to avoid seeing comparably bright structures in the counter-jets of this and other FRI sources with non-axisymmetric knot structures. If the pattern (as well as the flow) moves relativistically, then aberration will change its observed shape. To quantify this effect we calculated the locus traced by blobs of emission launched from a precessing injector placed 4 arcsec in projection from the nucleus along the jet axis and travelling ballistically as in models of SS 433 (Hjellming & Johnston, 1981). The black curve in Fig. 14b shows an example for a precession angle of 3.5 deg, a velocity of , and a period of 2500 yr. 777Light-travel-time effects cause the velocity projected on the plane of the sky to be for velocity along the jet axis. The curve is close to sinusoidal with no cusp. Although this is a toy model taking into account only the kinematics, the lack of a cusp is a robust result as the moving pattern is observed close to edge-on in its rest frame (). The curve does not match well the appearance of the filament, making it difficult to understand the filament as a coherent structure moving with the underlying relativistic flow. Interpreting the NGC 315 filament as a three-dimensional helix-like structure is therefore problematic despite its apparently oscillatory appearance.
The filament may have some similarities with the kpc-scale jet in M 87 (Owen et al., 1989), where Lobanov, Hardee & Eilek (2003) model alternations of bright features from side to side as the superposition of two filaments, with oscillation wavelengths kpc and amplitudes of order the width of the radio jet. A low contrast, two-stranded, filamentary structure has also been seen in the radio and optical in 3C 66B (Jackson et al., 1993), but no corresponding X-ray structure was found by Hardcastle et al. (2001).
Quasi-periodic oscillatory structures have been seen on parsec scales in other jets (e.g., Lobanov & Zensus 2001; Hardee, Walker & Gómez 2005), although it is unclear whether they are narrow compared with the jet width, as in the NGC 315 filament. One interpretation of these structures (e.g., Abraham & Romero 1999; Tateyama & Kingham 2004) has been that they result from the ballistic motions associated with precession of the injection direction when individual knots travel on straight-line trajectories, as in the simple model discussed above. In this case, the oscillation should be strictly periodic and affect the whole jet envelope, which is not the case in the kpc-scale jet of NGC 315. Alternatively, the oscillations have been interpreted as helical gas streaming motions, perhaps associated with small variations in the injection direction amplified by Kelvin-Helmholtz instabilities (e.g., Savolainen et al. 2006).
5.4 A jet instability?
5.4.1 Synchrotron thermal instability
The synchrotron thermal instability (Simon & Axford, 1967; Eilek & Caroff, 1979; de Gouveia Dal Pino & Opher, 1993) is a local instability occurring in a magnetized plasma with internal energy and inertia dominated by relativistic and cold components, respectively, and has been suggested as a possible cause of filamentation in radio sources. de Gouveia Dal Pino & Opher (1993) show, however, that a filament formed by this instability would appear darker than its surroundings in the X rays and brighter at lower (e.g. radio) frequencies. The brightness contrast in NGC 315 appears to be similar in the two wavebands, so the synchrotron thermal instability is an unlikely cause for the filament.
5.4.2 Kelvin-Helmholtz instabilities
Alternatively, we might seek to explain the filament in NGC 315 as a hydrodynamic, or magnetohydrodynamic instability if we assume that its brightness increases with the overpressure generated by the mode (e.g., Birkinshaw, 1984, 1991; Hardee, 2000). One possibility is that the instabilities are associated with the jet as a whole. Alternatively, the filament may lie within the shear layer between the fast central and slow outer parts of the jet (Sec. 5.2). For a sheared flow, Birkinshaw (1991) showed that typical unstable helical, or higher-order, Kelvin-Helmholtz modes have narrow pressure maxima within the shear layer. The thickness of the filament across the jet might then indicate the width of the shear layer.
While jet distortions are commonly interpreted as Kelvin-Helmholtz instabilities, such instabilities acting by themselves would not be expected to generate simple structures because multiple instability modes are always present together, with similar growth rates, so a complicated flow pattern would develop. If we regard the filament as a coherent, quasi-helical structure, then a pure mode or simple mix of modes is required. Fine tuning would then be needed, for example by injecting the correct mode by precession of the jet direction, and then amplifying it by the Kelvin-Helmholtz process, while suppressing many other fast instabilities (e.g., Birkinshaw, 2002). This problem is alleviated if the filament is a random superposition of non-axisymmetric knots rather than a coherent structure.
The filament appears to have the symmetry of an Kelvin-Helmholtz instability mode (where is the azimuthal mode number). A body (reflection) mode of this type would correspond to a bulk helical motion of the entire jet. Where the whole structure is affected, for example the VLBI jet of 3C 120, this interpretation is appropriate (Hardee et al., 2005), but in NGC 315 the outer envelope of the jet appears to be undisturbed. In contrast, a superposition of and surface modes was used to fit the double filament in M 87 (Lobanov et al., 2003). If the filament in NGC 315 is a helical structure, then it must lie well within the volume of the jet, and is unlikely to be generated by instabilities on the surface.
If the instability is instead restricted to a shear layer, the azimuthal extent of the filament must still be defined by the superposition of modes with similar saturated amplitudes. While this can be achieved by a suitable superposition of (say) and , or and , modes, it is hard to see how these modes are excited while other surface or body modes, which have higher growth rates, are suppressed.
5.5 An injection model?
We now consider the possibility that the filament is a structure formed by injection of magnetic field or particles into the shear layer, either (a) where the injector is stationary and the beam is rotating about its flow axis, so that the material of the filament is itself rotating about that axis, or (b) where the injector is rotating and the beam is non-rotating, so that the filament is being advected along the beam.
In the case of (a), the observation that the wavelength of the filament in projection is significantly larger than the half-width of the jet implies that the rotation velocity of the beam material at the edge of the jet must be comparable with the component along the axis, which we infer to be . Doppler beaming for such a fast rotation would cause a strong systematic variation in the brightness of both the filament and the surrounding diffuse emission to either side of the jet centre-line. This is not seen and we therefore infer that jet rotation, while expected in principle from any jet-launching mechanism associated with a rotating structure such as an accretion disc, is insufficient to shape the filament.
In the case of (b), the velocities of the individual knots in the filament are outwards along the jet without large rotational components. The appropriate period is yr, as derived for the simple ballistic model plotted in Fig. 14. If the filament is injected where the jet first brightens, the radius of 150 pc leads to an injection speed comparable with , which is not reasonable. If, instead, we assume injection close to the base of the jet, then the rotational velocities required are more reasonable. For a black hole mass of M⊙ (Sec. 4.1), matter in Keplerian motion around the black hole with a period of 2500 yr would be at a radius of pc, which is too large to be within the accretion disk. While gas and magnetic field from a rotating source, possibly a torus responsible for X-ray absorption and far-infrared emission (Sec. 4.1), might be stripped off into the edge of the jet near its base, this would require that a structure introduced in the jet on pc scales survives to the kpc scale of the filament, which is difficult to imagine.
6 Summary
Our Chandra observation of NGC 315 has resolved X-ray jet emission between 3.6 and 30 arcsec from the core, and also transverse to the jet axis. The X-ray spectrum fits a power law with , which is significantly softer than seen in the core, and the steepening from through to supports a synchrotron origin for the jet X-rays. In common with other nearby jets measured with high linear resolution, the X-ray emission turns on closer to the core than the position where the radio jet brightens significantly and flares.
The X-ray emission is well matched to the radio in spatial extent transverse to the jet axis. The synchrotron nature of the X-rays requires a mechanism for distributed electron acceleration to TeV energies. This mechanism becomes less effective about 14 arcsec from the core, where the kinematic model for the radio jet derived from deep radio imaging (Canvin et al 2005) shows that the jet is decelerating: in this region the ratio of X-ray to radio flux is lower by a factor of .
Between the positions of jet brightening and deceleration, a knotty filament contributes roughly 10 per cent of the emission at both radio and X-ray wavelengths. The filament has an oscillatory appearance, and our radio polarization data show that the magnetic field is roughly parallel to this filament for most of its length. The kinematic model for the jet further from the nucleus requires slower flow towards the edge of the jet than on the axis, so it is reasonable to assume that the flow is sheared also in the region of the filament, where such measurements are not possible from current data. We suggest that the filament is a magnetic strand within such a shear layer. Individual knots in the filament may be somewhat overpressured with respect to the external X-ray-emitting gas even if they are at minimum energy.
The geometry of the filament is uncertain. One possibility is that it is a quasi-helical structure wrapped around the jet axis, although it is difficult to model the observed shape well if the pattern is moving relativistically. Alternatively, its appearance as a coherent structure may be due to a chance superposition of non-axisymmetric knots or it could be a surface feature whose apparent location inside the jet volume results from projection.
None of the explanations we have considered for the enhanced emission from the filament is completely satisfactory:
-
1.
The synchrotron thermal instability causes rapid energy loss at high electron energies, such that the filament should not be X-ray bright.
-
2.
An explanation in terms of Kelvin-Helmholtz instability modes requires a selective superposition of low-order modes, while others with higher growth rates are suppressed.
-
3.
There is insufficient surface-brightness asymmetry for the emission to arise from material advected along a rotating beam.
-
4.
The origin of the seed magnetic structure is uncertain if the filament is a longitudinal feature on the face of the jet, amplified by the dynamo action of turbulence in the shear layer and distorted by motions.
-
5.
Injection of particles and/or field from a rotating source close to the brightening point of the jet requires an unreasonably high rotational velocity.
-
6.
Close to the base of the jet, the required rotation period for injected field or particles corresponds to a radius of about 1.4 pc for material rotating around a M⊙ black hole. The problem then is to understand how the field or particles might propagate from pc to kpc distances.
Better information on the brightness structure and polarization of the filament, such as might be obtained by higher-resolution, higher-sensitivity radio imaging, would test the idea that the filament represents a well-ordered magnetic structure. Radio spectral-index mapping of the filament would test for variations in the electron energy spectrum, such as might arise from distinct acceleration regions (knots) within the filament. Much deeper X-ray imaging would have a similar purpose, and would allow a more detailed structural comparison of the radio and X-ray emission of the filament. Finally, low-surface-brightness non-axisymmetric knottiness is seen in other FRI radio jets mapped at lower resolution or sensitivity than NGC 315, and higher-resolution and more sensitive data are required before we can comment further on the ubiquity or otherwise of coherent filaments.
The X-ray data for the core have improved understanding of its central structure. We have demonstrated that the X-ray data do not allow sufficient luminosity to be present (but absorbed) to be consistent with emission close to the Eddington luminosity, suggesting that the central engine is radiatively inefficient. The existence of a significant gas torus is not ruled out by the data since the X-ray emission detected from the core can be associated with non-thermal radiation from the small-scale jet rather than emission associated with the accretion structure.
The X-ray-emitting atmosphere around NGC 315 has been measured with the highest precision to date using the Chandra data reported here. Out to 40 arcsec (13.4 kpc), the atmosphere can be described by a model of core radius arcsec and ( uncertainties for two interesting parameters), but at larger radii the intensity drops more sharply. Significant temperature structure is measured, ranging from keV close to the radio core, keV between 4 and 20 arcsec from the core, and keV beyond 40 arcsec from the core. This is consistent with relatively fast cooling times (e.g., years at 15 arcsec from the core) that increase towards the core where the gas density is higher.
Acknowledgments
We thank the CXC for its support of Chandra observations, calibrations, data processing and analysis, the SAO R&D group for DS9 and funtools, Alexey Vikhlinin for a copy of his zhtools software that has been used for part of our analysis, and the referee, John Wardle, for helpful suggestions on improving the clarity and accessibility of the paper. We also thank Gijs Verdoes Kleijn for providing galaxy-subtracted HST images of NGC 315 and for helpful discussions. This work has used data from the VLA. NRAO is a facility of the National Science Foundation operated under cooperative agreement by Associated Universities, Inc.
References
- Abraham & Romero (1999) Abraham, Z., Romero, G.E., 1999, A&A, 344, 61
- Barth et al. (1999) Barth, A.J., Filippenko, A.V., Moran, E.C., 1999, ApJ, 525, 673
- Bettoni et al. (2003) Bettoni, D., Falomo, R., Fasano, G., Govoni, F., 2003, A&A, 399, 869
- Bicknell (1994) Bicknell, G.V., 1994, ApJ, 422, 542.
- Birkinshaw (1984) Birkinshaw, M., 1984, MNRAS, 208, 887
- Birkinshaw (1991) Birkinshaw, M., 1991, MNRAS, 252, 505
- Birkinshaw (2002) Birkinshaw, M., 2002, NewAR, 46, 417
- Birkinshaw & Worrall (1993) Birkinshaw, M., Worrall, D.M., 1993, ApJ, 412, 568
- Blandford & Begelman (1999) Blandford, R.D., Begelman, M.C., 1999, MNRAS, 303, L1
- Bridle et al. (1976) Bridle, A. H., Davis, M. M., Meloy, D. A., Fomalont, E. B., Strom, R. G., Willis, A. G., 1976, Nature, 262, 179
- Burstein & Heiles (1978) Burstein, D., Heiles, C., 1978, ApJ, 225, 40
- Butcher et al. (1980) Butcher, H.R., van Breugel, W., Miley, G.K., 1980, ApJ, 235, 749
- Canvin & Laing (2004) Canvin J.R., Laing R.A., 2004, MNRAS, 350, 1342
- Canvin et al. (2005) Canvin, J.R., Laing, R.A., Bridle, A.H., Cotton, W.D., 2005, MNRAS, 363. 1223
- Cavaliere, A. & Fusco-Femiano (1978) Cavaliere, A., Fusco-Femiano, R., 1978, A&A, 70, 677
- Cotton et al. (1999) Cotton, W. D., Feretti, L., Giovannini, G., Lara, L., Venturi, T., 1999, ApJ, 519, 108
- Croston et al. (2005) Croston, J.H., Hardcastle, M.J., Harris, D.E., Belsole, E., Birkinshaw, M., Worrall, D.M., 2005, ApJ, 626, 733
- de Gouveia Dal Pino & Opher (1993) de Gouveia Dal Pino, E.M., Opher, R., 1993, MNRAS, 263, 687
- de Ruiter et al. (2002) de Ruiter, H.R., Parma, P., Capetti, A., Fanti, R., Morganti, R., 2002, A&A, 396, 857
- Dickey & Lockman (1990) Dickey, J.M., Lockman, F.J., 1990, ARA&A, 28, 215
- Donato et al (2004) Donato, D., Sambruna, R.M., Gliozzi, M., 2004, ApJ, 617, 915
- Dulwich et al. (2007) Dulwich, F., Worrall, D.M., Birkinshaw, M., Padgett, C.A., Perlman, E.S., 2007, MNRAS, 374, 1216
- Eilek & Caroff (1979) Eilek, J.A., Caroff, L.J., 1979, ApJ, 233, 463
- Evans et al. (2006) Evans, D.A., Worrall, D.M., Hardcastle, M.J., Kraft, R.P., Birkinshaw, M., 2006, ApJ, 642, 96
- Fabbiano et al. (1992) Fabbiano, G., Kim, D.W., Trinchieri, G., 1992, ApJS, 80, 531
- Fanaroff & Riley (1974) Fanaroff, B.L., Riley, J.M., 1974, MNRAS, 167, 31p
- Fanti et al. (1976) Fanti, R., Lari, C., Spencer, R.E., Warwick, R. S., 1976, MNRAS, 174, 5P
- Hardcastle et al. (2001) Hardcastle, M.J., Birkinshaw, M., Worrall, D.M., 2001, MNRAS, 326, 1499
- Hardcastle et al. (2002) Hardcastle, M.J., Worrall, D.M., Birkinshaw, M., Laing, R.A., Bridle, A.H., 2002, MNRAS, 334, 182
- Hardcastle et al. (2003) Hardcastle, M.J., Worrall, D.M., Kraft, R.P., Forman, W.R., Jones, C., Murray, S.S., 2003, ApJ, 593, 169
- Hardee (2000) Hardee, P.E., 2000, ApJ, 533, 176
- Hardee et al. (2005) Hardee, P.E., Walker, R.C., Gómez, J.L., 2005, ApJ, 620, 646
- Hjellming & Johnston (1981) Hjellming, R.M., Johnston, K.J., 1981, ApJ, 246, L141
- Ho et al. (1997) Ho, L.C., Filippenko, A.V., Sargent, W.L.W., Peng, C.Y., 1997, ApJS, 112, 391
- Jackson et al. (1993) Jackson, N., Sparks, W.B., Miley, G.K., Macchetto, F., 1993, A&A, 269, 128
- Jägers (1987) Jägers, W. J., 1987, A&AS, 71, 75
- Kataoka et al. (2003) Kataoka, J., Leahy, J.P., Edwards, P.G., Kino, M., Takahara, F., Serino, Y., Kawai, N., Martel, A.R., 2003, A&A, 410, 833
- Laing & Bridle (2002a) Laing, R.A., Bridle, A.H., 2002a, MNRAS, 336, 328
- Laing & Bridle (2002b) Laing, R.A., Bridle, A.H., 2002b, MNRAS, 336, 1161
- Laing & Bridle (2004) Laing, R.A., Bridle, A.H., 2004, MNRAS, 348, 1459
- Laing et al. (2006a) Laing, R.A., Canvin, J.R., Cotton, W.D., Bridle, A.H., 2006a, MNRAS, 368, 48
- Laing et al. (2006b) Laing, R.A., Canvin, J.R., Bridle, A.H., Hardcastle, M.J., 2006b, MNRAS, 372, 510
- Lazio et al (2001) Lazio, T.J.W., Waltman, E.B., Ghigo, F.D., Fiedler, R.L., Foster, R.S., Johnston, K.J., 2001, ApJS, 136, 265
- Leon et al. (2003) Leon, S., Lim, J., Combes, F., Trung, D., 2003, in “Active Galactic Nuclei: from central engine to host galaxy” (ASP Conference Series Volume 290), eds. D. Collin, F. Combes, I. Shlosman, 525
- Lobanov & Zensus (2001) Lobanov, A.P., Zensus, J.A., 2001, Science, 294, 128
- Lobanov et al. (2003) Lobanov, A., Hardee, P., Eilek, J., 2003, NewAR 47, 629
- Marchesini et al. (2004) Marchesini, D., Celotti, A., Ferrarese, L., 2004, MNRAS, 351, 733
- Narayan & Yi (1994) Narayan, R., Yi, I, 1994, ApJ, 428, L13
- Owen et al. (1989) Owen, F.N., Hardee, P.E., Cornwell, T.J., 1989, ApJ, 340, 698
- Perlman et al. (1999) Perlman, E.S., Biretta, J.A., Zhou, F., Sparks, W.B., Macchetto, F.D., 1999, AJ, 117, 2185
- Sarazin (1986) Sarazin, C.L., 1986, Rev. Mod. Phys., 58, 1
- Savolainen et al. (2006) Savolainen, T., Wilk, K., Valtaoja, E., Kadler, M., Ros, E., Tornikoski, M., Aller, M.F., Aller, H.D., 2006, ApJ, 647, 172
- Simon & Axford (1967) Simon, M., Axford, W.I., 1967, ApJ, 150, 105
- Stawarz & Ostrowski (2002) Stawarz, L., Ostrowski, M., 2002, ApJ, 578, 763
- Tateyama & Kingham (2004) Tateyama, C.E., Kingham, K.A., 2004, ApJ, 608, 149
- Trager et al. (2000) Trager, S.C., Faber, S.M., Worthy, G., González, J.J., 2000, AJ, 119, 1645
- Urpin (2006) Urpin, V., 2006, A&A, 455, 779
- Verdoes Kleijn et al. (1999) Verdoes Kleijn, G.A., Baum, S.A., de Zeeuw, P.T., O’Dea, C.P., 1999, ApJ, 118, 2592
- Wardle & Kronberg (1974) Wardle, J.F.C., Kronberg, P.P., 1974, ApJ, 194, 249
- Wilkes et al. (1994) Wilkes, B.J., Tananbaum, H., Worrall, D.M., Avni, Y., Oey, M.S., Flanagan, J. 1994, ApJS, 92, 53
- Willis et al. (1981) Willis, A. G., Strom, R. G., Bridle, A. H., Fomalont, E. B., 1981, A&A, 95, 250
- Worrall & Birkinshaw (1994) Worrall, D.M., Birkinshaw, M., 1994, ApJ, 427, 134
- Worrall & Birkinshaw (2000) Worrall, D.M., Birkinshaw, M., 2000, ApJ, 530, 719
- Worrall & Birkinshaw (2005) Worrall, D.M., Birkinshaw, M., 2005, MNRAS, 360, 926
- Worrall & Birkinshaw (2006) Worrall, D.M., Birkinshaw, M., 2006, Lect. Notes Phys., 693, 39
- Worrall, Birkinshaw & Cameron (1995) Worrall, D.M., Birkinshaw, M., Cameron, R.A., 1995, ApJ, 449, 93
- Worrall et al. (2003) Worrall, D.M., Birkinshaw, M., Hardcastle, M.J., 2003, MNRAS, 343, L73