New flaring of an ultraluminous X-ray source in NGC 1365
Abstract
We have studied a highly variable ultraluminous X-ray source (ULX) in the Fornax galaxy NGC 1365, with a series of 12 Chandra and XMM-Newton observations between 2002 and 2006. In 2006 April, the source peaked at a luminosity erg s-1 in the – keV band (similar to the maximum luminosity found by ASCA in 1995), and declined on an -folding timescale days. The X-ray spectrum is always dominated by a broad power-law-like component. When the source is seen at X-ray luminosities erg s-1, an additional soft thermal component (which we interpret as emission from the accretion disk) contributes of the X-ray flux; when the luminosity is higher, erg s-1, the thermal component is not detected and must contribute of the flux. At the beginning of the decline, ionized absorption is detected around – keV; it is a possible signature of a massive outflow. The power-law is always hard, with a photon index (and even flatter at times), as is generally the case with bright ULXs. We speculate that this source and perhaps most other bright ULXs are in a high/hard state: as the accretion rate increases well above the Eddington limit, more and more power is extracted from the inner region of the inflow through non-radiative channels, and is used to power a Comptonizing corona, jet or wind. The observed thermal component comes from the standard outer disk; the transition radius between outer standard disk and Comptonizing inner region moves further out and to lower disk temperatures as the accretion rate increases. This produces the observed appearance of a large, cool disk. Based on X-ray luminosity and spectral arguments, we suggest that this accreting black hole has a likely mass – (even without accounting for possible beaming).
keywords:
X-rays: binaries — X-rays: individual (NGC 1365 X1) — black hole physics — accretion, accretion disks1 Introduction: ULX variability
It is still not clear how ultraluminous X-ray sources (ULXs) relate to the class of stellar-mass black holes (BHs) first identified and extensively studied in the Galaxy and Large Magellanic Cloud; in particular, whether and how they differ from high-mass X-ray binaries (systems where the donor is an OB star). They could represent the upper end of the BH mass distribution, perhaps up to . Alternatively, the emission could be mildly beamed in our direction, enhancing the apparent luminosity perhaps by a factor of a few. Finally, the emission could be super-Eddington by a factor of a few. One of the reasons the ULX classification remains controversial is that very little is known about their spectral state transitions. The identification and interpretation of state transitions over characteristic timescales of a few months/years has provided a powerful tool to understand the accretion processes (for example the disk/corona/jet interplay as a function of a variable mass accretion rate) in Galactic BHs over the last two decades (Remillard & McClintock 2006).
Because of their distance, ULXs are too faint to be regularly observed by the current generation of X-ray all-sky monitors, and require targeted observations. Few ULXs have been observed regularly enough to determine their long-term X-ray behaviour; most of them may vary by a factor of a few (compare for example the catalogues of Swartz et al. 2004 and Liu & Bregman 2005) but tend to be persistently in a bright state. From this point of view, they are more similar to the (few) Galactic BHs in high-mass binary systems (i.e., accreting from an OB donor star) than to the more numerous ones in low-mass systems (accreting from a low-mass star). Significant variability or on/off transitions have been monitored in some of the fainter ULXs ( a few erg s-1), for example in the Antennae (Fabbiano et al. 2003). However, spectral state transition or flux variations by more than one order of magnitude are rarer among the brightest systems ( erg s-1). Among the few notable exceptions (apart from NGC 1365 X1, object of this paper) are the two brightest ULXs in M 82 (Kaaret, Simet & Lang 2006), the brightest ULX in the Cartwheel (Wolter, Trinchieri & Colpi 2006), a source in NGC 3628 (Strickland et al. 2001), and a peculiar super-soft source that underwent an outburst in M 101 (Kong & Di Stefano 2005). The last source may or (more likely) may not belong to the same physical class as most other ULXs.
In the few ULXs where the flux and/or spectral variations are significant enough to be considered a state transition, the pattern does not appear to correspond to the “canonical” sequence of physical states displayed by stellar-mass BHs: quiescence; low/hard state (hard power-law); thermal-dominant state (disk-blackbody with keV); very high state state (softer power-law plus disk-blackbody component) (Remillard & McClintock 2006; Fender, Belloni & Gallo 2004). Instead, ULX spectra in the – keV band seem to show three phenomenological features (Stobbart, Roberts & Wilms 2006), which may or may not correspond to truly different physical components: a) a broad, power-law-like component with photon index –; b) a curvature or break above keV; c) an additional soft component (– keV). Strong flux changes generally correspond to one or two of those features becoming more prominent or disappearing. For example, at higher luminosities, the power-law component appears to increase more than the soft thermal component; the high-energy steepening is also more noticeable at higher luminosities (e.g., Roberts 2007; Dewangan et al. 2004; Kubota et al. 2001). It is difficult to classify this behaviour in terms of state transitions, because there is still no consensus on the physical origin of those three basic features. In the standard scenario, the soft component is emitted by a cool disk, the power-law component is the result of Comptonization, and its curvature/break is due to an increased optical depth of the Comptonizing region. Alternatively, it was suggested that the curved emission component may come from a hot accretion disk (e.g., Kubota et al. 2001; Roberts et al. 2005; Stobbart et al. 2006; Tsunoda et al. 2006).
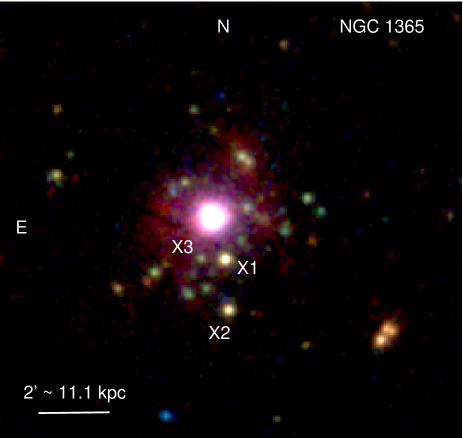
For our study, we have targeted the brightest ULX in NGC 1365 (henceforth, X1, following the ROSAT identification; Komossa & Schulz 1998) which was already known to be highly variable (a factor ) over a few months’ timescale, from ROSAT and ASCA studies (Komossa & Schulz 1998; Iyomoto et al. 1997). The source is located in the most luminous spiral galaxy of the Fornax Cluster, a supergiant barred spiral (type SBb(s)I: Sandage & Tammann 1981) with a total gas mass , a kinematic mass , and a star formation rate yr-1 (Roussel et al. 2001; Lindblad 1999). The Cepheid distance to NGC 1365 is Mpc (Ferrarese et al. 2000); at that distance, pc. In this paper, we will show that this source varies dramatically in luminosity over short timescales, and that such changes are associated to spectral changes, including the signature of an ionized outflow. We will then discuss whether and how those changes may be consistent with a standard disk plus corona scenario, and what constraints we can obtain on the BH mass and accretion rate.
2 Summary of our observations
We observed the central region of NGC 1365 with Chandra on 2002 December 24, then with XMM-Newton on five occasions between 2003 January 16 and 2004 July 24, and with Chandra again six times between 2006 April 10 and 2006 April 23 (see Table 1 for details). Henceforth, for simplicity, we label our XMM-Newton/EPIC and Chandra/ACIS observations as E1–E5, and A1–A6, respectively, in chronological order. The main target was the active nucleus: findings for that study are reported elsewhere (Risaliti et al. 2005a,b; Risaliti 2007; Risaliti et al. 2007 in preparation).
2.1 XMM-Newton observations
For all the XMM-Newton observations, the European Photon Imaging Camera (EPIC) was in full-window mode, with the medium filter, both for the pn and the two Metal Oxide Semi-conductor (MOS) detectors. We used the Science Analysis System (SAS) version 5.4.3 (release date 2003-09-11) for the EPIC spectral extraction and analysis, but we also checked that the results were unchanged when using the more recent SAS version 7.0.0 (2006-06-28). We selected only unflagged events (#XMMEA_EP for the pn and #XMMEA_EM for the two MOSs), with pattern 12 for the MOSs, pattern 4 for the pn. We defined good-time-interval files, removing intervals of high background. We extracted spectra and lightcurves for X1 using the SAS task xmmselect: the source extraction region was a circle of radius , which includes of the energy in the pn and in the MOSs. The background was extracted from a circular region of radius , located at the same angular distance from the nucleus of the galaxy. We built response and auxiliary response files with the SAS tasks rmfgen and arfgen respectively. For each EPIC observation, we then coadded the pn and MOS spectra, with the method described in Page, Davis & Salvi (2003), in order to increase the signal-to-noise ratio. Finally, we fitted the background-subtracted spectra with standard models in XSPEC version 11.3.1 (Arnaud 1996). For the X-ray timing analysis, we used the SAS version 7.0.0. We used lccorr to correct the background-subtracted lightcurves for gaps in the good-time-interval. We then used standard XRONOS tasks for studying the lightcurves.
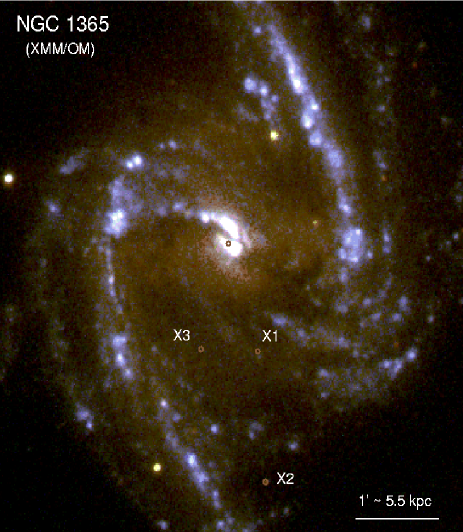
In addition, Optical Monitor (OM) images were taken in the , , and filters111See http://www.xmm.ac.uk/onlines/uhb/XMM_UHB/node66.html for a plot of the OM filter throughput curves., during most of the observations (Table 1). We registered the astrometry of each OM image to a sample of bright stars in the USNO-B1.0 Catalog (Monet et al. 2003), so that the positional error is for each image, comparable to the uncertainty in the Chandra astrometry. We used standard IRAF tasks to combine images in the same filter, from different observations. (In fact, the exposures in the filters proved to be too short to provide useful information).
2.2 Chandra observations
Chandra observations were performed with the back-illuminated CCD of the Advanced Camera for Imaging and Spectroscopy (ACIS-S, Weisskopf et al. 2002). The first observation was taken with the full frame; the others in the standard 1/4 subarray mode. The subarray mode enables a faster frame time (0.8 s instead of 3.2 s for full frame observations), thus reducing the pile up fraction. This is never a relevant issue for the analysis of the ULX; it was selected to prevent high pile up fractions in the main target, the active nucleus.
All Chandra datasets were analyzed with the Chandra Interactive Analysis of Observations (CIAO) software, version 3.3. For each observation, the source spectrum was extracted from a circular region of radius centred on the ULX position. The background spectrum was extracted from circular regions near the ULX. The response and ancillary response functions were created using standard CIAO tasks. with the latest calibration files available. The background-subtracted spectra were later re-binned to a signal-to-noise ratio and fitted with standard models in XSPEC version 11.3.1 (Arnaud 1996).
3 Results of our X-ray study of X1
We found three ULXs within a projected distance kpc from the active nucleus (Figures 1, 2, 3). We unofficially designate them, for simplicity, X1, X2 and X3, in order of average X-ray brightness over the whole series of our observations. X1 is the ULX previously found by ROSAT and ASCA. A more accurate source position for X1, from the Chandra image, is RA = , Dec . All three ULXs (but most remarkably, X1 and X3) vary significantly between different observations. In this paper, we discuss the main properties of X1, and leave a study of the other ULXs and non-nuclear X-ray sources in NGC 1365 to a follow-up paper.
3.1 Long- and short-term variability
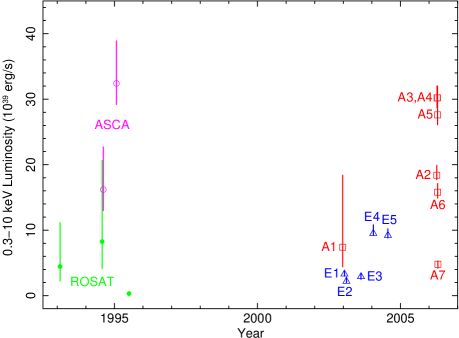
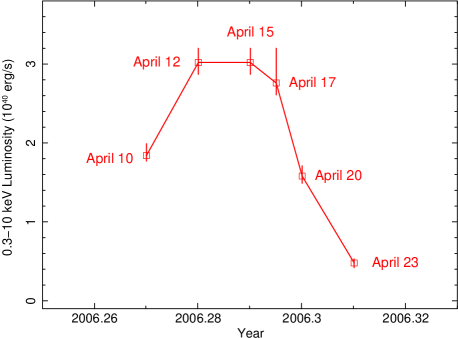
The long-term variability of X1 was already known from ASCA and ROSAT observations (Figure 4). As a first step, we fitted all the Chandra and XMM-Newton spectra with absorbed power-law models (Table 2), confirming that its X-ray luminosity fluctuated by a factor of 10 over the few years of our observations. Our sequence of six Chandra observations between 2006 April 10–23 caught the rise, peak and decline of an outburst, in which the source reached unabsorbed X-ray luminosities of erg s-1 in the – keV band. This luminosity is similar to the peak observed by ASCA in 1995 January, which we have re-estimated from the original ASCA/SIS data as erg s-1 in the same band222There are inconsistencies between the ASCA count rates, fluxes and luminosities listed for X1 in different sections of Iyomoto et al. 1997. From the reported SIS count rate and fitted spectral parameters, we suggest that the unabsorbed luminosity must have been erg s-1 in the – keV band, less than half of what is reported in Section 2.2.1 of that paper. As a further check, we have re-extracted and re-analysed the ASCA data, confirming the lower value for the unabsorbed luminosity.. It was considered remarkable at that time that the source must have risen and declined by more that an order of magnitude in less than a few weeks. In fact, the 2006 outburst shows that the characteristic timescale for the rise and decline is only a few days (Tables 1, 2). The peak of the outburst lasted for about a week, corresponding to the observations A3, A4 and A5 (2006 April 12–17).
Such long-term changes in the X-ray luminosity do not seem to correspond to significant variations in the slope of the continuum. When the spectra are fitted with an absorbed power-law model, the photon index remains – over all our XMM-Newton and Chandra observations, consistent the value that was estimated from the ASCA data during the 2005 January outburst (Iyomoto et al. 1997). Such slopes are similar to what is often found in other bright ULXs, but are flatter than the power-law slope in most Galactic BHs when they are in a high or very high state (Remillard & McClintock 2006). In fact, a more detailed spectral analysis based on two-component models (power-law plus disk-blackbody) reveals that the true slope of the power-law is in some cases even flatter, with a photon index (Section 3.2).
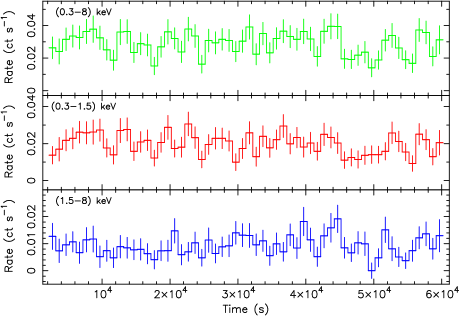
Only two of our observations (E4 and E5) are long enough to enable an analyis of short-term variability. We find that the count rate during E5 is consistent with being constant, while some flickering (quite common in accreting sources) is marginally detected in E4 (Kolmogorov-Smirnoff probability of constancy ). The total, soft-band and hard-band lightcurves for the EPIC-pn observation E4 are shown in Figure 4. We do not find any evidence of X-ray hardness changes during that observation, nor any significant features in its power density spectrum.
| Label | Date | MJD (start) | Mission | Obs ID | Good time interval (ks) | Optical Monitor |
|---|---|---|---|---|---|---|
| A1 | 2002 Dec 24 | 52632.62 | Chandra ACIS-S | 3554 | 13.8 | |
| E1 | 2003 Jan 16 | 52655.98 | XMM-Newton EPIC | 0151370101 | 19.0 (MOS), 15.3 (pn) | (3.5 ks) |
| E2 | 2003 Feb 09 | 52679.86 | XMM-Newton EPIC | 0151370201 | 4.4 (MOS), 2.5 (pn) | |
| E3 | 2003 Aug 13 | 52864.01 | XMM-Newton EPIC | 0151370701 | 8.0 (MOS), 6.4 (pn) | (1.9 ks) |
| E4 | 2004 Jan 17 | 53021.13 | XMM-Newton EPIC | 0205590301 | 57.1 (MOS), 49.7 (pn) | (3.4 ks), (3.4 ks), |
| (3.4 ks) | ||||||
| E5 | 2004 Jul 24 | 53210.27 | XMM-Newton EPIC | 0205590401 | 64.3 (MOS), 55.6 (pn) | (3.8 ks), (3.8 ks), |
| (4.5 ks) | ||||||
| A2 | 2006 Apr 10 | 53835.29 | Chandra ACIS-S | 6871 | 13.4 | |
| A3 | 2006 Apr 12 | 53837.52 | Chandra ACIS-S | 6872 | 14.6 | |
| A4 | 2006 Apr 15 | 53839.98 | Chandra ACIS-S | 6873 | 14.6 | |
| A5 | 2006 Apr 17 | 53842.79 | Chandra ACIS-S | 6868 | 14.6 | |
| A6 | 2006 Apr 20 | 53845.42 | Chandra ACIS-S | 6869 | 15.5 | |
| A7 | 2006 Apr 23 | 53848.42 | Chandra ACIS-S | 6870 | 14.6 |
| Label | Count rate | Power-law fit parameters | ||||
|---|---|---|---|---|---|---|
| ACIS-S cts s-1 | EPIC cts s-1 | ( cm-2) | Photon index | ( erg s-1) | ||
| A1 | ||||||
| E1 | ||||||
| E2 | ||||||
| E3 | ||||||
| E4 | ||||||
| E5 | ||||||
| A2 | ||||||
| A3 | ||||||
| A4 | ||||||
| A5 | ||||||
| A6 | ||||||
| A7 | ||||||

| Observation | Parameter | Spectral model | More complex models | ||
|---|---|---|---|---|---|
| diskbb | power-law | power-law + diskbb | |||
| A1 | 1.06 (20.1/19) | 0.80 (15.3/19) | 0.66 (11.3/17) | See Table 4 | |
| 4.3 | 7.4 | 18.0 | |||
| E1 | 1.71 (37.7/22) | 0.92 (20.1/22) | no improv | ||
| 2.2 | 3.3 | – | |||
| E2 | 2.22 (6.7/3) | 2.17 (6.5/3) | no improv | ||
| 1.7 | 2.2 | – | |||
| E3 | 1.14 (13.6/12) | 0.64 (7.71/12) | no improv | ||
| 1.7 | 2.9 | – | |||
| E4 | no fit | 1.15 (158.2/138) | 0.95 (129.1/136) | See Table 5 | |
| no fit | 8.5 | 10.5 | |||
| E5 | no fit | 1.33 (155.9/117) | 1.02 (117.7/115) | See Table 6 | |
| no fit | 8.3 | 9.2 | |||
| A2 | 1.15 (39.4/34) | 0.99 (33.7/34) | no improv | ||
| 11.7 | 18.4 | – | |||
| A3 | 0.82 (39.5/48) | 0.64 (30.6/48) | no improv | See Table 7 | |
| 18.9 | 29.6 | – | |||
| A4 | 0.80 (39.1/49) | 0.81 (39.5/49) | no improv | See Table 7 | |
| 20.1 | 29.3 | – | |||
| A5 | 0.71 (31.2/44) | 0.75 (32.9/44) | no improv | See Table 7 | |
| 17.4 | 24.8 | – | |||
| A6 | 0.50 (15.5/31) | 0.38 (11.7/31) | no improv | ||
| 10.6 | 15.8 | – | |||
| A7 | 1.28 (14.1/11) | 0.90 (9.88/11) | no improv | ||
| 2.8 | 4.8 | – | |||
| Parameter | Value |
|---|---|
| (keV) | |
| Parameter | Model 1 value | Model 2 value |
|---|---|---|
| (keV) | ||
| – | ||
| – | ||
| Parameter | Value |
|---|---|
| (keV) | |


3.2 Thermal and non-thermal spectral components
In all the observations with a sufficient number of counts, the X-ray spectrum appears dominated by a broad power-law-like component. In particular, the wider spectral coverage of XMM-Newton clearly rules out the possibility that the source is in a thermal dominant state, when most of the emission comes from a standard multicolour disk. Most ULXs (especially those with X-ray luminosities erg s-1) seem to share this phenomenological property, indicating perhaps that most of the disk photons are Compton-upscattered.
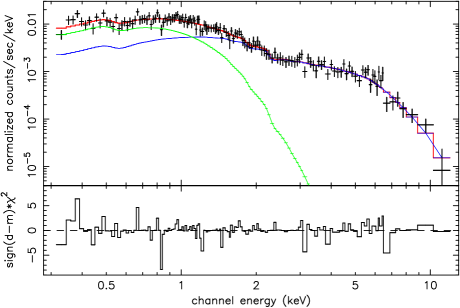
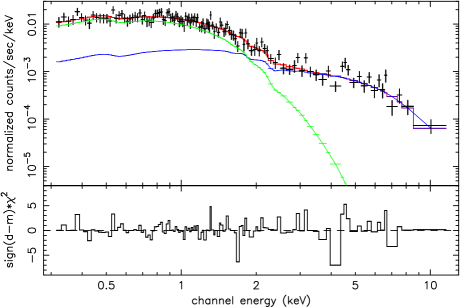
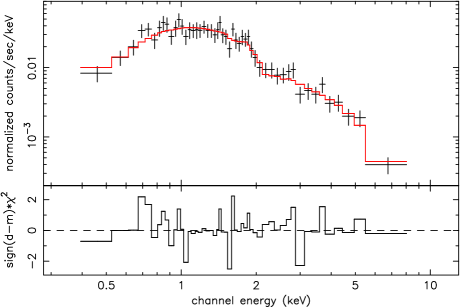
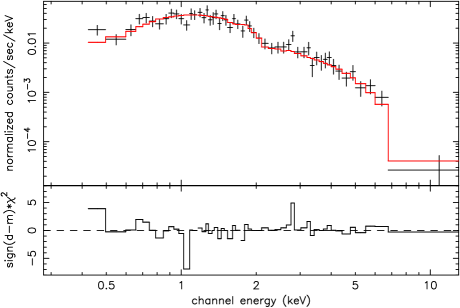
The two longest XMM-Newton observations (E4 and E5) have a sufficiently high signal-to-noise ratio, allowing a more detailed spectral analysis. Firstly, in both datasets, significant systematic residuals at low energies are found when the source spectra are fitted with a simple power-law model: an additional soft component is required333Simple power-law fits yield and for E4 and E5 respectively (Table 3), as opposed to and for disk-blackbody plus power-law fits. To verify that this is a statistically significant improvement, we have simulated pure power-law spectra using fakeit in XSPEC, and fitted them both with power-law and disk-blackbody plus power-law models; we have then compared the decrease in with what we obtain from the real datasets. This method is essentially equivalent to an F-test (Protassov et al. 2002).. The soft excess contributes of the emitted luminosity444Throughout this paper, for simplicity, luminosities are defined as times the respective fluxes, assuming isotropic emission for both the power-law and the disk-blackbody components. More rigorously, disk-blackbody luminosities should be calculated as times the flux, where is the (unknown) viewing angle to the disk. The difference between the two estimates is less than a factor of 2 for . in the – keV band, but dominates below keV (Figure 6 and Tables 5, 6). This emission is well fitted by a standard disk-blackbody model, with colour temperatures – keV. Such temperatures are intermediate between those generally found in “typical” ULXs (Miller, Fabian & Miller 2004; Stobbart et al. 2006) and those observed from the disks of Galactic stellar-mass BHs (e.g., Remillard & McClintock 2006). A possible soft excess is marginally found also for the Chandra observation A1 (Table 4), but there are not enough counts to significantly constrain its flux and temperature.
Secondly, we find that in E4 there is a significant steepening of the continuum slope above keV (Figure 6). Similar breaks are also found in various other bright ULXs: they have been interpreted as the effect of Comptonization in a warm ( keV), moderately optically-thick (–) corona (Stobbart et al. 2006; Goad et al. 2006; Dewangan, Griffiths & Rao 2006). The alternative interpretation for the spectral steepening is that the harder emission above keV is in fact from a hot ( keV) accretion disk, so that the steeper continuum above keV would represent the Wien part of the thermal disk component, somewhat modified (broadened) by Comptonization. Physically, this may be consistent with a “slim disk” model, also sometimes used to explain some ULX spectra (e.g., Ebisawa et al. 2003; Mizuno et al. 2007). Although such model provides an equally good fit for the E4 spectrum, it is not acceptable for E5 nor for the brightest Chandra spectra; therefore we do not consider it as a viable physical scenario for this particular source.
Thirdly, we find that the true value of the power-law photon index may be lower (harder spectrum) when the thermal component is also taken into account. Simple power-law fits to the E4 and E5 spectra give – (Table 2). But when the same E4 spectrum is fitted with a broken power-law plus disk-blackbody, the photon index is below the break, steepening to at higher energies (Table 5). For E5, the photon index is (Table 6), at least up to energies keV; we cannot determine where the expected spectral break occurred on that occasion. We tried to find evidence of high-energy spectral breaks also in our series of Chandra spectra. However, the ACIS sensitivity drops rapidly above keV, making this task impossible for such short observations.
3.3 The 2006 outburst sequence
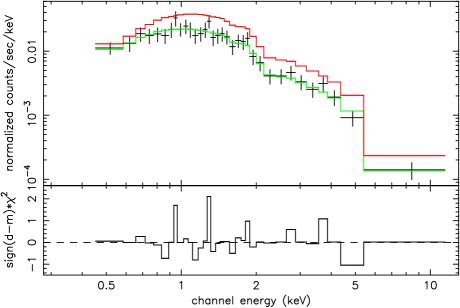
The most important result from the sequence of Chandra observations in 2006 April is that we caught the rise, peak and decline of an outburst, in which the source reached unabsorbed X-ray luminosities erg s-1, similar to the values observed by ASCA in the 1995 January outburst. It was considered remarkable at that time that the source must have risen and declined by more that an order of magnitude in less than a few weeks. In fact, the 2006 outburst shows that the characteristic timescale for the rise and decline is only a few days (Figure 4 and Tables 1, 2). The full sequence of spectra, fitted with absorbed power-law models, is shown in Figures 7–10.
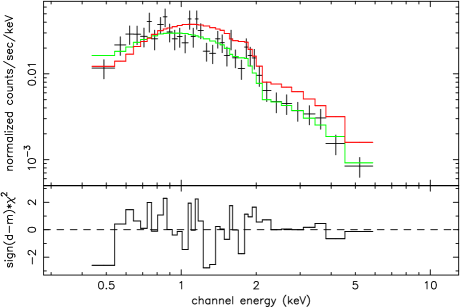
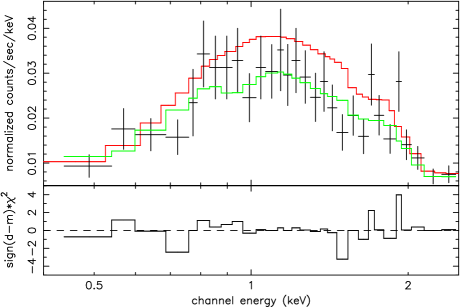
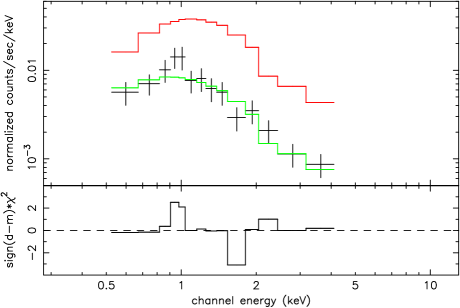
The outburst peaked between observations A3 (2006 April 12) and A4 (2006 April 15). The best-fitting models are consistent with being the same for both spectra, within the errors: a simple power-law component ( for A3, for A4) with neutral absorption, and essentially identical flux. In fact, the A5 spectrum is also essentially identical to A3 and A4 below keV and above keV. The difference, however, is that the A5 spectrum has a statistically significant “soft deficit” at energies – keV (Figures 8, 9), that cannot be modelled with additional cold absorption or with any kind of thermal emission. This feature suggests the presence of additional ionized absorption in the A5 spectrum.
To test this hypothesis, we fitted those three outburst spectra simultaneously, assuming the same primary spectrum (same power-law slope and normalization) and the same amount of neutral absorption, leaving only the amount of ionized absorption (absori model in XSPEC) free to vary between them. As expected, the ionized column densities in A3 and A4 is consistent with ; we then fixed both of them at to obtain a better constraint on the error range for the other parameters; we also fixed the metal abundance to the solar value. The ionized column density of the A5 spectrum is cm-2, with a corresponding ionization parameter , or –, if we adopt the definition of ionization parameter used for example by Murray et al. (1995). We also note that the neutral absorbing column density around the peak of the outburst (A3, A4, A5) appears to be higher (– cm-2) than the value found at other epochs, when it is typically cm-2.
The A6 spectrum, taken three days after A5, already shows the beginning of the decline, with a reduction of the emitted luminosity by a factor (Figure 10, top panel). The spectrum is well fitted with a simple power law absorbed by neutral gas. After three more days (observation A7: Figure 10, bottom panel) the luminosity had declined by another factor of . In summary, the X-ray luminosity has an -folding timescale days in the decline.
We could compare this timescale with typical decline timescales observed at the end of Galactic stellar-mass BH outbursts. For example, the -folding timescale for XTE J1550564 at the end of the 1998 outburst was 11 days (Wu et al. 2002); and it was weeks for GRO J165540 at the end of the 1996–1997 outburst (Sobczak et al. 1999). Those decline timescales very likely correspond to the viscous timescale on which the disk is emptied after the mass inflow rate from the donor star is strongly reduced; they depend on the size of the Roche lobe and on the effective viscosity. As the disk is emptied, a spectral state transition occurs from the high/soft to the low/hard state. However, the situation for NGC 1365 X1 is entirely different. In our interpretation, the X-ray spectrum is power-law dominated during the outburst; this is consistent with the suggestion that ULXs are in a state similar to the very high state of stellar-mass BHs (Roberts et al. 2006). Hence, we argue that the flare observed in the Chandra observations is probably comparable to the hard flares seen in the very high state (often at the very beginning of an outburst) of stellar-mass BHs (for example, XTE J1550564: Sobczak et al. 2000; GRO J165540: Sobczak et al. 1999; XTE J1859226: Brocksopp et al. 2002; 4U 163047: Trudolyubov, Borozdin & Priedhorsky 2001). Typical amplitudes of those X-ray flares are a factor of –; typical decline timescales are – days. Physically, such flares may correspond to the formation and ejection of a Comptonizing region in the inner part of the accretion flow. This is consistent with the decline being associated with an outflow.
Finally, we checked whether there is any evidence of a soft excess in the 2006 outburst spectra, that can be attributed to disk emission. None of the individual spectra are improved by adding a disk-blackbody component. We find the tightest constraint by modelling the coadded spectrum of the observations A3 and A4. Any disk-blackbody component with inner-disk colour temperature keV must have an emitted luminosity erg s-1 ( confidence level) in the – keV band. If the inner-disk colour temperature keV, the upper limit to the emitted luminosity is erg s-1 in the same band. Those apper limits are comparable to the inferred disk fluxes from E4 and E5. We cannot tell whether the disk has significantly decreased in flux during the outburst, but clearly it did not become more luminous. We argue that the disk emission represented of the X-ray emission when the total – keV luminosity was erg s-1; and it represented of the X-ray emission when the source had brightened to erg s-1. Thus, the brightening is entirely characterized by the enhancement of the power-law-like component.
3.4 Evidence of outflows
We further examined the behaviour at the peak of the 2006 outburst, when spectral fitting suggested the onset of an outflow. We directly compared the observed spectra A3 and A5, after rebinning them to increase the signal-to-noise. The ratio of the two spectra confirms in a model-independent way that a portion of the soft X-ray spectrum is absorbed in A5, consistent with an ionized column density cm-2, and an ionization parameter (Figure 9, bottom panel).
Those two characteristic values, similar to those often found in Seyfert galaxies (e.g., Crenshaw, Kraemer & George 2003), are clearly inconsistent with a simple uniform shell of absorbing material around the X-ray source. The ionizing luminosity (above eV) emitted by the ULX is erg s-1. This would imply a characteristic size cm for the absorbing gas, much larger than the characteristic size of the binary system. Considering that the increase in the absorption column density has occurred over only few days, and that typical maximum radial velocities of radiatively-driven outflows are cm s-1, we cannot expect the outflow to have reached distances larger than a few cm.
For a more accurate study, we tried using a radiatively-driven disk-wind model (Murray & Chiang 1995; Murray et al. 1995). We assume that , in which case we expect a mass loss rate in the wind g s-1. If the wind is launched from the inner disk, the initial (thermal) velocity – cm s-1 and the mass loss rate g s-1. The column density, integrated along a streamline, is
| (1) |
(Murray & Chiang 1995). For typical cm s-1 and a column density cm-2 as inferred from our spectral modelling, the wind would have to be launched from radii cm gravitational radii for a BH. This is two orders of magnitude larger than expected, by comparison with disk winds in AGN.
In summary, the problem we face is that if we were looking into a disk wind launched from cm we would see a column density cm-2 and, for erg s-1, an ionization parameter a few orders of magnitude higher than inferred from the soft X-ray absorption, and also too high for the wind to be radiatively accelerated. Increasing the mass outflow rate would decrease the ionization state of the gas but increase the column density. An analogous problem was discussed by Schurch & Done (2006). A possible way to keep the ionization parameter in the wind sufficiently low is to assume (following Murray et al. 1995, Proga, Stone & Kallman 2000, Proga & Kallman 2004) that the outflowing gas does not see most of the soft X-ray photons: it is shielded by “hitchhiking gas” at the inner face of the wind, or by the disk atmosphere at the base of the wind. In particular, this is expected to occur when the mass outflow rate is Eddington accretion rate, because the outflow is Compton thick (Pounds et al. 2003) and the gas in the outer wind does not directly see the soft X-ray irradiation. However, we do see most of the X-ray flux from X1: the ionized absorber is only removing % of the – keV flux from our line of sight (Figure 11). Qualitatively, we can explain this by assuming a low filling factor for the absorber (%). Alternatively, we can speculate that the observed soft X-ray flux has a direct (unabsorbed) component and an additional (%) component scattered into our line of sight by the outflowing gas; it is only the latter that bears the imprint of ionized absorption.
| Parameter | Value |
|---|---|
| (K) | (fixed) |
| () | (fixed) |
| (CGS) | |
| for A3: | |
| for A4: | |
| for A5: | |
| for A3: | |
| for A4 | |
| for A5: | |
| for A3: | |
| for A4 | |
| for A5: | |
4 The mass of the accreting BH
One of the unsolved mysteries regarding the nature of ULXs is the mass of the accreting BH. For NGC 1365 X1, there is realistically no chance to obtain a dynamical mass: the optical counterpart is not detected in the OM or in any other archival image we could find, and at 19 Mpc (distance modulus mag), a companion star would in any case be too faint for optical spectroscopy. Therefore, we need to rely on X-ray data for the physical identification of the X-ray source. Two arguments can be used, based on the Eddington limit or on the X-ray spectral features.
The 2006 outburst peaked at an X-ray flux corresponding to an isotropic luminosity erg s-1 in the – keV band, identical to the isotropic luminosity measured by ASCA in 2005 January. The outburst sequence of our Chandra spectra suggests that the beginning of the decline is associated with an increase in ionized absorption (column density cm-2, ionization parameter ), usually indicative of an outflow. We speculate that such outflow effectively blew away the X-ray emitting part of the inflow, causing the flux to drop by at least one order of magnitude. This behaviour is expected when the X-ray luminosity reaches or exceed the Eddington limit. This would suggest that the BH mass is . Coincidentally, the break in the ULX luminosity function is also found at an X-ray luminosity erg s-1 (Swartz et al. 2004; Gilfanov, Grimm & Sunyaev 2004), perhaps suggesting that it corresponds to the Eddington limit of the most massive non-nuclear BHs in the local Universe.
It is also possible that the emission is not isotropic, owing to mild geometrical beaming, so that the true luminosity is reduced by a factor of a few (Fabrika & Mescheryakov 2001; King et al. 2001). Furthermore, even for a standard Shakura-Sunyaev disk, the bolometric luminosity exceeds the classical Eddington luminosity by a factor (Shakura & Sunyaev 1973; Begelman, King & Pringle 2006; Poutanen et al. 2007). In fact, a steady solution exists for accretion rates , in which the excess accreting matter is blown away in an outflow, which is optically thin along the disc axis but optically thick along the other directions. This provides a natural explanation for the scattering and collimation of the inner-disk emission along the disk axis (King & Pounds 2003; Begelman et al. 2006; Poutanen et al. 2007). For a given observed flux, mild beaming and super-Eddington emission (Begelman 2006) reduce the required BH mass, making it consistent with the stellar-mass range.
The X-ray spectral analysis may provide an independent constraint to the BH mass and perhaps a better understanding of the source properties. If the source is in a thermal-dominant state (that is, dominated by a standard, optically-thick, geometrically-thin accretion disk), a tight correlation is predicted (and observed from Galactic BHs) between fitted inner-disk radius, bolometric disk luminosity and peak color temperature of the disk: . If we assume that (innermost stable circular orbit: in the Schwarzschild geometry, in the maximally-rotating Kerr geometry), the BH mass can be inferred from the previous relation, as (Makishima et al. 2000; Ross, Fabian & Ballantyne 2002). In the case of NGC 1365 X1, a candidate disk component is significantly detected at high signal-to-noise in the two long XMM-Newton observations E4 and E5 (Tables 5, 6). We extrapolate bolometric disk luminosities erg s-1 and erg s-1, for E4 and E5, and fitted inner-disk radii of km and km respectively. If we identify the apparent inner-disk radius with the innermost stable circular orbit, the BH mass would be (from E4) or (from E5).
This discrepancy between the two observations already hints that standard-disk relations may not be a reliable indicator for BH masses in ULXs. More generally, we argue that such disk relations should not be directly applied to ULXs (see also Soria & Kuncic 2007; Soria 2007). The reason is that the X-ray spectra of most ULXs (including NGC 1365 X1) appear to be dominated by a Comptonization component (phenomenologically modelled by a power-law or broken power-law), not by thermal disk emission. The presence of a dominant Comptonized component implies that most of the accretion power has been removed from the disk via non-radiative processes, and transferred to a jet or a corona. This necessarily affects the direct disk emission, in particular from the inner region, decreasing its luminosity and temperature. A similar phenomenon is observed from the Galactic BH XTE J1550564 in its very high state (Kubota & Done 2004; Done & Kubota 2006). A possible physical mechanism for a non-radiative, vertical extraction of power from the disk via magnetic torques was proposed by Kuncic & Bicknell (2004). Its effect is to flatten the disk temperature profile at small radii; as a result, the peak of the disk emission occurs at larger radii () and lower temperatures, leading to an over-estimate of the BH mass. Another possibility is that for very high accretion rates, the inner disk is completely replaced or covered by a moderately optically-thick corona, responsible for the power-law-like emission (Roberts 2007). In this case, too, the fitted inner-disk radius is not the innermost stable circular orbit: it is instead the transition radius between outer (standard) disk and modified inner region of the inflow, much larger than . Unfortunately, none of the brightest ULXs has ever been seen settling down into a disk-dominated state (unlike for example XTE J1550564). So, we do not have an independent measurement of their innermost stable orbit when the standard disk is not affected by Comptonization.
In this scenario, we can use the fitted values of and to estimate the BH mass only if we can quantify how the transition radius moves outwards from the innermost stable orbit, as a function of increasing (Soria 2007). A possible suggestion is that such transition radius spherization radius (Shakura & Sunyaev 1973), in which case and , where would be the peak colour temperature of a standard disk extended to . A more comprehensive discussion of the relation between transition radius and accretion rate is left to further work (Soria & Kuncic 2007b, in preparation). Here we mention only one very simple argument: if the emitted luminosity in the disk component is times the total luminosity (with – for “canonical” ULXs, Stobbart et al. 2006), we speculate that the standard disk radiates most of the accretion power for , while the accretion power released at contributes to the Comptonized component. This provides a lower limit for the transition radius, because the radiative efficiency of the Comptonizing medium is less than that of the disk, and part of the accretion power from the inner region may also be carried away as mechanical luminosity of an outflow. For NGC 1365 X1, we found that about of the X-ray luminosity was in the power-law component during the E4 and E5 observations, which suggests that of the accretion power was extracted from the disk or inner inflow via non-radiative processes. (We also found that this fraction must have increased to during the 2006 outburst). Taken at face value, this suggests that the fitted disk radius . Thus, we argue that the X-ray spectral properties are consistent with BH masses –, even in the absence of beaming.
Can we reduce this mass estimate even further? We need to consider that even the most luminous disks detected in the thermal dominant or very high states of stellar-mass BHs are always at least a factor of three fainter than the (isotropic) disk luminosities inferred for NGC 1365 X1 and other bright ULXs. No Galactic BH has been seen with a disk luminosity erg s-1 as measured in X1. This suggests that the BH mass in this and other similar ULXs may still be a few times higher than in Galactic BHs, unless ULX luminosities are systemetically enhanced by mild beaming while those of the brightest Galactic BHs are not.
5 Conclusions and speculations
We have investigated the intriguing behaviour of a ULX in the spiral galaxy NGC 1365 (in the Fornax cluster), characterized by high X-ray luminosity (peaking at erg s-1) and order-of-magnitude variability over timescales of weeks and months. We studied the system with XMM-Newton and Chandra, at different luminosities between 2002 and 2006.
The X-ray spectrum of NGC 1365 X1 is always dominated by a broad component well modelled as a power-law. The power-law photon index is –, consistent with the 1995 ASCA observations. In fact, when an additional thermal component is also taken into account, the slope may be even higher, , at least in the – keV range, with a possible break at higher energies. A soft excess consistent with disk-blackbody emission is significantly detected in the XMM-Newton spectra with higher signal-to-noise ratio. It contributes of the observed X-ray flux when the ULX has a – keV luminosity erg s-1, but it is not detected, and must contribute of the flux, when the ULX is near the outburst peak, at luminosities three times higher. This — and similar findings for other bright ULXs — suggests that one of the fundamental physical properties of this class of systems is that a large fraction of accretion power is extracted via non-thermal processes (for example, magnetic torques) rather than being directly radiated by an accretion disk, and that such fraction increases at higher accretion rates. A likely consequence is that the temperature profile of the inner accretion disk may be flatter than that of a standard disk; alternatively, the inner disk may be entirely replaced or covered by a Comptonizing region. In all cases, the direct disk emission component would appear cooler and truncated at larger radii. This may lead to an overestimate of the central BH mass from simple spectral fitting (intermediate-mass BH scenario). A similar phenomenon has been seen in at least one Galactic BH, XTE J1550564 (Done & Kubota 2006), and may be triggered when .
It is sometimes noted that the spectral state behaviour of ULXs does not appear to follow the same pattern of canonical state transitions extensively studied in stellar-mass BHs (Section 1). We suggest that we can now start to outline a general sequence of spectral states applicable to both stellar-mass BHs and ULXs. Accreting BHs of any mass are in a low/hard state at low accretion rates (), when the inner disk is truncated at large radii because not enough mass is flowing inwards. They are found in a soft (thermal-dominant) state at intermediate accretion rates (), when the disk reaches the innermost stable orbit and radiates all the accretion power. They might switch to a high/hard state at higher accretion rates () when most of the power begins to be extracted from the inner disk via non-radiative mechanisms (Poynting flux or mechanical power), and most of the emerging photons are coming from the Comptonizing medium. For the Comptonizing corona may become optically thick or replace the disk altogether. The open question is why ULXs seem to spend most of their active time in the high/hard state, rather than in the thermal dominant state. The reason may be related either to their higher BH mass or, more likely, to a consistently higher mass transfer rate from their massive donor stars.
An exceptional, serendipitous result of our Chandra sequence of observations in 2006 April is that we caught the rise, peak and decline of a strong but short-lived outburst (-folding timescale d). This flare may be similar to those observed in the power-law-dominated very high state of Galactic BHs. There is evidence of increased absorption from ionized gas (column density cm-2, ionization parameter ) as the flux starts to decline. This might be due to the onset of an outflow as the source exceeded its Eddington limit. We speculate that the relatively low ionization parameter of the absorber is due to partial shielding of the wind from direct X-ray irradiation.
Finally, we discussed two possible arguments, based on the X-ray luminosity and spectral features, to constrain the mass of the accreting BH. We argue that the most likely range (consistent with both arguments) is – even without taking into account the possibility of mild geometrical beaming or super-Eddington emission (which would further reduce the required BH mass).
Acknowledgments
We thank Martin Elvis, Zdenka Kuncic and Aneta Siemiginowska for valuable comments. This work was partially supported by NASA contract NAS 8-03060 (Chandra X-ray Center), Chandra grant G06-7102X (PI: GR) and XMM-Newton grant NAG 13161 (PI: GF). RS acknowledges support from an OIF Marie Curie Fellowship No. 509329
References
- (1) Arnaud K. A., 1996, in Jacoby G. H., Barnes J., eds, Astronomical Data Analysis Software and Systems V, ASP Conference Series, Vol. 101, p. 17
- (2) Begelman M. C., 2006, ApJ, 643, 1065
- (3) Begelman M. C., King A. R., Pringle J. E., 2006, MNRAS, 370, 399
- (4) Brocksopp C., et al., 2002, MNRAS, 331, 765
- (5) Crenshaw D., Kraemer S. B., George I. M., 2003, ARA&A, 41, 117
- (6) Dewangan G. C., Griffiths R. E., Rao A. R., 2006, ApJ, 641, L125
- (7) Dewangan G. C., Miyaji T., Griffiths R. E., Lehmann I., 2004, ApJ, 608, L57
- (8) Dickey J. M., Lockman F. J., 1990, ARA&A, 28, 215
- (9) Done C., Kubota A., 2006, MNRAS, 371, 1216
- (10) Ebisawa K., ycki P., Kubota A., Mizuno T., Watarai K., 2003, ApJ, 597, 780
- (11) Fabbiano G., Zezas A., King A. R., Ponman T. J., Rots A., Schweizer F., 2003, ApJ, 584, L5
- (12) Fabrika S., Mescheryakov A., 2001, in Schilizzi R. T., Vogel S. N., Paresce F., Elvis M. S., eds, Proc. IAU Symp. 205, Galaxies and their constituents at the highest angular resolution, Astron. Soc. Pac., San Francisco, p. 268 (astro-ph/0103070)
- (13) Fender R. P., Belloni T. M., Gallo E., 2004, MNRAS, 355, 1105
- (14) Ferrarese L., 2000, ApJS, 128, 431
- (15) Gilfanov M., Grimm H.-J., Sunyaev R., 2004, NuPhS, 132, 369
- (16) Goad M. R., Roberts T. P., Reeves J. N., Uttley P., 2006, MNRAS, 365, 191
- (17) Iyomoto N., Makishima K., Fukazawa Y., Tashiro M., Ishisaki Y., 1997, PASJ, 49, 425
- (18) Kaaret P., Simet M. G., Lang C. C., 2006, ApJ, 646, 174
- (19) King A. R., Davies M. B., Ward M. J., Fabbiano G., Elvis M., 2001, ApJ, 522, L109
- (20) King A. R., Pounds K. A., 2003, MNRAS, 345, 657
- (21) Komossa S., Schulz H., 1998, A&A, 339, 345
- (22) Kong A. K. H., Di Stefano R., 2005, ApJ, 632, L107
- (23) Kubota A., Done C., 2004, MNRAS, 353, 980
- (24) Kubota A., Mizuno T., Makishima K., Fukazawa Y., Kotuku J., Ohnishi T., Tashiro M., 2001, ApJ, 547, L119
- (25) Kuncic Z., Bicknell G. V., 2004, ApJ, 616, 669
- (26) Lindblad P. O., 1999, A&ARv, 9, 221
- (27) Liu J.-F., Bregman J. N., 2005, ApJS, 157, L59
- (28) Makishima K., et al., 2000, ApJ, 535, 632
- (29) Miller J. M., Fabian A. C., Miller M. C., 2004, ApJ, 607, 931
- (30) Mizuno T., et al., 2007, PASJ, 59, 257
- (31) Monet D. G., et al., 2003, AJ, 125, 984
- (32) Murray N., Chiang J., 1995, ApJ, 454, L105
- (33) Murray N., Chiang J., Grossman S. A., Voit G. M., 1995, ApJ, 451, 498
- (34) Page M. J., Davis S. W., Salvi N. J., 2003, MNRAS, 343, 1241
- (35) Pounds K. A., Reeves J. N., King A. R., Page K. L., O’Brien P. T., Turner M. J. L., 2003, MNRAS, 345, 705
- (36) Poutanen J., Lipunova G., Fabrika S., Butkevich A. G., Abolmasov P., 2007, MNRAS, in press (astro-ph/0609274)
- (37) Proga D., Kallman T. R., 2004, ApJ, 616, 688
- (38) Proga D., Stone J. M., Kallman T. R., 2000, ApJ, 543, 686
- (39) Protassov R., van Dyk D. A., Connors A., Kashyap V. L., Siemiginowska A., 2002, ApJ, 571, 545
- (40) Remillard R. A., McClintock J. E., 2006, ARA&A, 44, 49
- (41) Risaliti G., 2007, in Ho L. C., Wang J. M., eds, proc. of The central engine of active galactic nuclei, in press (astro-ph/0701108)
- (42) Risaliti G., Elvis M., Fabbiano G., Baldi A., Zezas A., 2005a, ApJ, 623, L93
- (43) Risaliti G., Bianchi S., Matt G., Baldi A., Elvis M., Fabbiano G., Zezas A., 2005b, ApJ, 630, L129
- (44) Roberts T. P., 2007, Ap&SS, in press
- (45) Roberts T. P., Kilgard R. E., Warwick R. S., Goad M. R., Ward M. J., 2006, MNRAS, 371, 1877
- (46) Roberts T. P., Warwick R. S., Ward M. J., Goad M. R., Jenkins L. P., 2005, MNRAS, 357, 1363
- (47) Ross R. R., Fabian A. C., Ballantyne D. R., 2002, MNRAS, 336, 315
- (48) Roussel H., Sauvage M., Vigroux L., Bosma A., 2001, A&A, 372, 427
- (49) Sandage A., Tammann G. A., 1981, Revised Shapley-Ames catalog of bright galaxies (Washington: Carnegie Institution)
- (50) Schurch N. J., Done C., 2006, MNRAS, 371, 81
- (51) Shakura N. I., Sunyaev R. A., 1973, A&A, 24, 337
- (52) Sobczak G. J., McClintock J. E., Remillard R. A., Cui W., Levine A. M., Morgan E. H., Orosz J. E., Bailyn C. D., 2000, ApJ, 544, 993
- (53) Sobczak G. J., McClintock J. E., Remillard R. A., Bailyn C. D., Orosz J. A., 1999, ApJ, 520, 776
- (54) Soria R., 2007, Ap&SS, submitted
- (55) Soria R., Kuncic Z., 2007, AdSpR, in press (astro-ph/0705.1374)
- (56) Stobbart A.-M., Roberts T. P., Wilms J., 2006, MNRAS, 368, 397
- (57) Strickland D. K., Colbert E. J. M., Heckman T. M., Weaver K. A., Dahlem M., Stevens I. R., 2001, ApJ, 560, 707
- (58) Swartz D. A., Ghosh, K. K., Tennant A. F., Wu K., 2004, ApJS, 154, 519
- (59) Trudolyubov S. P., Borozdin K. N., Priedhorsky W. C., 2001, MNRAS, 322, 309
- (60) Tsunoda N., Kubota A., Namiki M., Sugiho M., Kawabata K., Makishima K., 2006, PASJ, 58, 108
- (61) Weisskopf M. C., Brinkman B., Canizares C., Garmire G., Murray S., Van Speybroeck L. P., 2002, PASP, 114, 1
- (62) Wolter A., Trinchieri G., Colpi M., 2006, MNRAS, 373, 1627
- (63) Wu K., et al., 2002, ApJ, 565, 1161