Neutron-capture elements in the very metal-poor star HD 88609: another star with excesses of light neutron-capture elements11affiliation: Based on data collected at the Subaru Telescope, which is operated by the National Astronomical Observatory of Japan.
Abstract
We obtained a high resolution, high signal-to-noise UV-blue spectrum of the extremely metal-poor red giant HD 88609 to determine the abundances of heavy elements. Nineteen neutron-capture elements are detected in the spectrum. Our analysis revealed that this object has large excesses of light neutron-capture elements while heavy neutron-capture elements are deficient. The abundance pattern shows a continuously decreasing trend, as a function of atomic number, from Sr to Yb, which is quite different from those in stars with excesses of r-process elements. Such an abundance pattern is very similar to that of HD 122563 that was studied by our previous work. The results indicate that the abundance pattern found in the two stars could represent the pattern produced by the nucleosynthesis process that provided light neutron-capture elements in the very early Galaxy.
1 Introduction
Over the past few decades, a considerable number of studies have been conducted to identify the origin of neutron-capture elements. Measurements of heavy elements for very metal-poor stars provide a unique opportunity to determine the abundance patterns produced by individual nucleosynthesis processes in the early Galaxy (e.g., McWilliam et al., 1995), which are key to understanding the astrophysical sites of the processes. In particular, detailed abundance studies for selected neutron-capture enhanced, metal-poor stars have revealed that heavy neutron-capture elements () show an abundance pattern that is identical, within the measurement errors, to that of the r-process component of solar-system material (e.g., Sneden et al., 1996).
However, these objects show some deficiencies in light neutron-capture elements () compared to the scaled solar r-process curve (e.g., Sneden et al., 2000; Hill et al., 2002). This means that the r-process abundance pattern in solar-system material is not fully explained by the component that makes the pattern found in such r-process-enhanced stars (sometimes referred to as “main” r-process), but another component that yields light neutron-capture elements with small production of heavy ones is required. Indeed, a some fraction of very metal-poor stars have high abundance ratios of light neutron-capture elements Sr, Y, and Zr, while their heavy ones (e.g., Ba, Eu) are very deficient (e.g., McWilliam, 1998; Aoki et al., 2005). Such objects possibly record the abundance patterns produced by the second component.
The component that is responsible for light neutron-capture elements of the r-process fraction of solar-system material is not well understood, and no established name is given. We here refer to this process as “weak” r-process (Wanajo & Ishimaru, 2006). It should be noted that the r-process component in the solar system is derived by subtracting the s-process component from the solar abundances, based on the s-process models (Käppeler et al., 1989). Therefore, the weak r-process referred in this paper possibly corresponds to some processes other than r-process.
The bright metal-poor ([Fe/H]) star HD 122563 is one of the stars having excesses of light neutron-capture elements. Our previous work obtained high resolution spectroscopy for this object and determined the abundances of 19 neutron-capture elements from Sr to Yb () (Honda et al., 2006, ; hereafter Paper I). The abundances of neutron-capture elements in this star continuously decrease with the increase of atomic number. That is, the elements with intermediate mass () have moderate enhancements with respect to heavy ones (). This is the first determination of the overall abundance pattern that could represent the yields of the weak r-process mentioned above.
In this paper, we report the abundance pattern of neutron-capture elements in the extremely metal-poor red giant HD 88609. Previous studies (e.g., Honda et al., 2004b) showed that this object has large excesses of light neutron-capture elements and underabundances of heavy ones similar to HD 122563. The metallicity of HD 88609 ([Fe/H]) is even lower than that of HD 122563 ([Fe/H]). Hence, HD 88609 could be an ideal object in order to study the nature of the weak r-process. However, abundance measurements of the neutron-capture elements for this object are quite limited because of the deficiency of heavy neutron-capture elements. We determined the detailed abundance pattern of heavy elements for this object based on a high resolution, high signal-to-noise ratio spectrum. The observation and abundance measurements are reported in § 2 and 3, respectively. The results are compared with previous work in § 4. In § 5, the results are compared with the abundance pattern of the solar-system r-process component, and with that of HD 122563. Implications of our new measurement for HD 88609 are also discussed.
2 Observations
High dispersion spectroscopy of HD 88609 was carried out with the Subaru Telescope High Dispersion Spectrograph (HDS: Noguchi et al., 2002) on 30 April, 2004 and 19-20 October 2005. Our spectrum covers the wavelength range from 3020 to 4780 Å with a resolving power of = 90,000, as in the study for HD 122563 (Paper I). The total exposure time of the two observing runs is 12600 seconds. In addition, the spectrum around 5000 Å obtained by Honda et al. (2004b) was used to determine the abundances of Cu, Zn, Y, and Ba abundances (see Table 1 for the details of the observations).
The data reduction was carried out in a standard manner using the IRAF echelle package111IRAF is distributed by National Optical Astronomy Observatories, which are operated by the Association of Universities for Research in Astronomy, Inc., under cooperative agreement with the National Science Foundation as described in Paper I and Honda et al. (2004a). The signal to noise ratio (S/N) of the spectrum (per 0.9 km s-1 pixel) estimated from the photon counts is 50 at 3100 Å; 200 at 3500 Å; 370 at 3900 Å; 510 at 4200 Å and 650 at 4500 Å. These S/N ratios are not as high as those of the spectrum of HD 122563 (Paper I), but sufficient for our purposes.
3 Analysis
For our quantitative abundance measurements, we used the analysis program SPTOOL developed by Y. Takeda (private communication), based on Kurucz’s ATLAS9/WIDTH9 (Kurucz, 1993). SPTOOL calculates synthetic spectra and equivalent widths of lines on the basis of the given model atmosphere, line data, and chemical composition, under the assumption of LTE.
We adopted the model atmosphere parameters (effective temperature: , gravity: , micro-turbulent velocity: , and metallicity: [Fe/H]) derived by Honda et al. (2004b): = 4550 K, = 1.1, = 2.4 km s-1, and [Fe/H] .
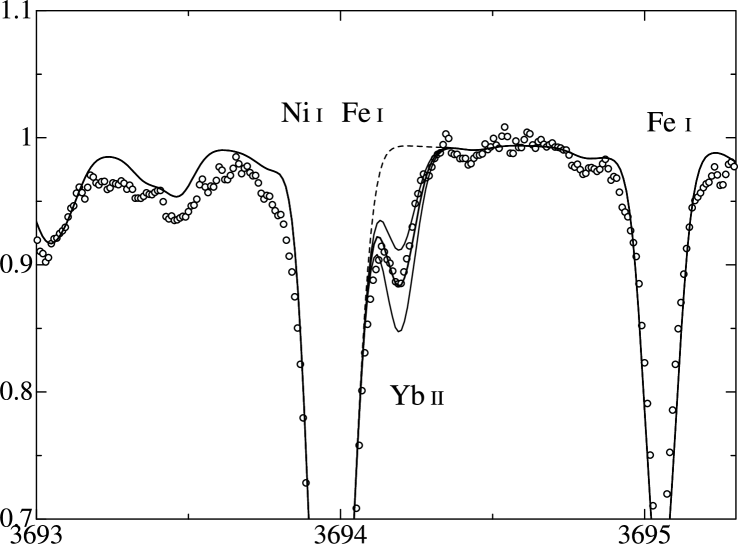
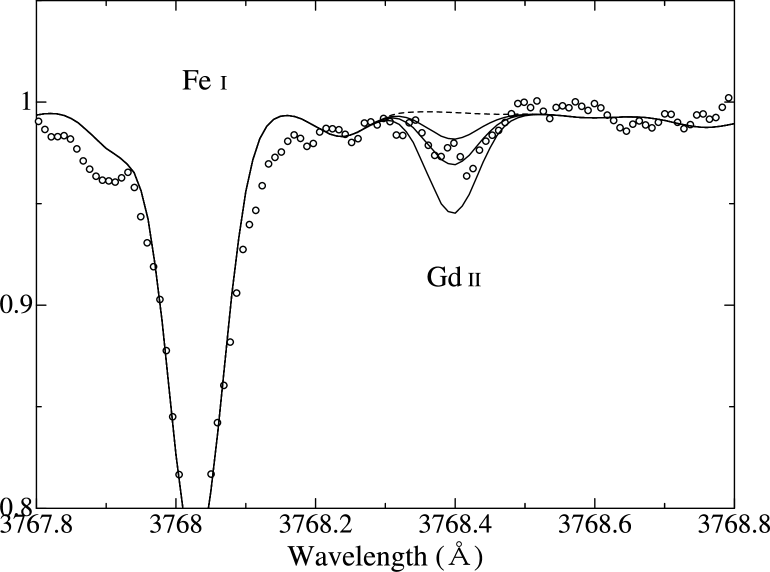
We adopted the line list used in the previous study for HD 122563 (Paper I), which is given in Table 2. All the lines used in the previous study were also detected in the spectrum of HD 88609. An advantage in the present analysis is that, since the metallicity of this object is lower than that of HD 122563, the effect of the blends of lines decreases. Equivalent widths of isolated lines are measured by fitting a gaussian profile. The lines of Cu I 5105, Zn I 4810, Y II 4883, Y II 5087, and Ba II 4934 are analyzed using the spectrum of Honda et al. (2004a), which has sufficient S/N in this wavelength region (150 at 5000 Å). The values of the equivalent widths of Ba II 5853 and 6141 Å are adopted from Johnson (2002). The results are given in Table 3. A spectrum synthesis technique is applied to lines which are severely affected by blending and/or hyperfine splitting. Equivalent widths of such lines given in Table 2 are calculated by spectrum synthesis for the derived abundances. We used the solar system abundances obtained by Asplund et al. (2005) to derive [X/Fe] values. Figure 1 depicts representative examples of the quality of the observed spectra, and the fits to synthetic spectra. The abundances of HD 122563 are also given in this table for comparison purposes. We note that the list of abundances in Table 2 of Paper I contains small mistakes, which are corrected in Table 3 of the present paper. The difference is at most 0.08 dex (Ce), and does not have significant influence on the conclusions of the previous paper.
The size of the random errors is estimated from the standard deviation (1) of the abundances derived from individual lines for elements that have four or more lines available for the abundance analysis. For the abundances of elements based on less than four lines, we employ the mean of the random errors estimated from those elements with four or more lines available (0.12 dex). For most of these elements, the abundances derived from individual lines distribute within 0.12 dex around the mean abundance that is adopted as the final result. Exceptions are Cu, Dy, and Er, for which we adopt 0.20 dex as the random errors. We also estimate the random errors in the abundance measurement from the uncertainties of equivalent width measurements, which are estimated using the relation (Norris et al., 2001). The errors of abundances from equivalent width measurement are smaller than 0.12 dex for most lines. The estimated errors for Cu I 5105 and Gd II 3549 are very large, because of the weakness of these lines. However, the abundance results do not significantly change if these lines are excluded in the analysis. We note that, since contaminations to the Eu II 3819, 4205, and Gd II 3481 are possibly significant, these lines are not used to derive final results.
Although the S/N ratio of the HD 122563 spectrum is better than the HD 88609 one, the standard deviation of the abundances derived from four or more lines for HD 88609 (0.12 dex) is slightly smaller than those for HD 122563 (0.14 dex). This suggests that factors other than the quality of the spectrum also affect the random errors.
The atmospheric parameters of HD 88609 are quite similar to those of HD 122563, and the same line set is used for the abundance analysis. Therefore, we adopt the errors due to the uncertainties of the atmospheric parameters ( = 100 K, = 0.3 dex, = 0.5 km s-1, and [Fe/H] = 0.20 dex) estimated for HD 122563 (Table 3 of Paper I). The total systematic errors which are shown in Table 3 () are derived by the root sum square (r.s.s.) of the uncertainties contributed by the four parameters. Such systematic errors do not significantly affect the abundance ratios of neutron-capture elements, in particular those derived from species with the same ionization stage. The effects of uncertainties of atmospheric parameters on abundance ratios (and the abundance pattern) of neutron-capture elements are estimated by the following procedure; 1) we calculate the average of the abundance changes due to the change of each atmospheric parameters (e.g., ) for neutron capture elements (19 species); 2) we calculate the deviation of the abundance changes for individual species from the above average value; 3) we adopt the r.s.s. of the above deviations for the four parameters as the systematic errors for the discussion on the abundance ratios ( in Table 3). The typical value is 0.07 dex for the ionized species, while that is 0.12 dex for the neutral ones.
The radial velocity is measured using 14 clean iron lines. The derived radial velocity is –37.69 0.3 km s-1 from the data of Oct. 2005. This value agrees well with the value –37.28 0.43 km s-1 derived by our previous study (Honda et al., 2004a). There is, so far, no evidence that this object belongs to a binary system.
4 Comparisons with previous studies
In spite of the brightness of HD 88609, abundance measurements of neutron-capture elements have been reported only for several species in previous work, because of the deficiency of heavy neutron-capture elements. Figure 2 shows comparisons of the abundances of neutron-capture elements derived by the present analysis with recent studies by Johnson (2002), Fulbright et al. (2004), and Honda et al. (2004b).
Since the present work adopts the atmospheric parameters determined by Honda et al. (2004b) for the abundance analysis, no systematic error is expected. Although Sr, Y, Zr, and Ba are detected by Honda et al. (2004b), many lines are added to previous data by this analysis. The abundances of these elements determined by the two studies agree within the errors. We note that the Ba abundance derived by the present work is higher than the value of Honda et al. (2004b), but this is because the present analysis includes the two lines in the red region that give systematically higher abundances than those from the two resonance lines.
Johnson (2002) and Johnson & Bolte (2001, 2002) analyzed the neutron-capture elements in this object. A comparison of equivalent widths of 25 lines of Zn, Y, Zr, and Ba (Figure 3) shows a systematic difference by 11% between the two studies. This results in the abundance difference of at most 0.1 dex. Indeed, the abundances of Y, Zr, and Ba derived by our analysis technique using the equivalent width of Johnson (2002) and Johnson & Bolte (2001, 2002), differ only 0.03 – 0.08 dex from their results.
The abundances determined by the present study agree well with their results. However, the atmospheric parameters adopted in their analysis differ from ours: the effective temperature adopted in our analysis is 150K higher than that of Johnson (2002), while our gravity () is 0.7 dex higher than their value. The differences of these parameters could result in systematic abundance differences of about 0.3 dex, which are not found between the two studies.
Fulbright et al. (2004) reanalyzed the spectrum of HD 88609 partially using the equivalent widths of Johnson (2002). Since they derived the atmospheric parameters by a similar method to Honda et al. (2004b), the values are in good agreement with ours. However, systematic difference in the derived abundances is found between the two works (Figure 2).
The comparisons of our results with those of Johnson (2002), Johnson & Bolte (2001, 2002), and Fulbright et al. (2004) show that systematic differences exist in abundances of neutron-capture elements, taking account of adopted atmospheric parameters. A possible reason for this discrepancy is the difference of abundance analysis tools. We note that, although we can not identify the reason for this systematic difference, the abundance ratios (patterns) of neutron-capture elements show relatively good agreement between these works.
5 Discussion and concluding remarks
Our abundance analyses for HD 88609 based on high resolution spectroscopy determined the abundances of 19 neutron-capture elements as for HD 122563 by our previous work. The discussion in this section focuses on the comparison of the abundance patterns of these elements between the two objects, and implications of the new results obtained for HD 88609.
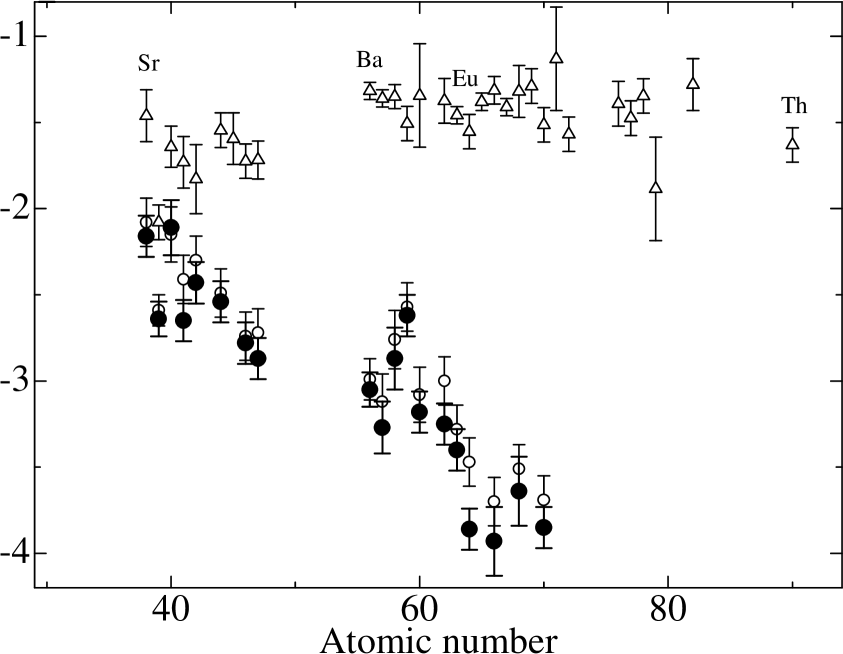
Figure 4 shows the abundance pattern of HD 88609, compared with that of the solar-system r-process component. This figure clearly shows that the abundances of light neutron-capture elements (38 Z 47) are much higher than those of heavy ones in HD 88609, compared to the solar-system r-process pattern. This indicates that the neutron-capture elements of HD 88609, as we found for HD 122563, are not a result of the main r-process, but were produced by another process.
Figure 5 shows the abundance differences from the solar system r-process component in the logarithmic scale for HD 88609 (this work), HD 122563 (Paper I), and CS 22892-052 (Sneden et al., 2003). A clear result is that the abundance pattern of HD 88609 is very similar to that of HD 122563. This result was partially expected from the sample selection: we selected objects having high abundance ratios between light and heavy neutron-capture elements (e.g., Sr/Ba). However, an important finding is that the two objects have quite similar abundance patterns of elements between the first and second abundance peaks (), which are determined for HD 88609, for the first time, by the present work.
We discussed possible nucleosynthesis processes that explain the abundance pattern of HD 122563 in Paper I. The main r-process and the main s-process are excluded, because they produce much higher abundance ratios of heavy to light neutron-capture elements than found in HD 122563. The weak s-process is unlikely to be the source of neutron-capture elements of HD 122563, because of the moderate excesses of elements with intermediate mass (e.g., Pd). We concluded that an unknown component of the r-process is responsible for the light neutron-capture elements in HD 122563. We referred to the “lighter element primary process (LEPP)” proposed by Travaglio et al. (2004) and the “weak” (or “failed”) r-process (Wanajo & Ishimaru, 2006) as the possible sources of neutron-capture elements in Paper I. Our present study reveals that HD 88609 is the second example of metal-poor stars that have the abundance pattern representing such a process, and HD 122563 is not a peculiar object.
Here we inspect the difference of the abundance patterns between the two objects in some detail. Figure 6 shows the abundance differences of neutron-capture elements on a logarithmic scale between HD 88609 and HD 122563 as a function of atomic number. The least square fit to the data points suggests that the decreasing trend is steeper in HD 88609 than that in HD 122563. The regression analysis and the Spearman rank correlation test indicate that the null hypothesis that there is no correlation between the abundance difference and the atomic number is rejected at the 95% confidence level. Hence, though the result is not definitive, a correlation between the two values likely exists.
Our conclusion here is that the abundance patterns of neutron-capture elements in HD 88609 and HD 122563 are quite similar, though a small difference is suggested. One might recall the proposed uniqueness of the abundance pattern produced by the main r-process, which is confirmed by the observations of several r-process enhanced, extremely metal-poor stars (cf. Cowan & Sneden, 2006). Theoretical studies based on the neutrino wind scenario also predict the robustness of abundance patterns when the requisite physical conditions (e.g., high entropy, short dynamic timescale, or low electron fraction) for the production of the main r-process nuclei are obtained (Wanajo et al., 2001, 2002). However, the similarity of the abundance patterns found in the two objects can not be interpreted as uniqueness of the pattern produced by the weak r-process (or LEPP), because the two objects were selected to have similarly high Sr/Ba abundance ratios. Model calculations for insufficient conditions for the main r-process show that the r-processing appears to be highly sensitive to the model parameters (e.g., electron fraction), resulting in various abundance curves (S. Wanajo et al., in preparation). It may be possible, therefore, that we have just found two similar ones out of various abundance curves from the very weak r-process (producing only Sr, Y, and Zr) to the main r-process (producing Ba, Eu, and heavier). Further observations of objects having different Sr/Ba ratios will uncover the diversity of abundance patterns. In case that the similarity of the weak r-process patterns is confirmed for a larger sample of stars, it will provide unique constraints on the theoretical r-process modeling.
We also discussed the origin of heavy neutron-capture elements () in HD 122563, whose abundances significantly deviate from the solar-system r-process abundance pattern, in Paper I. We argued the possibility of some contamination of the s-process that can partially explain the excesses of Ba, La, and Ce with respective to Eu, though an s-process contribution is unlikely significant at the metallicity of that object, i.e. [Fe/H]. The metallicity of HD 88609 ([Fe/H]) is even lower than that of HD 122563. No previous studies suggest contributions of the s-process to objects with such low metallicity.222Exceptions are carbon-enhanced metal-poor stars, which are presumably affected by nucleosynthesis of asymptotic giant branch stars and mass transfer across a binary system (e.g., Aoki et al., 2007). HD 88609, as well as HD 122563, is not an object belonging to this class. Therefore, we conclude that the deviation of the abundances of heavy neutron-capture elements in HD 88609, and probably in HD 122563, from the main r-process pattern is not a result of contamination of the s-process yields, but implies that the weak r-process produces a different abundance pattern of heavy neutron-capture elements from that produced by the main r-process. This result gives another constraint on the models of the process that yielded light neutron-capture elements in the very early Galaxy.
References
- Aoki et al. (2005) Aoki, W., et al. 2005, ApJ, 632, 611
- Aoki et al. (2007) Aoki, W., Beers, T. C., Christlieb, N., Norris, J. E., Ryan, S. G., & Tsangarides, S. 2007, ApJ, 655, 492
- Asplund et al. (2005) Asplund, M., Grevesse, N., & Sauval, A. J. 2005, in ASP Conf. Ser. 336, Cosmic Abundances as Records of Stellar Evolution and Nucleosynthesis, ed. T. G. Barnes III & F. N. Bash (San Francisco: ASP), 25
- Cowan et al. (2002) Cowan, J. J., et al. 2002, ApJ, 572, 861
- Cowan & Sneden (2006) Cowan, J. J. & Sneden, C. 2006, Nature, 440, 1151
- Den Hartog et al. (2003) Den Hartog, E. A., Lawler, J. E., Sneden, C. & Cowan,J. J. 2003, ApJS, 148, 543
- Fulbright et al. (2004) Fulbright, J. P., Rich, R. M., & Castro, S. 2004, ApJ, 612, 447
- Hill et al. (2002) Hill, V., et al. 2002, A&A, 387, 560
- Honda et al. (2004a) Honda, S., et al. 2004a, ApJS, 152, 113
- Honda et al. (2004b) Honda, S., et al. 2004b, ApJ, 607, 474
- Honda et al. (2006) Honda, S., Aoki, W., Ishimaru, Y., Wanajo, S., & Ryan, S. G. 2006, ApJ, 607, 474 (Paper I)
- Johnson & Bolte (2001) Johnson, J. A. & Bolte, M. 2001, ApJ, 554, 888
- Johnson (2002) Johnson, J. A. 2002, ApJS, 139, 219
- Johnson & Bolte (2002) Johnson, J. A. & Bolte, M. 2002, ApJ, 579, 616
- Johnson & Bolte (2004) Johnson, J. A. & Bolte, M. 2004, ApJ, 605, 462
- Käppeler et al. (1989) Käppeler, F., Beer, H.,& Wisshak, K., 1989, Rep. Prog. Phys., 52, 945
- Kurucz & Bell (1995) Kurucz, R. L., & Bell. B 1995, Kurucz CD-ROM,No.23 (Harvard-Smithsonian Center for Astrophysics)
- Kurucz (1993) Kurucz, R. L. 1993, Kurucz CD-ROM,No.13 (Harvard-Smithsonian Center for Astrophysics)
- Lawler et al. (2004) Lawler, J. E., Sneden, C., & Cowan, J. J., 2004, ApJ, 604, 850
- Lawler et al. (2001a) Lawler, J. E., Bonvallet, G., & Sneden, C. 2001a, ApJ, 556, 452
- Lawler et al. (2001b) Lawler, J. E., Wickliffe, M. E., Den Hartog, E. A., & Sneden, C. 2001b, ApJ, 563, 1075
- McWilliam (1998) McWilliam, A. 1998, AJ, 115, 1640
- McWilliam et al. (1995) McWilliam, A, Preston, G. W., Sneden, C, & Searle, L 1995, AJ, 109, 27
- Noguchi et al. (2002) Noguchi, K.,et al. 2002, PASJ, 54, 855
- Norris et al. (2001) Norris, J. E., Ryan, S. G., & Beers, T. C. 2001, ApJ, 561, 1034
- Simmerer et al. (2004) Simmerer, J., Sneden, C., Cowan, J. J., Collier, J., Woolf, V. M., & Lawler, J. E. 2004, ApJ, 617, 1091
- Sneden (1973) Sneden, C. 1973, ApJ, 184, 839
- Sneden et al. (1996) Sneden, C., McWilliam, A., Preston, G. W., Cowan, J. J., Burris, D. L., & Armosky, B. J. 1996, ApJ, 467, 819
- Sneden et al. (2000) Sneden, C, Cowan, J. J., Ivans, I. I., Fuller, G. M., Burles, S, Beers, T. C., & Lawler, J. E. 2000, ApJ, 533, L139
- Sneden et al. (2003) Sneden, C., et al. 2003, ApJ, 591, 936
- Travaglio et al. (2004) Travaglio, C., Gallino, R., Arnone, E., Cowan, J., Jordan, F., & Sneden, C. 2004, ApJ, 601, 864
- Wanajo et al. (2001) Wanajo, S., Kajino, T., Mathews, G. J., & Otsuki, K. 2001, ApJ, 554, 578
- Wanajo et al. (2002) Wanajo, S., Itoh, N., Ishimaru, Y., Nozawa, S., & Beers, T. C. 2002, ApJ, 577, 853
- Wanajo & Ishimaru (2006) Wanajo, S. & Ishimaru, Y. 2006, Nucl. Phys. A, 777, 676
- Westin et al. (2000) Westin, J., Sneden, C., Gustafsson, B., & Cowan, J. J. 2000, ApJ, 530, 783
| Obs. Date | April 20. 2004 | October 19-20. 2005 |
|---|---|---|
| Wavelength | 3070 - 4780 Å | 3020 - 4610 Å |
| Resolution | 90,000 | 90,000 |
| Exp. Time | 3600 sec | 9000 sec |
| SN @ 3500 | 120 | 150 |
| SN @ 4000 | 240 | 330 |
| 4550 K | ||
| 1.1 | ||
| 2.4 km s-1 | ||
| [Fe/H] | –3.07 0.2 |
| Wavelength | L.E.P.(eV) | log | log | W(mÅ) | W | error | ref |
| Cu I, | |||||||
| 3247.53 | 0.000 | –0.060 | 0.75 | 110.2* | 1.07 | 0.03 | 8 |
| 3273.95 | 0.000 | –0.360 | 0.85 | 103.2* | 0.99 | 0.03 | 8 |
| 5105.55 | 1.390 | –1.520 | 0.39 | 1.8** | 1.16 | 0.49 | 2 |
| Zn I, | |||||||
| 3302.98 | 4.030 | –0.057 | 1.90 | 15.6* | 0.92 | 0.03 | 1 |
| 3345.02 | 4.078 | 0.246 | 1.96 | 26.3 | 0.83 | 0.02 | 1 |
| 4722.15 | 4.030 | –0.390 | 1.91 | 10.4 | 1.24 | 0.06 | 5 |
| 4810.54 | 4.080 | –0.170 | 1.90 | 14.2** | 1.22 | 0.04 | 5 |
| Sr I, | |||||||
| 4607.33 | 0.000 | 0.280 | –0.21 | 2.2 | 0.24 | 0.04 | 7 |
| Sr II, | |||||||
| 4077.71 | 0.000 | 0.170 | –0.20 | 169.8 | 0.31 | 0.01 | 6 |
| 4215.52 | 0.000 | –0.170 | –0.18 | 154.2 | 0.28 | 0.01 | 6 |
| Y II, | |||||||
| 3327.88 | 0.410 | 0.130 | –0.93 | 55.4 | 0.86 | 0.02 | 8 |
| 3549.01 | 0.130 | –0.280 | –1.00 | 50.6 | 0.56 | 0.01 | 7 |
| 3584.52 | 0.100 | –0.410 | –1.09 | 41.5* | 0.53 | 0.01 | 10 |
| 3600.74 | 0.180 | 0.280 | –1.15 | 68.5 | 0.52 | 0.01 | 7 |
| 3611.04 | 0.130 | 0.010 | –1.12 | 60.2 | 0.51 | 0.01 | 7 |
| 3628.70 | 0.130 | –0.710 | –0.96 | 31.3 | 0.50 | 0.01 | 10 |
| 3710.29 | 0.180 | 0.460 | –1.10 | 82.6 | 0.45 | 0.01 | 10 |
| 3747.55 | 0.100 | –0.910 | –0.97 | 25.3 | 0.43 | 0.01 | 7 |
| 3774.33 | 0.130 | 0.210 | –1.04 | 78.2 | 0.42 | 0.01 | 6 |
| 3788.70 | 0.100 | –0.070 | –1.02 | 67.4 | 0.41 | 0.01 | 6 |
| 3818.34 | 0.130 | –0.980 | –0.77 | 29.7 | 0.40 | 0.01 | 6 |
| 3950.36 | 0.100 | –0.490 | –0.95 | 49.6 | 0.35 | 0.01 | 6 |
| 4398.01 | 0.130 | –1.000 | –0.83 | 29.1 | 0.26 | 0.01 | 6 |
| 4883.69 | 1.080 | 0.070 | –0.91 | 22.3** | 1.20 | 0.03 | 6 |
| 5087.43 | 1.080 | –0.170 | –0.94 | 13.7** | 1.16 | 0.04 | 6 |
| Zr II, | |||||||
| 3438.23 | 0.090 | 0.420 | –0.27 | 93.1 | 0.68 | 0.02 | 7 |
| 3457.56 | 0.560 | –0.530 | –0.07 | 33.7 | 0.66 | 0.02 | 7 |
| 3479.02 | 0.530 | –0.690 | –0.31 | 18.6 | 0.63 | 0.02 | 7 |
| 3479.39 | 0.710 | 0.170 | –0.47 | 39.3 | 0.63 | 0.01 | 7 |
| 3499.58 | 0.410 | –0.810 | –0.52 | 13.5 | 0.61 | 0.02 | 7 |
| 3505.67 | 0.160 | –0.360 | –0.39 | 52.0 | 0.60 | 0.01 | 7 |
| 3536.94 | 0.360 | –1.310 | –0.22 | 10.5 | 0.57 | 0.03 | 7 |
| 3551.96 | 0.090 | –0.310 | –0.29 | 64.2 | 0.56 | 0.01 | 8 |
| 3573.08 | 0.320 | –1.040 | –0.25 | 18.2 | 0.54 | 0.02 | 7 |
| 3578.23 | 1.220 | –0.610 | –0.20 | 4.9 | 0.54 | 0.05 | 7 |
| 3630.02 | 0.360 | –1.110 | –0.24 | 14.7 | 0.50 | 0.02 | 7 |
| 3714.78 | 0.530 | –0.930 | –0.23 | 15.2 | 0.45 | 0.01 | 7 |
| 3836.77 | 0.560 | –0.060 | –0.39 | 45.3 | 0.39 | 0.01 | 6 |
| 3998.97 | 0.560 | –0.670 | 0.09 | 39.8 | 0.33 | 0.01 | 7 |
| 4050.33 | 0.710 | –1.000 | –0.12 | 11.1 | 0.32 | 0.01 | 7 |
| 4208.98 | 0.710 | –0.460 | –0.13 | 30.7 | 0.29 | 0.01 | 6 |
| 4317.32 | 0.710 | –1.380 | –0.04 | 6.1 | 0.27 | 0.02 | 6 |
| Nb II, | |||||||
| 3163.40 | 0.376 | 0.260 | –1.63 | 14.9 | 1.47 | 0.06 | 1 |
| 3215.59 | 0.440 | –0.190 | –1.81 | 3.4 | 1.19 | 0.20 | 6 |
| Mo I, | |||||||
| 3864.10 | 0.000 | –0.010 | –1.00 | 2.7 | 0.38 | 0.07 | 8 |
| Ru I, | |||||||
| 3498.94 | 0.000 | 0.310 | –1.02 | 3.5 | 0.61 | 0.07 | 6 |
| 3728.03 | 0.000 | 0.270 | –0.81 | 5.3 | 0.44 | 0.03 | 6 |
| Rh I, | |||||||
| 3692.36 | 0.000 | 0.174 | –1.25 | syn | 6 | ||
| Pd I, | |||||||
| 3404.58 | 0.810 | 0.320 | –1.35 | 6.2* | 0.73 | 0.05 | 6 |
| Ag I, | |||||||
| 3280.68 | 0.000 | –0.050 | –2.03 | 5.1* | 0.97 | 0.10 | 6 |
| Ba II, | |||||||
| 4554.04 | 0.000 | 0.170 | –1.82 | 96.7 | 0.24 | 0.00 | 6 |
| 4934.10 | 0.000 | –0.150 | –1.76 | 86.8** | 1.19 | 0.02 | 6 |
| 5853.70 | 0.604 | –1.010 | –1.58 | 8.4*** | 2.80 | 0.19 | 6 |
| 6141.70 | 0.704 | –0.070 | –1.67 | 36.1*** | 2.94 | 0.05 | 6 |
| La II | |||||||
| 3794.77 | 0.240 | 0.210 | –2.68 | 3.2* | 0.41 | 0.06 | 7 |
| 3988.52 | 0.400 | 0.210 | –2.81 | 1.5 | 0.34 | 0.10 | 4 |
| 3995.75 | 0.170 | –0.060 | –2.81 | 1.6* | 0.34 | 0.09 | 4 |
| 4086.71 | 0.000 | –0.070 | –2.54 | 4.7* | 0.31 | 0.03 | 4 |
| 4123.23 | 0.320 | 0.130 | –2.93 | 1.2* | 0.30 | 0.13 | 4 |
| Ce II | |||||||
| 4222.60 | 0.120 | –0.180 | –2.19 | 1.1 | 0.28 | 0.14 | 6 |
| 4523.08 | 0.520 | –0.080 | –1.73 | 1.3* | 0.24 | 0.07 | 10 |
| 4539.78 | 0.330 | –0.080 | –2.11 | 1.0 | 0.24 | 0.10 | 10 |
| 4562.37 | 0.480 | 0.190 | –2.13 | 1.1 | 0.24 | 0.09 | 10 |
| 4572.28 | 0.680 | 0.290 | –1.95 | 1.1* | 0.24 | 0.09 | 8 |
| Pr II | |||||||
| 4179.40 | 0.200 | 0.480 | –2.22 | 7.3 | 0.29 | 0.02 | 7 |
| 4189.48 | 0.370 | 0.380 | –2.18 | 4.0 | 0.29 | 0.03 | 8 |
| Nd II | |||||||
| 3784.25 | 0.380 | 0.150 | –2.28 | 1.6 | 0.41 | 0.13 | 9 |
| 3826.42 | 0.064 | –0.410 | –2.10 | 1.7 | 0.40 | 0.12 | 9 |
| 4061.08 | 0.471 | 0.550 | –2.10 | 4.8 | 0.32 | 0.03 | 9 |
| 4232.38 | 0.064 | –0.470 | –1.98 | 2.0* | 0.28 | 0.07 | 9 |
| Sm II | |||||||
| 4318.94 | 0.280 | –0.270 | –2.52 | 0.8* | 0.27 | 0.21 | 7 |
| 4642.23 | 0.380 | –0.520 | –2.31 | 0.6 | 0.23 | 0.18 | 7 |
| Eu II | |||||||
| 3819.67aaLines that were not used to derive final results. References.– 1.Kurucz & Bell (1995); 2.Westin et al. (2000); 3.Lawler et al. (2001a); 4.Lawler et al. (2001b); 5.Johnson (2002); 6.Hill et al. (2002); 7.Cowan et al. (2002); 8.Sneden et al. (2003); 9.Den Hartog et al. (2003); 10.Johnson et al. (2004); 11.Lawler et al. (2004). | 0.000 | 0.510 | –2.96 | syn | 5 | ||
| 4129.70 | 0.000 | 0.220 | –2.89 | 7.7* | 0.30 | 0.02 | 5 |
| 4205.05aaLines that were not used to derive final results. References.– 1.Kurucz & Bell (1995); 2.Westin et al. (2000); 3.Lawler et al. (2001a); 4.Lawler et al. (2001b); 5.Johnson (2002); 6.Hill et al. (2002); 7.Cowan et al. (2002); 8.Sneden et al. (2003); 9.Den Hartog et al. (2003); 10.Johnson et al. (2004); 11.Lawler et al. (2004). | 0.000 | 0.210 | –2.81 | syn | 5 | ||
| Gd II | |||||||
| 3331.40aaLines that were not used to derive final results. References.– 1.Kurucz & Bell (1995); 2.Westin et al. (2000); 3.Lawler et al. (2001a); 4.Lawler et al. (2001b); 5.Johnson (2002); 6.Hill et al. (2002); 7.Cowan et al. (2002); 8.Sneden et al. (2003); 9.Den Hartog et al. (2003); 10.Johnson et al. (2004); 11.Lawler et al. (2004). | 0.000 | –0.140 | -2.3 | syn | 7 | ||
| 3481.80aaLines that were not used to derive final results. References.– 1.Kurucz & Bell (1995); 2.Westin et al. (2000); 3.Lawler et al. (2001a); 4.Lawler et al. (2001b); 5.Johnson (2002); 6.Hill et al. (2002); 7.Cowan et al. (2002); 8.Sneden et al. (2003); 9.Den Hartog et al. (2003); 10.Johnson et al. (2004); 11.Lawler et al. (2004). | 0.490 | 0.230 | –1.66 | 5.5* | 0.63 | 0.05 | 7 |
| 3549.37 | 0.240 | 0.260 | –2.92 | 0.7 | 0.56 | 0.85 | 7 |
| 3768.40 | 0.080 | 0.360 | –2.73 | 2.3 | 0.42 | 0.09 | 7 |
| Dy II | |||||||
| 3460.97 | 0.000 | –0.070 | –2.71 | 1.8 | 0.65 | 0.22 | 7 |
| 3531.71 | 0.000 | 0.770 | –2.98 | 6.5 | 0.58 | 0.04 | 8 |
| Ho II | |||||||
| 3398.94 | 0.000 | 0.410 | –2.20 | syn | 11 | ||
| Er II | |||||||
| 3499.10 | 0.060 | 0.136 | –2.96 | 1.9 | 0.61 | 0.12 | 10 |
| 3692.65 | 0.050 | 0.138 | –2.63 | 4.3 | 0.46 | 0.06 | 6 |
| Tm II | |||||||
| 3701.36 | 0.000 | –0.540 | –2.8 | syn | 8 | ||
| Yb II | |||||||
| 3289.37 | 0.000 | 0.020 | –2.99 | 18.2* | 0.95 | 0.03 | 8 |
| 3694.19 | 0.000 | –0.300 | –2.90 | 13.4* | 0.46 | 0.02 | 8 |
| Ir I | |||||||
| 3220.76aaLines that were not used to derive final results. References.– 1.Kurucz & Bell (1995); 2.Westin et al. (2000); 3.Lawler et al. (2001a); 4.Lawler et al. (2001b); 5.Johnson (2002); 6.Hill et al. (2002); 7.Cowan et al. (2002); 8.Sneden et al. (2003); 9.Den Hartog et al. (2003); 10.Johnson et al. (2004); 11.Lawler et al. (2004). | 0.350 | –0.510 | –1.00 | syn | 7 | ||
| 3800.12 | 0.000 | –1.450 | –1.30 | syn | 7 | ||
| Th II | |||||||
| 4019.12 | 0.000 | –0.270 | –2.65 | syn | 7 |
| HD 88609 | HD 122563 | |||||||||
|---|---|---|---|---|---|---|---|---|---|---|
| species | Z | log | [X/Fe] | N | log | [X/Fe] | aa indicates the root sum square of the uncertainties contributed by the four atmospheric parameters. | bb indicates the fluctuation of the quantity of the change for each elements which are the differences from the average of quantity with atmospheric parameter changed in HD 122563. | ||
| Cu | 29 | 0.66 | 0.20 | –0.48 | 3 | 0.98 | 0.14 | –0.46 | 0.36 | 0.29 |
| Zn | 30 | 1.92 | 0.03 | +0.39 | 4 | 2.01 | 0.15 | +0.18 | 0.08 | 0.07 |
| Sr | 38 | –0.20 | 0.12 | –0.05 | 3 | –0.12 | 0.14 | –0.27 | 0.14, 0.34 | 0.10, 0.27 |
| Y | 39 | –0.98 | 0.10 | –0.12 | 15 | –0.93 | 0.09 | –0.37 | 0.20 | 0.12 |
| Zr | 40 | –0.24 | 0.16 | +0.24 | 17 | –0.28 | 0.16 | –0.10 | 0.15 | 0.06 |
| Nb | 41 | –1.72 | 0.12 | –0.07 | 2 | –1.48 | 0.14 | –0.13 | 0.14 | 0.06 |
| Mo | 42 | –1.00 | 0.12 | +0.15 | 1 | –0.87 | 0.14 | –0.02 | 0.19 | 0.12 |
| Ru | 44 | –0.91 | 0.12 | +0.32 | 2 | –0.86 | 0.14 | 0.07 | 0.20 | 0.12 |
| Rh | 45 | –1.25 | +0.70 | 1 | –1.20 | +0.45 | ||||
| Pd | 46 | –1.35 | 0.12 | +0.03 | 1 | –1.31 | 0.14 | –0.23 | 0.20 | 0.12 |
| Ag | 47 | –2.03 | 0.12 | +0.10 | 1 | –1.88 | 0.14 | –0.05 | 0.21 | 0.13 |
| Ba | 56 | –1.71 | 0.10 | –0.81 | 4 | –1.65 | 0.12 | –1.05 | 0.15 | 0.05 |
| La | 57 | –2.75 | 0.15 | –0.81 | 5 | –2.60 | 0.16 | –0.96 | 0.13 | 0.08 |
| Ce | 58 | –2.02 | 0.18 | –0.53 | 5 | –1.91 | 0.17 | –0.72 | 0.12 | 0.07 |
| Pr | 59 | –2.20 | 0.12 | +0.14 | 2 | –2.15 | 0.14 | –0.09 | 0.14 | 0.06 |
| Nd | 60 | –2.11 | 0.12 | –0.49 | 4 | –2.01 | 0.16 | –0.69 | 0.13 | 0.07 |
| Sm | 62 | –2.41 | 0.12 | –0.35 | 2 | –2.16 | 0.14 | –0.40 | 0.13 | 0.07 |
| Eu | 63 | –2.89 | 0.12 | –0.33 | 1 | –2.77 | 0.14 | –0.52 | 0.14 | 0.08 |
| Gd | 64 | –2.83 | 0.12 | –0.88 | 2 | –2.44 | 0.14 | –0.76 | 0.15 | 0.07 |
| Dy | 66 | –2.85 | 0.20 | –0.92 | 2 | –2.62 | 0.14 | –0.99 | 0.14 | 0.08 |
| Ho | 67 | –2.20 | +0.36 | 1 | –2.00 | +0.26 | ||||
| Er | 68 | –2.79 | 0.20 | –0.65 | 2 | –2.66 | 0.14 | –0.82 | 0.14 | 0.08 |
| Tm | 69 | –2.80 | +0.27 | 1 | –3.00 | –0.23 | ||||
| Yb | 70 | –2.94 | 0.12 | –0.95 | 2 | –2.78 | 0.14 | –1.09 | 0.14 | 0.06 |
| Ir | 77 | –1.30 | +0.39 | 2 | –1.60 | –0.21 | ||||
| Th | 90 | –2.65 | +0.36 | 1 | –3.05 | –0.34 |