A model for the Globular Cluster extreme anomalies
Abstract
In spite of the efforts made in the latest years, still there is no comprehensive explanation for the chemical anomalies of globular cluster stars. Among these, the most striking is oxygen depletion, which reaches values down to [O/Fe] in most clusters, but in M13 it goes down to less than [O/Fe]. In this work we suggest that the anomalies are due to the super position of two different events: 1) primordial self–enrichment: this is asked to explain the oxygen depletion down to a minimum value [O/Fe]; 2) extra mixing in a fraction of the stars already born with anomalous composition: these objects, starting with already low [O/Fe], will reduce the oxygen abundance down to the most extreme values. Contrary to other models that invoke extra mixing to explain the chemical anomalies, we suggest that it is active only if there is a fraction of the stars in which the primordial composition is not only oxygen depleted, but also extremely helium rich (Y), as found in a few GCs from their main sequence multiplicity. We propose that the rotational evolution (and an associated extra mixing) of extremely helium rich stars may be affected by the fact that they develop a very small or non existent molecular weight barrier during the evolution. We show that extra mixing in these stars, having initial chemistry that has already been CNO processed, affects mainly the oxygen abundance, and to a much smaller extent if affects the sodium abundance. The model also predicts a large fluorine depletion concomitant with the oxygen depletion, and a further enhancement of the surface helium abundance, which reaches values close to Y=0.5 in the computed models. We stress that, in this tentative explanation, those stars that are primordially O–depleted, but are not extremely helium rich do not suffer deep extra mixing.
keywords:
globular clusters; chemical abundances; self-enrichment1 Introduction
The recent observations of abundance spreads among Globular Clusters stars, now observed also at the turnoff (TO) and among the subgiants (e.g., Gratton et al., 2001) show that these anomalies must be mainly attributed to some process of “self–enrichment” occurring at the first stages of the life of the cluster. Two main sources have been proposed as basis for the self–enrichment:
-
1.
WMAGB: Winds of massive AGBs. During the epoch starting some yr from the birth of the first stellar generation, when all the Supernovae have already exploded (carrying away from the clusters their high velocity ejecta) the massive Asymptotic Giant Branch (AGB) stars evolve, losing their envelopes cycled through the hot CNO-cycle (Hot Bottom Burning –HBB) in low velocity winds, that may remain into the cluster and form the second generation (Cottrell & Da Costa, 1981; Ventura et al., 2001).
-
2.
WFRMS: winds of fast rotating massive stars. The primordial gas cloud, from which the first generation stars are born, is contaminated with the winds ejected from fastly rotating massive stars during the first few million years of the cluster life (Maeder & Meynet, 2006; Decressin et al., 2006). This model implies a very fast second stage of star formation, preceding the supernova events whose energetic input on the cluster gas may preclude any further star formation.
In the case of WFRMS, the primordial gas from which the fist stellar generation is born is certainly still present when the nuclearly processed stellar envelopes are ejected, and these latter may be diluted at different degrees in the primordial gas before new stars are formed. In the case of WMAGB, remnant gas of the first generation may still be present and dilute the ejecta either if the polluting stars are only the most massive AGBs (those referred to as super-AGBs), or if, e.g., GCs are formed into dwarf galaxies at the time of the evolution of massive AGBs (Bekki et al., 2007). In the latter case, the gas ejected from the AGBs may be collected and pollute the gas present in the region where the cluster is being formed. Otherwhise, it is scarcely credible that the winds are diluted with residual gas before forming stars of the second generation (Cottrell & Da Costa, 1981), as several decades of million years have passes, and the supernovae have cleaned up the cluster. In fact, it has also been suggested that the spreads in chemical abundances are actually due to the birth of successive generation of stars directly from the ejecta of the massive AGBs of the first generation (D’Antona et al., 2002).
Neither model has been yet explored from a dynamic point of view. The role of the fast post-main sequence winds and of their energetic input in the case of WFRMS is not clear. An escape from the fact that the supernova events will be dramatic for the gas environment in the clusters is to consider that stars more massive than 25 may end their life collapsing into black holes. The advantage of this scenario is that the requirements on the initial mass budget in massive stars is less severe than the constraints of the AGB scenario (Prantzos & Charbonnel, 2006; Decressin et al., 2006). In regard to the chemistry, both models are still not fully adequate, although there is scarce doubt that the abundance anomalies we see are born in matter processed through the hot CNO cycle, with little –if any– influence of the third dredge up in AGBs (Ventura et al., 2002; Ventura & D’Antona, 2005a).
An important prediction of both scenarios is that the second stellar generation must have helium content enhanced, at some degree, with respect to the helium content of the first stellar generation, that probably reflects the Big Bang abundance. In recent years, the prediction of the spread that is naturally associated with the helium abundance in the AGB ejecta, allowed to interpret the morphology of extended HBs in some globular clusters in terms of a spread in the initial helium content of the cluster stars (D’Antona et al., 2002; D’Antona & Caloi, 2004; Lee et al., 2005). Interestingly enough, after the D’Antona & Caloi (2004) interpretation of the HB of NGC 2808 in terms of two populations differing in initial helium content, a very peculiar helium distribution in the cluster stars was inferred from the presence of a “blue main sequence”, containing 15–20% of stars, in the same cluster (D’Antona et al., 2005), similar to what had been found in Cen (Bedin et al., 2004; Norris, 2004; Piotto et al., 2005). New and better data by Piotto et al. (2007) have actually shown that the main sequence of NGC 2808 actually is formed by three main components, precisely as the D’Antona et al. (2005) interpretation of the HB population required (see their Figure 9). In general, the main sequence morphology can allow to detect differences in helium content only when the helium content is really very large (D’Antona et al., 2002; Salaris et al., 2006). In fact, both in NGC 2808 and Cen, a straightforward interpretation through stellar models assigns Y0.4 to the bluest main sequence. This population however is only the “tip of the iceberg”, as the interpretation of the HB morphologies requires in many clusters that 50% or more of the stars have enhanced helium abundance (e.g. Caloi & D’Antona, 2007; D’Antona et al., 2006). The most straightforward interpretation of existing data is that most clusters have a population with enhanced helium (up to Y0.3–0.33), but only a few have a small population with very high helium, such as NGC 2808.
We now try to understand whether we can recognize a similar behaviour
also in the sodium versus oxygen anticorrelation,
which represents the most clear evidence of chemical anomalies (e.g. Sneden, 1991).
This anticorrelation is present in most clusters examined so far. The maximum reduction
found for oxygen in most clusters reaches a minimum value
[O/Fe]111
as usual [X/Fe]=, where N
indicates the abundances in number., while the “normal” population in GCs and the
halo stars have [O/Fe]
(see, e.g. Carretta et al., 2006, their Fig. 5). Sodium in the stars with
reduced oxygen is in the range [Na/Fe], while [Na/Fe]0 in the “normal” stars.
The Na–O anticorrelation is also present among the TO and
subgiant stars, as shown by Gratton et al. (2001), and therefore it can not
inputed to ‘in situ’ mixing. In addition to these typical anomalies, some
clusters have a small number of stars showing more extreme behaviour:
while the largest sodium abundance remains at +0.7, oxygen
can be reduced down to [O/Fe] in a few stars in the cluster M13
(e.g. Kraft et al., 1993).
The cluster NGC 2808, which shows the “blue main sequence” with Y0.40
comprising about 15% of the cluster stars, also seems to have a similar fraction of
extremely oxygen depleted stars, according to Carretta et al. (2006).
We are led to suggest, purely on observational grounds,
that the stars having the lowest oxygen values belong to the same group of
those stars having the highest initial helium abundance.
Further, until today, the most extreme anomalies are only found in red giants.
In this work, we try to understand whether these information can be used
to derive some simple hint on the interpretation of the abundance anomalies, to be used
as a constraint on the formation of the second stellar generation.
In Section 2 we examine the possible
schemes for the explanation of the Na–O anticorrelation. Among the different
possibilities, we suggest that some among the “typically extreme” ([O/Fe]–0.4,
[Na/Fe]+0.5–0.7) stars evolve into the most extreme Oxygen poor giants
due to an “in situ” extra mixing. In other words,
we will make the case that not all the abundance anomalies can be attributed to the chemistry
processed in the progenitor stars (being either WMAGB or WFRMS pollutors), and that we need some
process of extra–mixing in the red giant stage to explain the most extreme anomalies.
In some clusters only, we suggest that there is extra mixing in red giants, and correlate it
to the existence of an extremely helium rich population. We
justify this suggestion on the basis of the different model structures during the RGB
stage for differing stellar helium content (in Appendix). In Section 3 we summarize
the concept of “canonical” and “non canonical” extra–mixing in the literature.
In Section 4 we model parametrically extra–mixing during the RGB
evolution. We show that the results of extra mixing depend on the
abundances assumed for the initial stellar chemistry.
Starting from already anomalous composition, deep extra mixing will mainly affect the oxygen
abundance.
Table 1 summarizes the possible scenarios to understand the GC chemical anomalies.
We also show the effect of this parmetric extra mixing on the Fluorine abundance, and point out
that the models, starting already with Y=0.4, show a surface helium increase up to Y0.5,
which could be important to understand the very hot subdwarfs present in the HB of some clusters.
2 Explaining the observational sodium vs. oxygen anticorrelation
2.1 The abundance patterns and the dilution model
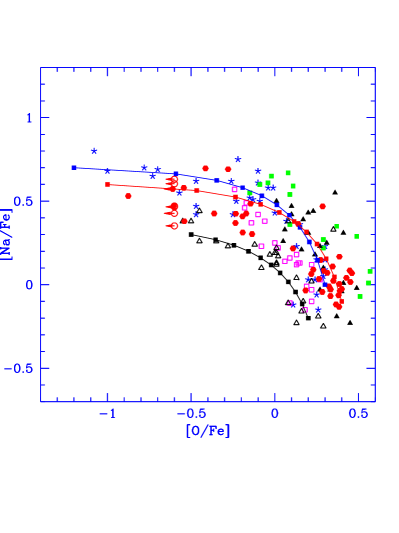
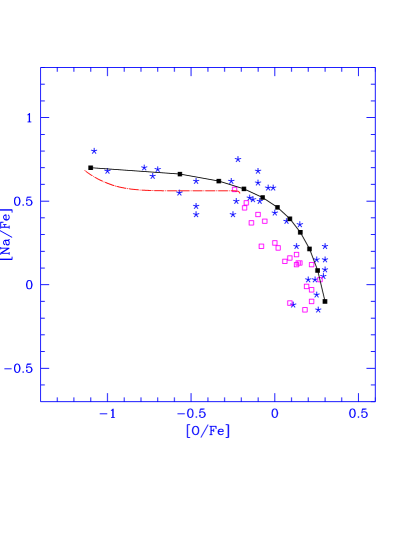
We show in Figure 1 the Sodium versus Oxygen abundances among the stars in several GCs. In contrast with the halo field stars, which occupy only the lower right side of the figure (high oxygen, normal sodium), many of the GC stars show low oxygen and higher sodium (e.g. Sneden et al., 2004). The case of the clusters M3 and M13 is shown separately in the right side of the figure. The continuous lines with squares show a possible and straightforward interpretation of the abundance patterns: if we mix gas having the high Na–low O composition of the square at the extreme left with “normal” matter having the low Na–high O composition represented by the square at the extreme right, we obtain all the intermediate compositions. The matter giving origin to the second stellar generation should then have [O/Fe]–1.2 and [Na/Fe]0.7 in the case of M13, or less extreme values for other clusters, e.g. [O/Fe]-0.4 and [Na/Fe]0.3 for the case of M5.
| Source | Cluster | [O] | [Na] | Y | mechanism | ? |
| WFRMS | extreme GCs: | -1.3 | 0.7 | 0.40 | dilution with 1st gen. gas | not reliable: pollution by |
| (M13 ; NGC 2808) | fast winds is necessary | |||||
| WFRMS | extreme GCs | -0.4 | 0.5 | 0.40 | dilution with 1st gen. gas, | |
| extramixing for extreme c.c. | proposed here | |||||
| WFRMS | less extreme GCs | -0.4 | 0.5 | 0.35 | dilution – no extra mixing | proposed here |
| WMAGB | extreme GCs | -0.4 | 0.5 | 0.40 | undiluted gas, or dilution with 1st gen. gas | proposed here |
| extramixing for extreme c.c. | ||||||
| WMAGB | less extreme GCs | -0.4 - 0.0 | 0.3 - 0.5 | 0.35 | undiluted gas – no extra mixing |
In addition to M13, extremely small oxygen abundances are possibly present also among the stars in NGC 2808, as shown by the upper limits of Carretta et al. (2006) analysis. For M13 and possibly for NGC 2808, we seem to need a site of nucleosynthesis (the envelopes of massive stars, or of AGB stars) in which the oxygen abundance is reduced by 1.5dex.
2.2 Models of FRMS
The models by Decressin et al. (2006) show that the matter lost in the winds has composition which indeed keeps the signatures of CNO processing. For what concerns the Oxygen abundance, however, the maximun reduction they find is from an initial abundance of 3.0 to for a 120 evolution (their Table 5). At the same time, the largest oxygen anomalies are found together with extreme helium overabundances (Y up to 0.5 in the quoted 120 evolution). These overabundance are of great importance, as we will see later on. Thus, starting from an –enhanced [O/Fe]0.3 for the oxygen of the first stellar generation, the minimum abundance which could be found in second generation stars would be [O/Fe]-0.4. Decressin et al. (2006) also consider the fact that the Lithium abundances so far observed for turnoff stars in GCs are smaller than the primordial Lithium abundance, but still quite large. They use the value A(Li)=1.93222the notation is A(Li)=log [N(Li)/N(H)]+12 by Pasquini et al. (2005) to infer that the matter processed in the FRMS must be diluted with pristine matter (having A(Li) =2.61, Coc et al. 2004) in the proportion 2/3 from WFRMS and 1/3 from the pristine matter, in order to preserve this relatively low Lithium abundance. In this case, the minimum oxygen value becomes [O/Fe]–0.3. However the data on Lithium are scarce enough that we should postpone any judgment of this model based on Lithium to a more complete observational situation. There is an alternative possibility to reduce the oxygen content, which is worth mentioning: if we do not consider the average values for the abundances in the winds of FRMS, but their time evolution, much smaller oxygen abundances (down to ) can be achieved (Figure 6 in Decressin et al. 2006). If the winds may “directly” form stars, some of them might be as extreme as required by M13 observations. Notice however that, in this case, we need to use the chemistry which the winds reach in the phase of He–burning. At this stage, the stars are no longer fast rotating and the winds have high velocities, so that it is difficult to understand how they can be kept into the GC.
2.3 Models for massive AGB stars
For certain oxygen abundances as low as [O/Fe]–1 are not achieved in the yields of intermediate mass AGBs computed until today (Ventura & D’Antona, 2006; Bekki et al., 2007). Nevertheless, recent modelling of intermediate mass AGB stars of low metallicity is not doing a bad job to provide a reasonable framework to explain a great part of che GC chemical anomalies. Ventura & D’Antona 2005a; 2005b have considered carefully the role of convection model and nuclear reaction rates in fulfilling the requirements of the chemical patterns of abundances to be produced. In particular, they showed that the Na–O anticorrelation requires very efficient convection, to process the CNO through the ON cycle by HBB. A problem arises as, at the same temperature necessary for destroying oxygen, also Na is efficiently burned (e.g. Denissenkov & Herwig, 2003). After some very parametric attempts to solve this problem by means of a very small overshooting associated to the thermal pulse phase (Ventura & D’Antona, 2005c), a possible, very stable, solution is obtained by lowering the reaction rate 23Na(p,Ne within limits acceptable in the allowed limits for this cross section, and raising by a factor the initial neon abundance (Ventura & D’Antona, 2006). Nevertheless, the most recent finding is that, for M, there is a sort of “saturation” in the combined effect of HBB and mass loss, and the oxygen reduction can not go beyond dex333starting from [O/Fe], this means that in these models [O/Fe], as in the case of WFRMS. (Ventura and D’Antona 2007, in preparation). The sodium enhancement does not go beyond dex, but this may be linked to the initial values assumed for the abundance of 22Ne. These models are then able to explain the bulk of the Na–O anticorrelation, which is present in most GCs, but not the“extreme” stars of M13 and NGC 2808.
2.4 A closer look at the data
From 2.2 and 2.3 we conclude that both the possible sites for the nucleosynthesis necessary to explain the chemical anomalies are not consistent with the very low oxygen abundances of some giants of M13. Let us examine these in detail: the data provided by Sneden et al. (2004) for M13 contain 8 stars with [O/Fe]-0.4 and [Na/Fe] from 0.4 to 0.8; among these, 6 are brighter than Mv=-2.3 and are therefore essentially at the tip of the giant branch. Beside, 5 of them are surely variable, either semi- or irregular (I-48, II-90, L835, L940 from Kopacki et al. 2003, L954 in Welty 1985); one is a suspected variable (II-67 in Welty 1985). For the two lower luminosity stars (III-59 and I-12) there are no indications of variability. The extreme abundances and (very low) upper limits for oxygen concern a fraction of the stars in NGC 2808 (Carretta et al., 2006), but also these data refer to evolved giants. The compilation by Carretta et al. (2006) of the available data for the Na–O anticorrelation shows clearly that the scarcely evolved stars in GCs do not show abundances smaller than [O/Fe]–0.4 and that the data below [O/Fe]=–0.4 all belong either to M13 or to NGC 2808. In addition, although Cen is certainly much more complicated than a typical GC, the sample of giants examined by Norris & Da Costa (1995) contains a few upper limits on oxygen abundances below [O/Fe], for CN weak stars with high sodium abundances. From this discussion, it appears then possible that in some clusters, for a fraction of the evolved stars, an in situ mechanism acts to produce the extreme abundances.
2.5 Are the stars with extreme oxygen depletion also very helium rich?
Let us assume that the very helium rich sequences are present only in the clusters having the most extreme anomalies. Then the minimum helium content of the processed matter must be Y0.4. As shown by Decressin et al. (2006), the winds of massive rotating stars are heavily enriched in helium. In the dilution model, therefore, the most extreme anomalies —those associated with the pure stellar ejecta— would also correspond to the stars having the most extreme helium abundances. For the WMAGB model, the evolution of AGBs is characterized on the one side by HBB, and on the other side by an efficient second dredge up of helium, which raises the helium abundance in the envolopes to values from Y0.27 (for a 4star) to Y0.3–0.32 for a 6. There are until now no models computed for the super–AGBs (masses 7-8) of population II, and we can hypothize that these would reach the extreme helium required, Y0.4. Therefore, both models in principle suggest that the maximum helium values are linked to the most extreme anomalies. From an observational point of view, let us remember an intriguing result by Carretta et al. (2006) concerning NGC 2808. Dividing the cluster giants into three groups, with decreasing [O/Na], they notice that there is a very small increase in [Fe/H] in the three groups, exactly as one would expect if the Na–O anomaly is associated with a larger and larger helium content of the studied atmospheres: thus it is possible that the extremely low oxygen giants in NGC 2808 belong to the same group of stars which populate the blue main sequence, and the extreme blue tails of the horizontal branch distribution. Unfortunately, in M13, the only other cluster showing extremely low oxygen abundances, an high precision photometry of the MS is lacking, to see whether a blue main sequence can be isolated. For Cen, the other cluster showing a blue main sequence which can be interpreted in terms of very high helium (Bedin et al., 2004; Norris, 2004; Piotto et al., 2005), there might also be giants with extreme values for the anticorrelation Na-O (Norris & Da Costa, 1995), but further studies are needed.
We then have the following problem: the models may probably, in some cases, provide ejecta with extremely high helium content, but section 2.2 and 2.3 suggest that this same matter can not have the extreme oxygen content of M13 giants. These very low abundances, then, should be due to some in situ mechanism (extra mixing) taking place only in these stars. An important question we should ask is whether there is any physical reason to link a very high initial helium abundance to extra–mixing during the RGB evolution. We give a speculative answer in Appendix A.
3 Canonical and non canonical extra–mixing in red giants
Standard mixing due to the convection description based on the Schwarzschild instability criterion is not able to explain the decline of the abundance of Carbon and the strong reduction of the 12C/13C isotopic ratio in upper red giant branch (RGB) stars, both in the field and in star clusters (Sneden, 1991), and the decrease in surface Li abundance with increased luminosity (Pilachowski et al., 1993; Gratton et al., 2000). Additional mixing seems to be efficient in the evolving stars, as soon as the H-burning shell, advancing in mass, erases the chemical composition discontinuity left behind by the bottom of convective envelope at the end of the first dredge-up (Gratton et al. 2000; Shetrone 2003). At this moment, the evolution of red giants slows down for a while (see Fig. 8). This produces a prominent feature (the RGB bump) in the differential luminosity functions of globular clusters (Zoccali et al. 1999; Riello et al. 2003). The presence of the RGB bump can be taken as an experimental indication that the“standard” models of red giants actually make a good job in describing the evolution below the bump luminosity, and that no mechanisms of extra mixing in low-mass stars are acting, on the lower RGB, otherwhise the discontinuity left by convection would be smeared out and the bump would not be produced (Chanamé et al., 2005). The most credited hypothesis for preventing extra mixing below the bump is that the H-burning shell is shielded against mixing by the gradient in the mean molecular weight associated with the composition discontinuity (Sweigart & Mengel 1979; Charbonnel, Brown & Wallerstein 1998; Denissenkov & VandenBerg 2003) or, in any case, it operates very slowly (Chanamé et al. 2005; Palacios et al. 2006). Very recently, Eggleton et al. (2006) proposed a different analysis: mixing arises between the supposedly stable and radiative zone between the hydrogen-burning shell and the base of the convective envelope, due to Rayleigh-Taylor instability within a zone just above the hydrogen-burning shell, where the burning of the 3He left behind by the retreating convective envelope lowers slightly the mean molecular weight, leading to a local minimum.
| N | Nin | logT | [12C] | [14N] | [16O] | [19F] | [22Ne] | [23Na] |
|---|---|---|---|---|---|---|---|---|
| 1 st | 1 | 0 | -0.862 | 0.904 | -0.208 | -1.104 | -1.367 | 0.539 |
| 2 f | 600 | 0.13 | -2.009 | 0.936 | -0.209 | -1.106 | -1.598 | 0.548 |
| 3 f | 600 | 0.05 | -1.353 | 1.128 | -1.404 | -2.978 | -2.336 | 0.761 |
| 4 f | 600 | 0.06 | -1.373 | 1.119 | -1.140 | -2.740 | -2.388 | 0.687 |
| 5 ml | 600 | 0.06 | -1.356 | 1.129 | -1.467 | -3.047 | -2.358 | 0.840 |
| 6 f | 2000 | 0.06 | -1.393 | 1.096 | -0.811 | -2.378 | -2.416 | 0.672 |
| N | Nin | logT | Dmix | [12C] | [14N] | [16O] | [19F] | [22Ne] | [23Na] |
|---|---|---|---|---|---|---|---|---|---|
| 1 st | 1 | 0 | 0 | -0.862 | 0.904 | -0.208 | 0.300 | -1.367 | 0.539 |
| 2 f | 600 | 0.06 | 5e9 | -1.373 | 1.119 | -1.140 | -2.74 | -2.388 | 0.687 |
| 3 f | 600 | 0.06 | 5e8 | -1.534 | 1.077 | -0.656 | -2.279 | -3.205 | 0.581 |
| 4 f | 1050 | 0.06 | 5e8 | -1.555 | 1.055 | -0.537 | -2.121 | -3.160 | 0.578 |
| 5 f | 1050 | 0.06 | 2.5e8 | -1.576 | 1.033 | -0.446 | -1.872 | -2.737 | 0.568 |
| 6 f | 1500 | 0.06 | 5e8 | -1.287 | 1.015 | -0.405 | -1.590 | -1.954 | 0.568 |
| 7 f | 1500 | 0.06 | 2.5e8 | -1.085 | 0.980 | -0.327 | -1.349 | -1.646 | 0.557F |
For the majority of upper RGB stars, the surface abundance anomalies require that this in situ mixing penetrates down to the outer part of the H-shell, where the CN branch of the CNO–cycle is operating. This is the “canonical extra mixing”, in the definition of Denissenkov & VandenBerg 2003. These authors, parametrizing the depth and rate (diffusion coefficient) of extra-mixing below the formally convective region, find that the values which describe the “canonical” extra mixing are within the range from T 0.19 and Dmix cm to T 0.22 and Dmix cm. Here T is the difference between the logarithms of temperature at the base of the H-burning shell and at the maximum depth of extra mixing. These values then can explain the evolutionary decline of [C/Fe] in the upper RGB stars, both in the field and in star clusters. However, canonical extra mixing does not affect O, Na, Mg and Al, the elements which show anomalous abundances in the stars of GCs. A “non canonical” extra mixing in upper RGB stars, penetrating the H-burning shell deeper than in the canonical case, could dredge up material deficient in O and enriched in Na (Denisenkov & Denisenkova 1990), These models constituted an alternative view to the problem of GC chemical anomalies, until it was clear that these anomalies were present also in scarcely evolved stars. Once established that the self–enrichment due to star formation in matter either from WFRMS and/or from WMAGB is a better scenario to explain globally the chemical anomalies in GC stars, it remains to be understood whether mixing plays any additional role. The possibility of enhanced, faster and deeper mixing, has not been neglected as an additional mechanism during the RGB evolution: e.g. Denissenkov & VandenBerg (2003) have proposed that in some upper RGB stars canonical extra mixing may become deeper, driven by the differential rotation of the stellar radiative zones due, e.g., to spinning up of close binary members as a result of tidal synchronization (Denissenkov et al. 2006a). In addition, Denissenkov et al. (2006b) proposed enhanced extra mixing to explain the Fluorine abundance variations in the red giants of the cluster M4.
In the following we will assume that indeed a non canonical extra mixing is efficient only in most helium rich fraction of cluster stars, and we model its effect on the surface abundances. This combination of a primordial and deep mixing scenario has been invoked by Denissenkov et al. (1998) to explain the magnesium vs. aluminum anticorrelation in GC red giants, and we follow their line of reasoning, although we will devote to another study the comparison of the magnesium and aluminum abundances, and discuss here only the sodium and oxygen abundance behaviour. Therefore, we will assume that the initial abundances of the evolving giants are consistent with the chemistry obtained either in the WFRMS or in the WMAGBs. In order to have a precise choice for the computation of the models described below, we adopt the chemistry of the ejecta of a 5 star according to our AGB models (Ventura & D’Antona, 2006), but we assume the high helium abundance which would result from a higher mass (Y=0.4).
3.1 Models for non canonical extramixing
The models are computed by making use of the ATON code, described in its latest version in Ventura & D’Antona 2005a; 2005b. We compute standard models, in which mixing is purely due to convection, and no kind of overshooting is allowed below the external convective region. A description of these models is given in Appendix A. Here we describe the models with extra mixing, which refer to M=0.64 with initial helium mass fraction Y=0.4, and metallicity in mass fraction Z=0.002. The helium abundance is selected following our reasoning which links the extra mixing to the initially very high helium abundance both as a consequence of observations (Section 2) and of the interpretation of the RGB evolution as a function of Y (Appendix A). As we will justify in the Appendix, we do not link the occurrence of extra mixing to a particular stage of evolution along the RGB, but we consider different initial stages, from luminosities at the beginning of the RGB evolution, up to luminosities larger than those of the (very mild) RGB bump for the chosen Y. The mass 0.64 is chosen as representative of a mass presently evolving in a typical GC (age of Gyr) for Y=0.40 and Z=0.002.
Some model results are listed in Table 2 and 3. At this stage, we do not aim to understand what is the specific mechanism for extra mixing, but only which are the consequences for the surface abundances of the giants presently evolving in GCs. We adopt the description by Denissenkov & VandenBerg (2003), and assume those depths and rates of extra-mixing, below the formally convective region, necessary to obtain sensible changes of the surface abundance of oxygen. Values of T 0.05 – 0.06 and Dmix cm are adopted. We also followed an evolution by considering the mass loss by stellar wind. Table 2 lists in the first column an identification sequential number and the phase of evolution is represented. Sequence 1 (‘st’) is the sequence computed without extra mixing, while ‘f’ means that we provide the abundances at the end of the computed sequence, corresponding to the onset of the helium flash. In the ‘ml’ sequence 5 of Table 2, mass loss is included in the computation, according to the description by Reimers’:
| (1) |
where L, R and M are respectively the stellar luminosity, radius and mass in solar units and is the free parameter. In this case we take =0.29.
The third column lists the initial model at which extra mixing starts, beginning from the sequence with no extra mixing. The luminosity, Teff and helium core mass corresponding to the model numbers are listed in Table 4. The following columns provide the logarithm of abundance of the listed elements, with respect to the standard solar–scaled abundances. The values at model 1 of the standard sequence 1 do not change along the evolution, so these element abundances also represent the starting abundances of the other sequences.
| N | logL/L⊙ | log Teff | M(H)/M⊙ |
|---|---|---|---|
| 500 | 0.567 | 3.752 | 0.099 |
| 600 | 0.909 | 3.727 | 0.165 |
| 900 | 1.604 | 3.692 | 0.234 |
| 1050 | 1.797 | 3.681 | 0.253 |
| 1500 | 2.147 | 3.660 | 0.291 |
| 2000 | 2.427 | 3.641 | 0.319 |
4 Chemical stratification inside the RGs and the effect of the initial chemistry
The effect of deep mixing depends on the profiles established within the star for the elements into consideration. These profiles depend on the one side on the temperatures reached within the inner layers during the evolution, and on the other side on the initial abundances of these same elements and of those which produce them. For the elements which are our main concern now, in particular, oxygen and sodium, in fact, we wish to study the effect of deep extra mixing starting from the initial mixture that comes out from the evolution of a 5 of metal abundance in mass fraction Z=2, according to the models described in Ventura & D’Antona (2006), These abundances are listed in the first line of Tables 2 and 3. In particular, Oxygen is already depleted by -0.508 dex with respect to its initial abundance ([O/Fe]=0.3)444The choice of an initial abundance [O/Fe] may be confusing, as we have stated that abundances as low as [O/Fe] may be achieved in massive AGB models. We preferred to use “directly” the abundances coming out from a precise stellar evolution, namely that of the 5, as we have not yet completed the study of the evolution of more massive models which have the maximum oxygen depletion (Ventura and D’Antona 2007, in preparation)., Sodium is already enhanced by +0.54dex, and 22Ne is depleted by -1.37dex.
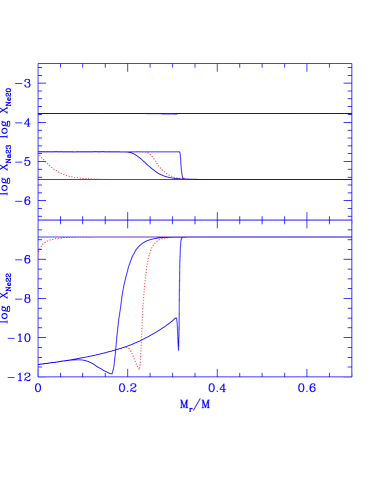
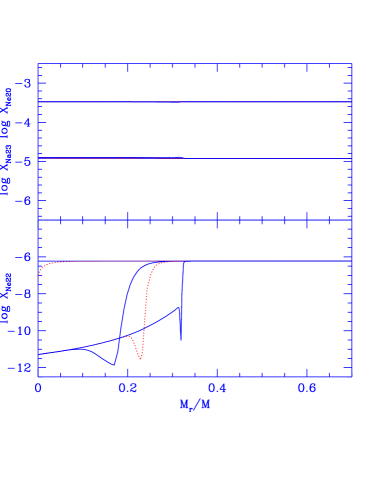
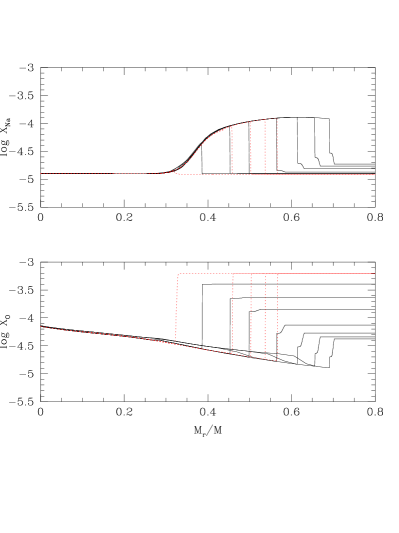
These initial abundances have an obvious but subtle effect on the result of extra mixing. In particular, let us first consider the 22Ne and 23Na abundances. Let us consider models starting from solar scaled abundances: The 22Ne abundance is initially almost 4 times larger than the 23Na. There is ample space for 22Ne to be burned inside the giant and establish a large gradient of 23Na across the burning shell, even at relatively low luminosities. We show in the left side of Figure 2 the formation of this sodium gradient at several stages during the standard giant evolution of a 0.64 having solar scaled initial abundances of these two elements. The advancing shell burning shifts to larger fractionary masses the formation of high sodium and the burning of 22Ne by proton captures. But in the AGB envelopes which we assume to be progenitors of the giants which suffer extra mixing, already a great fraction of 22Ne had been converted to 23Na by HBB. Therefore, during the first phases of RGB evolution, no further 23Na is produced, and no sodium profile is established in the star, contrary to the case of abundances in solar ratios (right side of Figure 2). It is only later on during the RGB evolution, when the shell temperature is higher, that 23Na is again produced at the expenses of the burning of a very small fraction of the abundant 20Ne. This is shown in the top of Figure 3: sodium enhancement at the border of the burning shell can be obtained only when the core mass becomes larger than 0.3, that is at high luminosity. In this figure the dotted lines represent the sodium (top) and oxygen (bottom) profiles in the standard model evolution. The abscissa, as usual, is the fractionary mass. The location of the abundance gradients corresponds to the core mass (and therefore luminosity –see Table 4) achieved at each model. We see that, while sodium is produced and oxygen depleted inside the star, nothing happens to the surface abundances if there is no extra mixing. The continuous lines show the evolution of the chemical profiles into some models of sequence 4 of Table 2. We see that oxygen begins to be depleted at much smaller core masses (luminosities) than those at which some effect on the increase of sodium begin to occur. Notice that we have started from an already depleted oxygen abundance: if we had started from solar scaled –or, better for standard population II, enhanced– oxygen, the dilution effect would have been much larger. In fact, in the classic interpretation of abundance anomalies by deep mixing, starting from standard initial abundances is possible to interpret the whole sodium vs. oxygen anticorrelation in term of deep mixing (see, e.g., Weiss et al., 2000, their figure 9).
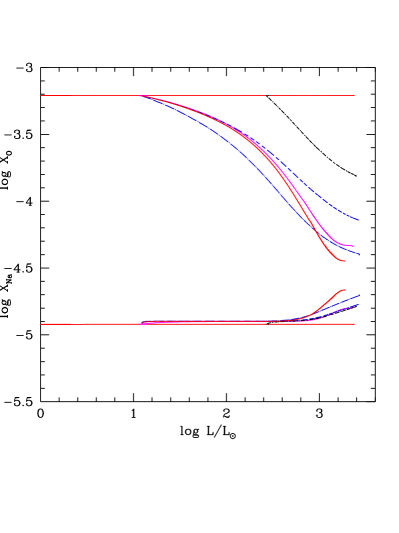
The fact that the effect of extramixing is more important for the oxygen depletion than for the sodium increase is very clear by looking at Figure 4, which shows the abundances of oxygen and sodium vs. the stellar luminosity, for the extra mixing models detailed in Table 2. One of these results (model 4) is shown in the right side of Figure 1. We see then that in fact the very low oxygen abundance of M13 giants can be consistent with an in situ extra mixing starting at non extreme abundance anomalies ([O/Fe]–0.4, [Na/Fe]+0.5) provided by the massive AGB models.


4.1 The Fluorine abundance
Fluorine is already depleted by a factor 10 by HBB in the 5 evolution from which we take the initial abundances. This depletion is consistent with the data by Smith et al. (2005) for the giants of M4. This cluster should not be as extreme as M13 or NGC 2808 which we are considering here, so the F vs. Na anticorrelation should be a result of the primordial abundance variations, which are predicted by our models. Nevertheless, Denissenkov et al. (2006b) point out that Smith et al. (2005) data also show an average decrease of the fluorine and carbon abundance for increasing luminosities of the M4 giants, and attribute the anticorrelation to extra mixing, explored with models similar to those we are presenting here. In our models with extra mixing, fluorine is in fact heavily depleted, especially in the models having the largest diffusion coefficient. Figure 5 shows the fluorine vs. oxygen anticorrelation and allows a prediction: in the most extreme giants of M13 and NGC 2808, having the lowest oxygen abundance which we attribute to extra mixing, the fluorine abundance must be more or less reduced depending on the fastness of extra mixing. Table 3 shows in fact that the diffusion coefficient is an important ingredient to achieve strong depletions (see the comparison between models 4 and 5 or the comparison between models 6 and 7).
| N | Nin | logT | Y |
|---|---|---|---|
| 1 st | 1 | 0 | 0.404 |
| 2 f | 600 | 0.13 | 0.424 |
| 3 f | 600 | 0.05 | 0.464 |
| 4 f | 600 | 0.06 | 0.450 |
| 5 ml | 600 | 0.06 | 0.482 |
| 6 f | 2000 | 0.06 | 0.422 |
5 The final helium abundance in the envelope
Extra mixing affects the envelope helium abundance (Weiss et al., 2000). In our case, the envelope abundance is already a high Y=0.4, and it increases up to Y=0.48 in the most “realistic” sequence, computed with mass loss. We do not explore further this problem here, but mention that some of our models also showed higher envelope helium abundances. This fact has important consequences for the location of these models on the following Horizontal Branch phases. The very hot HB stars at TK can not be explained by standard HB models, even with very low hydrogen envelope on top. Sweigart (1997) suggested that a late helium flash along the white dwarf cooling sequence can penetrate the small entropy barrier of the weakly burning hydrogen-burning shell (Iben 1976), so that helium and carbon would come to the surface, and hotter Teff’s can be achieved. We see in the models with extramixing that, maybe, the very high envelope Y is a result of deep mixing in giants which already from the beginning have a high helium abundance, and suggest that the existence of a hot blue tail in the HB may be linked to the extremely high helium abundances in the envelope, a combined result of the initially already high helium and of deep extra mixing. The evolution of these stars will be described in a subsequent paper (Caloi et al. 2007, in preparation).
6 Conclusions
The chemical anomalies in GCs include both oxygen depletion and helium enrichment. While there is no totally accepted model for the site of nucleosynthesis which affected the matter from which the anomalous stars were formed, it is accepted that helium enrichment will go together with oxygen depletion. Helium enhancements up to Y0.4, as seen in a few main sequences of GCs, may result from models, while the same models are easily consistent with the depletion of oxygen down to [O/Fe]–0.4 shown by most GCs. The models on the contrary have serious difficulties with the much larger depletions which are seen in some giants in M13, or may be inferred by the spectral analysis of the giants in NGC 2808.
In this work we remark that the evolution along the red giant branch (RGB) for stars having Y0.4 is noticeably different from the evolution of normal red giants with Y: in particular, both the milder external convection penetration, and the higher initial helium abundance in the envelope conspire to produce a smaller discontinuity in molecular weight along the evolution (in particular, the standard ”red giant bump”, occurring when the hydrogen burning shell crosses the molecular weight discontinuity, is less prominent and occurs at a larger luminosity).
We suggest that only the stars having very high helium abundance (if they are indeed present in the GC) are subject to deep non standard extra–mixing below the formal convection zone, a mechanism which is not efficient in the presence of the molecular weight barrier. We propose that extra mixing may be efficient along the whole RGB evolution, if the helium content is large enough to minimize the molecular weight discontinuities, and attribute to it the occurrence of the extreme abundance anomalies which are present in a few GCs.
We model extra mixing then starting from already anomalous chemistry, and show that it affects mainly the oxygen –and not the sodium– abundance. We also predict a very strong depletion of Fluorine, and helium envelope abundances as high as Y0.48 in present models.
These results may serve to clarify the role of primordial self–enrichment in GCs, showing that self–enrichment should not necessarily explain also the most drastic chemical compositions found in some clusters.
Acknowledgments
We thank Vittoria Caloi, Raffaele Gratton and Thibaut Decressin for enlightening conversations.
References
- Bedin et al. (2004) Bedin, L. R., Piotto, G., Anderson, J., Cassisi, S., King, I. R., Momany, Y., & Carraro, G. 2004, ApJ Letters, 605, L125
- Bekki et al. (2007) Bekki, K., Campbell, S. W., Lattanzio, J. C., & Norris, J. E. 2007, ArXiv Astrophysics e-prints, arXiv:astro-ph/0702289
- Caloi & D’Antona (2007) Caloi, V. & D’Antona, F. 2007, A&A, 463, 949
- Carretta et al. (2006) Carretta, E., Bragaglia, A., Gratton, R. G., Leone, F., Recio-Blanco, A., & Lucatello, S. 2006, A&A, 450, 523
- Chanamé et al. (2005) Chanamé, J., Pinsonneault, M., & Terndrup, D. M. 2005, ApJ, 631, 540
- Charbonnel, Brown & Wallerstein (1998) Charbonnel, C., Brown, J. A., & Wallerstein, G. 1998, A&A, 332, 204
- Coc et al. (2004) Coc, A., Vangioni-Flam, E., Descouvemont, P., Adahchour, A., & Angulo, C. 2004, ApJ, 600, 544
- Cottrell & Da Costa ( 1981) Cottrell, P. L. & Da Costa, G. S. 1981, ApJ Letters, 245, L79
- D’Antona et al. (2002) D’Antona, F., Caloi, V., Montalbán, J., Ventura, P., & Gratton, R. 2002, A&A, 395, 69
- D’Antona & Caloi (2004) D’Antona, F. & Caloi, V. 2004, ApJ, 611, 871
- D’Antona et al. (2005) D’Antona, F., Bellazzini, M., Caloi, V., Fusi Pecci, F., Galleti, S., & Rood, R. T. 2005, ApJ, 631, 868
- D’Antona et al. (2006) D’Antona, F., Ventura, P., & Caloi, V. 2006, ArXiv Astrophysics e-prints, arXiv:astro-ph/0612654
- Decressin et al. (2006) Decressin, T., Meynet, G., Charbonnel, C., Prantzos, N., & Ekström, S. 2006, ArXiv Astrophysics e-prints, arXiv:astro-ph/0611379
- Denissenkov et al. (1998) Denissenkov, P. A., Da Costa, G. S., Norris, J. E., & Weiss, A. 1998, A&, 333, 926
- Denisenkov & Denisenkova (1990) Denisenkov, P. A., & Denisenkova, S. N. 1990, Soviet Astr. Lett., 16, 275
- Denissenkov & Herwig (2003) Denissenkov, P. A., & Herwig, F. 2003, ApJ, 590, L99
- Denissenkov & VandenBerg (2003) Denissenkov, P. A., & VandenBerg, D. A. 2003, ApJ, 593, 509
- Denissenkov & Weiss (2004) Denissenkov, P. A., & Weiss, A. 2004, ApJ, 603, 119
- Denissenkov et al. (2006a) Denissenkov, P. A., Chaboyer, B., & Li, K. 2006a, ApJ, 641, 1087
- Denissenkov et al. (2006b) Denissenkov, P. A., Pinsonneault, M., & Terndrup, D. M. 2006b, ApJ, 651, 438
- Eggleton et al. (2006) Eggleton, P. P., Dearborn, D. S. P., & Lattanzio, J. C. 2006, Science, 314, 1580
- Gratton et al. (2001) Gratton, R. G., Bonifacio, P., Bragaglia, A., et al. 2001, A&A, 369, 87
- Gratton et al. (2000) Gratton, R. G., Sneden, C., Carretta, E., & Bragaglia, A. 2000, A&A, 354, 169
- Grundahl et al. (2002) Grundahl, F., Briley, M., Nissen, P.E., & Feltzing, S. 2002, A&A, 385, L14
- Iben (1976) Iben, I., Jr. 1976, ApJ, 208, 165
- Ivans et al. (1999) Ivans, I.I., Sneden, C., Kraft, R.P., et al., 1999, AJ, 118, 1273
- Kopacki et al. (2003) Kopacki, G., Kołaczkowski, Z., & Pigulski, A. 2003, A&A, 398, 541
- Kraft et al. (1993) Kraft, R. P., Sneden, C., Langer, G. E., & Shetrone, M. D. 1993, AJ, 106, 1490
- Lee et al. (2005) Lee, Y.-W., et al. 2005, ApJ Letters, 621, L57
- Maeder & Meynet (2006) Maeder, A., & Meynet, G. 2006, A&A, 448, L37
- Norris (2004) Norris, J. E. 2004, ApJ Letters, 612, L25
- Norris & Da Costa (1995) Norris, J. E., & Da Costa, G. S. 1995, ApJ Letters, 441, L81
- Palacios et al. (2006) Palacios, A., Charbonnel, C., Talon, S., & Siess, L. 2006, A&A, 453, 261
- Pasquini et al. (2005) Pasquini, L., Bonifacio, P., Molaro, P., Francois, P., Spite, F., Gratton, R. G., Carretta, E., & Wolff, B. 2005, A&A, 441, 549
- Pilachowski et al. (1993) Pilachowski, C. A., Sneden, C., & Booth, J. 1993, ApJ, 407, 699
- Piotto et al. (2005) Piotto, G., et al. 2005, ApJ, 621, 777
- Piotto et al. (2007) Piotto, G., et al. 2007, ArXiv Astrophysics e-prints, arXiv:astro-ph/0703767
- Prantzos & Charbonnel (2006) Prantzos, N., & Charbonnel, C. 2006, astro-ph/0606112
- Riello et al. (2003) Riello, M., Cassisi, S., Piotto, G., Recio-Blanco, A., De Angeli, F., Salaris, M., Pietrinferni, A., Bono, G., & Zoccali, M. 2003, A&A, 410, 553
- Salaris et al. (2006) Salaris, M., Weiss, A., Ferguson, J. W., & Fusilier, D. J. 2006, ApJ, 645, 1131
- Shetrone (2003) Shetrone, M. D. 2003, ApJ, 585, L45
- Smith et al. (2005) Smith, V. V., Cunha, K., Ivans, I. I., Lattanzio, J. C., Campbell, S., & Hinkle, K. H. 2005, ApJ, 633, 392
- Sneden (1991) Sneden, C. 1991, IAU Symp. 145: Evolution of Stars: the Photospheric Abundance Connection, 145, 235
- Sneden et al. (2004) Sneden, C., Kraft, R. P., Guhathakurta, P., Peterson, R. C., & Fulbright, J. P. 2004, AJ, 127, 2162
- Sweigart (1997) Sweigart, A. V. 1997, in Proc. Third Conference on Faint Blue Stars, ed. A. G. D. Philip, J. Liebert, R. Saffer, & D. S. Hayes (Schenectady: L. Davis Press), 3
- Sweigart & Mengel (1979) Sweigart, A. V., & Mengel, J. G. 1979, ApJ, 229, 624
- Ventura et al. (2001) Ventura, P., D’Antona, F., Mazzitelli, I., & Gratton, R. 2001, ApJ Letters, 550, L65
- Ventura et al. (2002) Ventura, P., D’Antona, F., & Mazzitelli, I. 2002, A&A, 393, 215
- Ventura & D’Antona (2005a) Ventura, P., & D’Antona, F. 2005a, A&A, 431, 279
- Ventura & D’Antona (2005b) Ventura, P., & D’Antona, F. 2005b, A&A, 439, 1075
- Ventura & D’Antona (2005c) Ventura, P., & D’Antona, F. 2005c, ApJ, 635, L149
- Ventura & D’Antona (2006) Ventura, P., & D’Antona, F. 2006, A&A, 457, 995
- Weiss et al. (2000) Weiss, A., Denissenkov, P. A., & Charbonnel, C. 2000, A&A, 356, 181
- Welty (1985) Welty, D. E. 1985, AJ, 90, 2555
- Zoccali et al. (1999) Zoccali, M., Cassisi, S., Piotto, G., Bono, G., & Salaris, M. 1999, ApJ, 518, L49
Appendix A Modelling the evolution of helium rich models along the RGB
We describe here the evolution of three masses having different helium content: Y=0.24 for M=0.8, Y=0.35 for M=0.7and Y=0.4 for Y=0.4, and a metallicity in mass fraction Z=0.002. The masses are chosen as representative of masses presently evolving in GC (age of Gyr). We compute standard models, in which mixing is purely due to convection, and no kind of overshooting is allowed below the external convective region. We show in Fig.6 the hydrogen abundance along the RGB evolution of The corresponding HR diagram is shown in Fig.7.
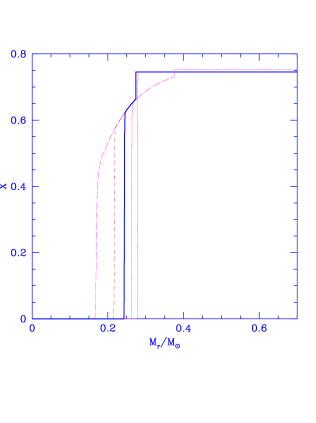
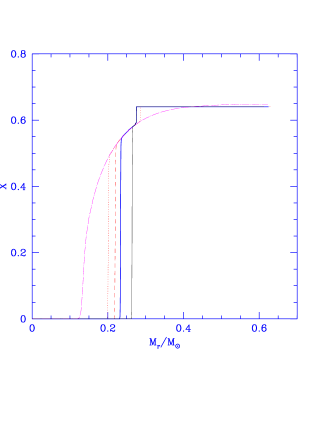
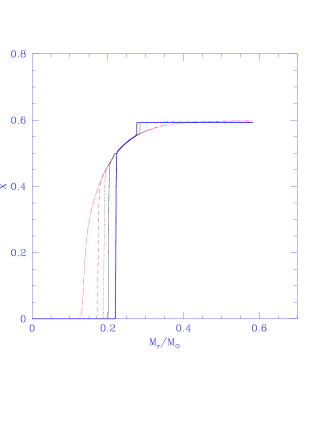

Fig.6 shows that the deepening of convection in the Y=0.24 model soon produces a molecular weight discontinuity in the stellar envelope. The discontinuity reaches a maximum at a mass fraction Mr/, due to the maximum extension of convection at the so called “first dredge up”. Also a model above the RG bump, when the burning shell has crossed the molecular weight discontinuity, is shown. We see from the central and right figure that the discontinuity is less prominent for the Y=0.35 and Y=0.40 models, and especially that it is not at all present during the first phases of evolution along the RGB. The location of the discontinuity is at about the same mass point (Mr/) for the three cases. We show in Fig.7 the HR diagram of the three tracks and the location at which the shell crosses the discontinuity. For the Y=0.35 and Y=0.4 cases the effect on the luminosity evolution is barely seen in the tracks, and does not produce any appreciable effect on the luminosity function, as we can understand by looking at the time evolution of the luminosity, shown in Fig.8. As a byproduct, notice that this result shows that we can not infer the existence of groups of stars very much enriched in initial helium content from the effect on the RGB bump.

Coming back to the paradigm of the extra–mixing in the RGB evolution, we hypothesize that the extreme helium rich models may not be able to avoid extra–mixing along the RGB, and also that extra mixing may not necessarily begin above the bump luminosity, as there is no or a very small discontinuity which can prevent it.