The Discovery of a Persistent Quasi-Periodic Oscillation in the Intermediate Polar TX Col
Abstract
We report on the detection of an 5900 s quasi-periodic variation in the extensive photometry of TX Col spanning 12 years. We discuss five different models to explain this period. We favour a mechanism where the quasi-periodic variation results from the beating of the Keplerian frequency of the ‘blobs’ orbiting in the outer accretion disc with the spin frequency, and from modulated accretion of these ‘blobs’ taking place in a shocked region near the disc/magnetosphere boundary.
keywords:
accretion discs, outburst, binary - stars: cataclysmic variables.1 Introduction
TX Col was first discovered as an X-ray source (1H0542-407) in the HEAO-1 all-sky survey. X-ray (EXOSAT) and optical observations (Tuohy et al., 1986; Buckley & Tuohy, 1989a) established this system as a new Intermediate Polar (IP), a subclass of magnetic cataclysmic variable stars (mCVs) where the white dwarf is in asynchronous rotation with the orbital motion of the system. A white dwarf rotation period of 1911 s and an orbital period of 5.7 hr were determined from a combination of radial velocity, X-ray and optical intensity modulations. TX Col showed very hard X-ray spectra (kT 10 keV), with the hard X-rays modulated strongly at the beat period (2106 s). The hard X-rays are thought to result due to a strong shock forming above the white dwarf surface where the accreted material is heated to high temperatures (108 K) (Norton et al., 1997) and are reflected and reprocessed in regions fixed in the binary frame (the bright spot or the secondary), producing the beat period.
Observed changes in the amplitude and power spectra of the optical light curves of TX Col over a long period of time (1989-2002), signifying variations in its accretion behaviour, have sparked a debate concerning the exact accretion mode in TX Col: whether or not accretion occurs via a disc, directly from the accretion stream or some combination of both (known as disc-overflow accretion; Norton et al. (1997)).
The detection by Tuohy et al. (1986) and Buckley & Tuohy (1989a) of the beat period in the photometry and X-rays was indicative of strong disc-overflow, stream-fed accretion or even reprocessing from regions that are fixed in the rotating frame of the binary.
Later optical photometry in 1989 (Buckley & Sullivan 1992) showed a persistent periodicity at 1054 s, exactly half the previously observed beat period of 2106 s. This 1054-s harmonic was not seen in the previously published photometry and was attributed to reprocessing of X-rays from both magnetic poles in regions fixed in the orbital phase. This could also be due to direct or overflowing stream of material flipping between the two magnetic poles of the white dwarf.
Further optical photometry of TX Col was obtained at the South African Astronomical Observatory (SAAO), Cerro Tololo Inter-American Observatory (CTIO) and the Mt. John University Observatory (MJUO) in 1994 (Buckley, 1994), which no longer showed either the beat period or its harmonic, but instead revealed a strong period near 6000 s and other quasi-periodic light variations at similar low frequencies.
| Observing | Place | HJD (Start) | Exp. | Length |
|---|---|---|---|---|
| Date | 2450000+ | Time (s) | (h) | |
| 02 Jan 02 | CBA: Pakuranga | 2276.8955 | 35 | 6.7 |
| 05 Jan 02 | CBA: Perth | 2280.0609 | 54 | 4.1 |
| 06 Jan 02 | CBA: Pakuranga | 2280.8871 | 35 | 3.9 |
| 10 Jan 02 | CBA: Perth | 2285.0623 | 54 | 5.6 |
| 10 Jan 02 | CBA: Perth | 2286.0304 | 54 | 3.2 |
| 15 Jan 02 | SAAO | 2290.4031 | 20 | 5.0 |
| 16 Jan 02 | CBA: Pakuranga | 2290.8856 | 35 | 6.3 |
| 16 Jan 02 | SAAO | 2291.3113 | 20 | 3.3 |
| 18 Jan 02 | SAAO | 2293.2848 | 20 | 8.0 |
| 19 Jan 02 | CBA: Perth | 2294.0340 | 54 | 6.4 |
| 19 Jan 02 | SAAO | 2294.2872 | 20 | 8.0 |
| 20 Jan 02 | CBA: Pakuranga | 2294.8728 | 35 | 7.1 |
| 20 Jan 02 | CBA: Perth | 2295.0630 | 54 | 5.7 |
| 20 Jan 02 | SAAO | 2295.2811 | 20 | 8.2 |
| 21 Jan 02 | SAAO | 2296.3296 | 20 | 6.7 |
| 22 Jan 02 | CBA: Pakuranga | 2296.8773 | 35 | 7.1 |
| 22 Jan 02 | SAAO | 2297.3502 | 20 | 6.0 |
| 23 Jan 02 | CBA: Nelson | 2297.8740 | 35 | 5.9 |
| 23 Jan 02 | CBA: Pakuranga | 297.9040 | 35 | 1.7 |
| 23 Jan 02 | SAAO | 2298.2809 | 20 | 5.0 |
| 25 Jan 02 | SAAO | 2299.2905 | 20 | 4.3 |
| 26 Jan 02 | SAAO | 2301.4193 | 20 | 4.4 |
| 27 Jan 02 | CBA: Perth | 2302.0760 | 54 | 4.9 |
| 27 Jan 02 | SAAO | 2302.2681 | 20 | 8.1 |
| 28 Jan 02 | New Zealand | 2302.8933 | 35 | 3.7 |
| 29 Jan 02 | CBA: Pakuranga | 2303.8625 | 35 | 6.9 |
| 29 Jan 02 | CBA: Nelson | 2303.8877 | 35 | 5.5 |
| 29 Jan 02 | SAAO | 2304.2765 | 20 | 7.6 |
| 30 Jan 02 | CBA: Nelson | 2304.8810 | 35 | 7.4 |
| 31 Jan 02 | CBA: Perth | 2306.0758 | 54 | 4.6 |
| 31 Jan 02 | SAAO | 2306.2631 | 20 | 4.8 |
| 01 Feb 02 | CBA: Perth | 2307.0115 | 54 | 5.7 |
| 01 Feb 02 | SAAO | 2307.2613 | 20 | 7.8 |
| 02 Feb 02 | SAAO | 2308.2611 | 20 | 7.8 |
| 03 Feb 02 | CBA: Nelson | 2308.9022 | 40 | 5.3 |
| 03 Feb 02 | SAAO | 2309.2672 | 20 | 6.7 |
| 04 Feb 02 | SAAO | 2310.2608 | 20 | 7.8 |
| 06 Feb 02 | CBA: Nelson | 2311.8649 | 40 | 6.3 |
| Observ. | Place | HJD (Start) | Exp. | Length |
|---|---|---|---|---|
| Date | 2440000+ | time (s) | (h) | |
| 26 Nov 89 | SAAO | 7857.2898 | 10 | 7.2 |
| 28 Nov 89 | MJUO | 7858.9643 | 10 | 4.3 |
| 29 Nov 89 | MJUO | 7859.9037 | 10 | 4.9 |
| 18 Jan 90 | SAAO | 7910.3101 | 10 | 1.2 |
| 19 Jan 90 | SAAO | 7911.3036 | 10 | 1.8 |
| 16 Sep 90 | SAAO | 8150.5609 | 5 | 2.2 |
| 21 Sep 90 | SAAO | 8156.4647 | 10 | 4.3 |
| 09 Nov 90 | SAAO | 8205.3513 | 10 | 6.0 |
| 12 Nov 90 | SAAO | 8208.3624 | 10 | 5.7 |
| 20 Nov 90 | SAAO | 8216.4194 | 20 | 4.2 |
| 18 Dec 90 | SAAO | 8244.3007 | 10 | 7.0 |
| 19 Dec 90 | SAAO | 8245.3192 | 10 | 6.6 |
| 20 Dec 90 | SAAO | 8246.2972 | 10 | 7.0 |
| 21 Dec 90 | SAAO | 8247.2986 | 10 | 6.7 |
| 22 Dec 90 | SAAO | 8248.2979 | 10 | 7.1 |
| 23 Dec 90 | SAAO | 8249.2983 | 10 | 7.2 |
| 24 Dec 90 | SAAO | 8250.3812 | 10 | 1.0 |
| 24 Dec 90 | SAAO | 8250.4514 | 10 | 3.5 |
| 10 Apr 91 | SAAO | 8357.2506 | 10 | 3.4 |
| 12 Apr 91 | SAAO | 8359.2727 | 10 | 3.0 |
| 13 Apr 91 | SAAO | 8360.2279 | 10 | 2.5 |
| 18 Apr 91 | SAAO | 8365.2443 | 10 | 2.4 |
| 31 Oct 91 | SAAO | 8561.3939 | 10 | 3.3 |
| 01 Nov 91 | SAAO | 8562.3618 | 10 | 5.9 |
| 02 Nov 91 | SAAO | 8563.3508 | 10 | 6.4 |
| 03 Nov 91 | SAAO | 8564.3396 | 10 | 6.2 |
| 04 Nov 91 | SAAO | 8565.3481 | 10 | 6.4 |
| 05 Nov 91 | SAAO | 8566.3897 | 10 | 3.2 |
| 08 Nov 91 | SAAO | 8569.4055 | 10 | 4.5 |
| 09 Nov 91 | SAAO | 8570.3421 | 10 | 4.0 |
| 11 Nov 91 | SAAO | 8572.3390 | 10 | 4.0 |
| 09 Dec 91 | SAAO | 8599.9170 | 10 | 5.6 |
| 10 Dec 91 | SAAO | 8600.9501 | 10 | 4.7 |
| 10 Jan 94 | MJUO | 9363.0505 | 5 | 2.2 |
| 11 Jan 94 | MJUO | 9363.9155 | 5 | 5.7 |
| 11 Jan 94 | SAAO | 9364.3142 | 5 | 5.2 |
| 12 Jan 94 | MJUO | 9364.9178 | 5 | 4.2 |
| 13 Jan 94 | SAAO | 9366.3508 | 5 | 5.2 |
| 14 Jan 94 | SAAO | 9367.3141 | 5 | 3.8 |
| 14 Jan 94 | SAAO | 9367.4797 | 5 | 1.3 |
| 15 Jan 94 | SAAO | 9368.3107 | 5 | 6.1 |
| 15 Jan 94 | CTIO | 9367.5792 | 10 | 2.1 |
| 16 Jan 94 | MJUO | 9368.9178 | 5 | 3.9 |
| 16 Jan 94 | CTIO | 9368.5783 | 10 | 2.4 |
| 16 Jan 94 | SAAO | 9369.2957 | 5 | 5.4 |
| 17 Jan 94 | CTIO | 9369.5518 | 10 | 2.2 |
| 17 Jan 94 | SAAO | 9370.3225 | 5 | 5.0 |
| 18 Jan 94 | CTIO | 9370.5740 | 10 | 1.4 |
Our 2002 observations reported here, together with those obtained by the CBA (Center for Backyard Astrophysics), show that TX Col power spectra were dominated by high-amplitude quasi-periodic light variations in 2002. A prominent quasi-periodic oscillation (QPO) period at 5900 s (170 Hz) was detected, the same period as detected in the data of 1990 and 1994.
The purpose of this study is to investigate the origin/cause of this oscillation. We start by presenting the photometry of TX Col in Section 2, and in Section 3 we analyse the entire data set, i.e. our 2002 data and the archival data from 1989 to 1994. The analysis of the QPO period is done in Section 4 and in Section 6 we discuss and interpret the results.
2 Photometric Observations
The optical photometry of TX Col was obtained at SAAO in January 2002 using the 1.0-m telescope at Sutherland with UCT CCD photometer in frame-transfer mode using B and I filters. Additional photometry was obtained by the CBA group nearly at the same period. The archival data obtained from SAAO, MJUO and CTIO, from 1989 - 1994, were retrieved and analysed alongside the CBA and our 2002 photometry. No filters were used for the CBA and the archival data.
The photometry was grouped and analysed in three sections: the SAAO and CBA data sets combined (hereafter the 2002 combined photometry), the 1989, 1990, 1991 and 1994 data sets combined (hereafter the archival photometry) and the 2002 combined data together with the archival photometry combined (hereafter the 1989-2002 combined photometry).
2.1 The 2002 Combined Data Reduction
For the SAAO observations the integration times were 20 s. Sky flatfields were taken at twilight throughout the observation week. The observation period was nearly three weeks and 6349 B-band images in total were taken. The data were reduced using the Dophot program (Mateo & Schechter, 1989).


The CBA photometry was acquired during the period 02 January - 06 February 2002 spanning the entire SAAO campaign. CBA observers in Australia (Perth) and New Zealand (Pakuranga and Nelson) participated in the 2002 campaign. A 0.35-m Schmidt-Cassegrain telescope with an SBIG (Santa Barbara Instruments Group) ST6 CCD camera (CBA: Nelson), Meade LX200 10” f/10 with an SBIG ST7e CCD camera (CBA: Pakuranga) and 10” f6.3 LX200 SBIG ST7 CCD camera (CBA: Perth) were used.

Table 1 shows the observation logs.
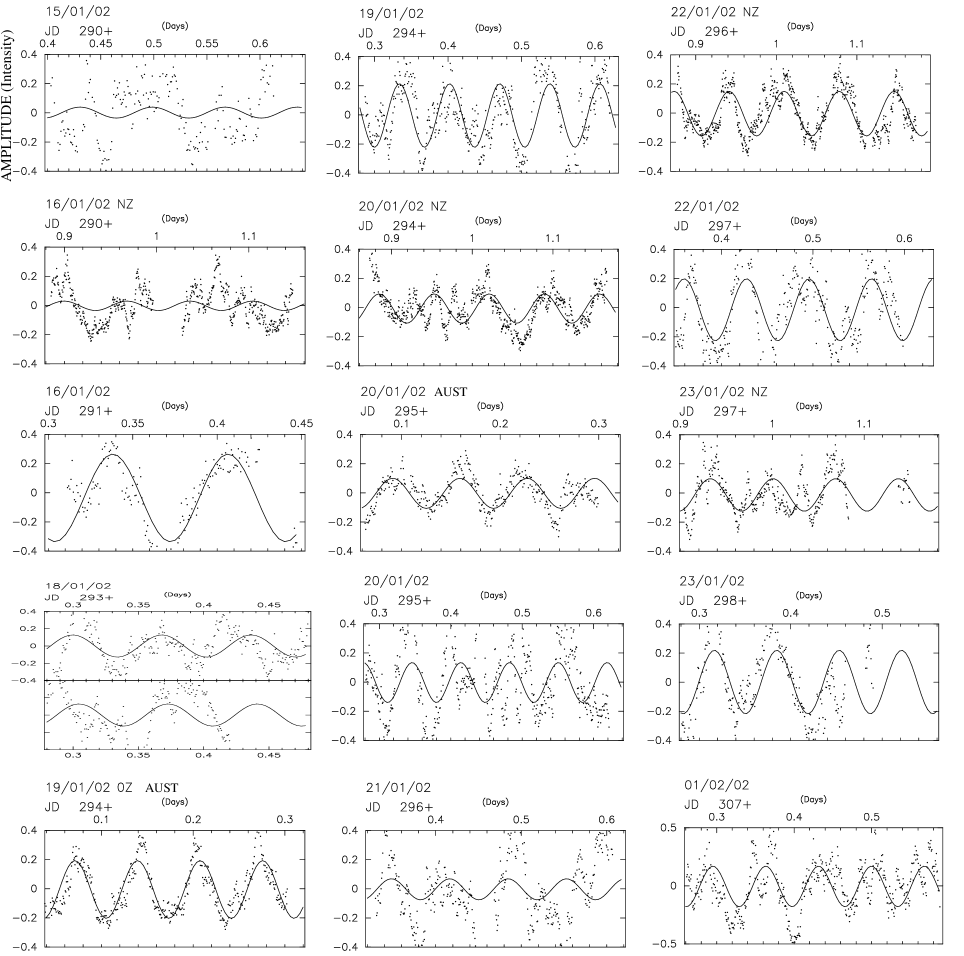
The CBA and the SAAO photometry were combined before the analyses. Before analysis of the two data sets, all the data were converted from magnitude scale into relative intensity scale and the mean for each set subtracted and used to normalise. This was done because the data were obtained from different instruments in different scales. A sample of the normalised light curves of the 2002 combined photometry are shown in Figure 1. The SAAO data show excursions (large variations in amplitude) which are not seen in the CBA data. They are possibly due to the effect of the filter.
2.2 The Archival Data and The 1989-2002 Combined Photometry
The white-light archival photometry obtained in November 1989; January, September, November and December 1990; April, November and December 1991 and in January 1994 at the SAAO, MJUO and CTIO was also analysed. The SAAO 0.75 and 1.0-m telescopes were used with the UCT photometer employing a photomultiplier. For the MJUO observations a two channel photomultiplier photometer attached to the McClellan1.0-m telescopes was used. Table 2 shows the observations.
3 Period Analysis
Discrete Fourier Transforms (DFTs) were produced (Kurtz, 1985) to reveal the periodicities in the data. The results are displayed in Figure 2 for the 2002 combined photometry. The spin and the beat frequencies are detected at Hz and Hz, respectively.
| Date | Place | Amplitude | Phase of Max. |
|---|---|---|---|
| (2002) | (Norm. Intensity) | (cycles) | |
| 15 Jan. | SAAO | ||
| 16 Jan. | CBA (NZ) | ||
| 16 Jan. | SAAO | ||
| 18 Jan. | SAAO | ||
| 19 Jan. | CBA (Aust.) | ||
| 19 Jan. | SAAO | ||
| 20 Jan. | CBA (NZ) | ||
| 20 Jan. | CBA (Aust.) | ||
| 20 Jan. | SAAO | ||
| 21 Jan. | SAAO | ||
| 22 Jan. | CBA (NZ) | ||
| 22 Jan. | SAAO | ||
| 23 Jan. | CBA (NZ) | ||
| 23 Jan. | SAAO |
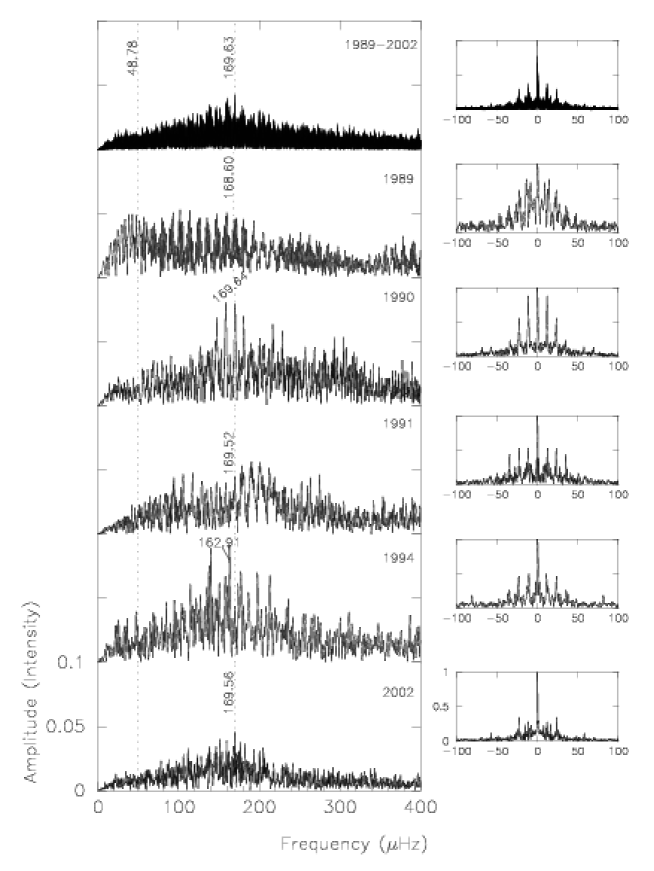
More accurate values of the beat, the harmonic of the beat and the spin frequencies of TX Col were determined from the 1989-2002 combined photometry. Values of Hz (2106.13444 0.00040 s), Hz (1909.90974 0.00036 s) and 2( Hz (1053.24356 0.00002 s) were measured. It should be noted that the errors quoted above are formal estimates from DFTs after fitting by least-squares a sinusoid to the data, and therefore are optimistic. However, spectral windows show no cycle count ambiguity for the total DFT, suggesting that the periods are stable (this can be seen in Figure 4).
The 1989-2002 combined photometry, however, does not show any modulation at the orbital frequency, and the orbital frequency was determined by taking the difference between the spin and the beat frequencies and was found to be Hz (5.6943317 0.0000015 h). The orbital period and the spin period were used to derive the orbital and the spin radial velocity ephemerides, respectively (Mhlahlo et al., 2007c) (hereafter Paper II).
4 Quasi-Periodic Oscillations
The 2002 combined photometry (Figure 2, upper panel) shows high-amplitude QPOs with a dominant QPO frequency appearing at 170 Hz.
To check if this QPO peak was due to noise, the data were subjected to a Fisher Randomisation test (Fisher, 1935). This involves the construction of an artificial dataset of the same mean and the same standard deviation as the original, and the random swapping of the y-data values while the x-data values are kept the same. The y-values are randomly moved so that they are associated with different x-points. Periodograms of the swapped data are then computed (10 000 times in this case) and the height of the resulting noise peaks in the 10 000 periodograms compared with that of the peaks in the original periodogram. Any peak in the original periodogram with a height less than that in the swapped data is most likely a noise peak and is rejected. The lower the number of periodograms with higher peaks, the better. This means that the probability that the peak under examination is a noise peak is , where is the number of periodograms with higher peaks. Strictly speaking, this is not a confidence level. This method is nonparametric in a sense that it does not rely on a model specified in terms of a set of unknown parameters. It just gives an indication of the believability of the peak. After this exercise it was found that the QPO was likely not due to noise.
The data were fitted at the QPO frequency on consecutive nights and the results are displayed in Table 3 and in Figure 3. As can be seen in Table 3, the phase of peak maximum of the 170 Hz QPO frequency shifts from one night to the next, relative to the first data point of the night of 16 Jan 02 which was chosen as the zero point (since those data possibly have the highest amplitude), confirming that this period is quasi-periodic. However, the DFTs of the archival data show that the QPO period is also present in the 1990 photometry (Figure 4), and perhaps in the 1994 data, and this suggests that this period is stable on a long timescale and is a QPO that persistently reappears due to some physical/geometrical changes and/or characteristic of TX Col. The QPO period is also present in the 1989-2002 combined photometry and has the highest amplitude in this dataset (Figure 4). The QPO frequency was measured from the DFT of the 1989-2002 combined data, and a value of 169.630206 0.000047 Hz (5895.17648 0.00163 s) was obtained.
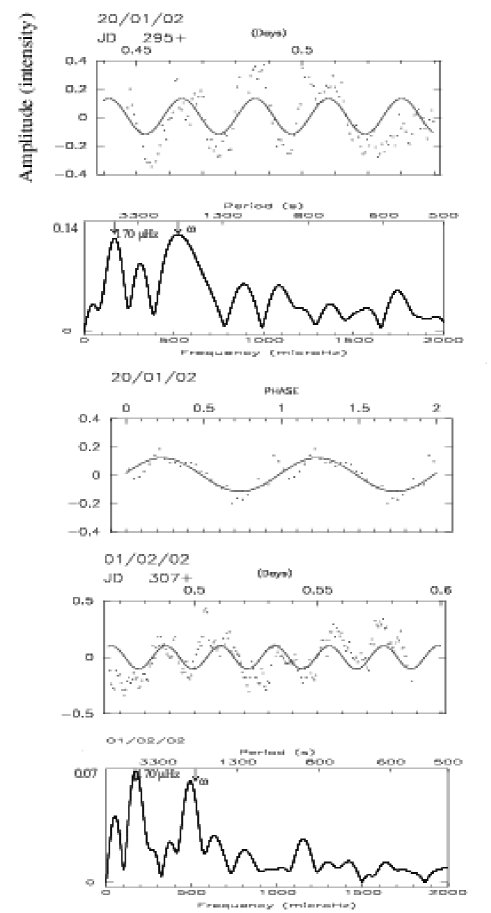

The light curve of 20 Jan 02 (SAAO) (see Figure 3, middle column of panels, fourth panel from the top) shows an interesting behaviour; excursions or a change in frequency between JD=2452295.44 - 2452295.54 where in one QPO cycle approximately three shorter oscillations, on the timescale of the spin or beat period, are observed. The light curve of 01 Feb 02 (between JD=2452307.46 - 2452295.6) shows a nearly similar effect. The data within the above-mentioned JD ranges are strongly modulated near the spin frequency (see first and fourth panels in Figure 5) and the DFTs show a peak near the spin frequency (second and last panels in Figure 5).
5 Spin Variations
The data of 20 Jan and 01 Feb falling within the HJD ranges mentioned above, were phase-folded on the radial velocity spin ephemeris which is derived in Paper II using a spin period determined from the 1989-2002 photometry (Section 3). We phased our spectroscopy such that maximum redshift appears at . The data shows maximum intensity near phase (middle panel in Figure 5). The data of the 01 Feb 02 (not shown) also showed maximum intensity near phase . Figure 6 shows the 2002 combined photometry phase-folded on the radial velocity spin ephemeris (see above). Maximum intensity is seen at phase .
6 Discussion and Interpretation
Optical beat modulations are thought to result from reprocessing of X-rays in regions that are fixed in the orbital frame of reference such as the front face of the secondary and/or the bright spot (Patterson, 1981; Hassall et al., 1981; Wickramasinghe et al., 1982). The reprocessing model has been used by Buckley & Tuohy (1989b) to explain the optical beat frequency observed in TX Col.
The disc-overflow model, where beat modulations result from the interaction between the stream of material from the secondary rotating with the binary frame at , and the magnetosphere spinning with , after the stream has hit and overflowed the outer edge of the disc, has been used successfully as an alternative model to explain X-ray beat pulses. It is generally accepted that disc-overflow accretion will result in the simultaneous existence of the beat and the spin pulses in the data, having comparable amplitudes (Hellier, 1998; Norton et al., 1997). These pulses have been observed in the X-rays of TX Col, which establishes disc-overflow as one of the modes of accretion. Our optical data of 2002 has shown a dominant modulation at the beat period and another modulation at the spin period. The spin and the sideband (beat period) is not always detected in TX Col, which is interesting. This is possibly a result of disc-overflow and will be discussed in detail in Paper II.
In addition to the beat and spin modulations, TX Col amplitude spectra are dominated by high-amplitude QPOs.
We investigate five different models to explain the QPO periodicity.
(1) A successful model for QPOs and dwarf nova oscillations (DNOs) was proposed by Warner & Woudt (2002) where QPOs are caused by slow-moving prograde waves at the inner edge of the disc. Warner et al. (2003) showed that many observations in CVs and X-ray binaries obey the relation . This model explained the QPOs observed in the IP GK Per, where (Hellier & Livio, 1994). However, TX Col does not obey this relation since and so this model cannot be applied as it is to this system.
(2) Retter et al. (2004) reported evidence for large superhumps in TX Col, at 7.1 h (positive superhump) and at 5.2 h (negative superhump), in addition to the orbital period. These periods are understood as resulting from beating of the orbital period and the apsidal or modal precession of the disc. Their observations of TX Col taken between December 2002 and February 2003, about a year after our campaign, showed large-amplitude QPOs. A possibility, therefore, is that the interaction between the superhump frequency and the Keplerian frequency of the material at the outer disc produces a new frequency - the QPO. Using the orbital parameters of TX Col we find that the Keplerian period of the material at the outer disc edge is
| (1) |
for any reasonable values of between 400-600 km s-1 ( km s-1 - ∘) and of the outer disc radius
The white dwarf mass range between M M⊙ (Ramsay, 2000; Suleimanov et al., 2005) is considered here.
gives QPO periods that we observe in the data (6000 s) for values of near 5000 s. This would imply a smaller disc, though.
The presence of the 7.1 h period is deemed unlikely, whereas that of the 5.2 h is possible but not conclusive (Tansel AK;private communication). Our extensive data do not show evidence for these superhump periods.
(3) The theoretical analysis of King (1993) and Wynn & King (1995) suggested that the flow of matter in IPs can take the form of diamagnetic ’blobs’ that orbit about the white dwarf. Hellier (2002a) argued that, following the theory of King (1993) and Wynn & King (1995), TX Col can be explained as having a combination of a stream and orbiting blobs. A similar suggestion was put forward for GK Per where it was thought that QPOs result due to vertically extended ’blobs’ orbiting within the inner accretion disc edge and providing modulated reprocessing of, or illumination by, the white dwarf (Morales-Rueda et al., 1996).
We find that the Keplerian period of the material at the inner disc edge is s, for any white dwarf mass between M M⊙ and inner disc radius,
These periods are inconsistent with the QPO time-scales of s observed in our data. Therefore theories where the QPO is a beat between the spin frequency and the frequency of material orbiting the white dwarf at the inner edge of the disc or where the QPO results from reprocessing off blobs or bulge orbiting at the inner edge of the disc (Watson et al., 1985) are not supported by our observations for TX Col.
(4) However, the beat of the spin period with the Keplerian period at the outer disc i.e.
gives s which we observe in our data, for values of in the lower range near 3000 s (Equation 1) and for reasonable values of km s-1 (Buckley & Tuohy, 1989a) and km s-1). Though this model seems to give the expected result, it alone does not explain why the QPO variation has a higher amplitude (compared to the beat and the spin periods).
(5) Therefore we suggest that in addition to there being ‘blobs’ at the outer edge of the disc from which white dwarf emission is reprocessed to give rise to QPO frequency, there is modulated accretion occuring at the magnetosphere/disc boundary that gives rise to the same QPO frequency.
Spruit & Taam (1993) showed that conditions at the inner edge of the disc can cause variations of the magnetosphere boundary and that material can accumulate outside the magnetosphere. Spruit & Taam (1993) pointed out that their model could be applied to IPs to explain the QPO phenomena seen in these systems. This model was used recently by Mhlahlo et al. (2007b) to describe the outburst of EX Hya.
Our results have shown that maximum intensity of the continuum light occurs at spin phase , when the narrowing ‘neck’ of the accretion curtain is nearly facing the observer (Paper II). Since the continuum light curves are dominated by the QPOs, it follows that most of the QPO emission comes from this region, near the white dwarf. The spin modulation appearing in the QPO continuum light curves also shows maximum intensity near this phase (; Section 4), suggesting that continuum spin modulations also emanate from this region. The variable intensity and excursions in the QPO light curves (Figure 3) suggest that it is an accretion process that gives rise to the QPO emission. We proposed that it is near the above-mentioned region where the QPO modulations result, due to accretion.
Between JD=2452295.44 - 2452295.54 and JD=2452307.46 - 2452295.6) there are possibly no ‘blobs’ that are picked up by the accretion curtains and accreted via the Spruit and Taam mechanism by the white dwarf. This results in the observed spin modulated emission in the QPO continuum light curves.
We suggest that the material that forms a ‘base excursion’ (Paper II; see also Hellier et al. (1989); Mhlahlo et al. (2007b)) due to overflow stream falling near the magnetosphere/disc boundary, and the ‘blobs’ that drift from the outer disc towards this same shocked region, pile up near this region and are dumped onto the surface of the white dwarf via a mechanism similar to that of Spruit and Taam before the field lines snap to produce a prograde travelling wave (or ‘wall’) of Warner & Woudt (2002).
The critical density required to push the magnetosphere inward for the accretion of the accumulated ‘blobs’ to take place is possibly reached quicker in TX Col than in EX Hya, resulting in the frequent accretion of the ‘blobs’ and in the production of the QPOs that we observe in the data. This could explain why we do not see outbursts in TX Col.
The viscous time scale at the corotation radius, rco, predicted by the Spruit & Taam (1993) model can roughly be estimated to be s (Spruit & Taam, 1993), where and assuming the viscosity parameter is (Shakura & Shunyaev, 1973). These time scales are inconsistent with the observed QPO time scales. However, at Rout where we suggest there are orbiting ‘blobs’, s. The latter time scales are consistent with the QPO time scales. This could suggest that there is evolution of ‘blobs’ from Rout toward the magnetosphere.
This could also suggest that TX Col has extended accretion curtains where material is accreted from a ring near the Roche lobe, a similar situation as in EX Hya (King & Wynn, 1999; Belle et al., 2002; Norton et al., 2004; Mhlahlo et al., 2007a). In this geometry the QPO period would result due to the ‘blobs’ orbiting in the ring of material being swept up by the magnetic field lines. This would occur when an orbiting ‘blob’ is on the side facing the magnetic field lines. This is unlikely, though, given the ratio of TX Col. Also, such a behaviour can be confirmed by the detection of a spin period modulated at radial velocities near those of the outer ring material due to corotation of outer ring material with the accretion curtain (Mhlahlo et al., 2007a).
7 Summary
The photometry of TX Col has been dominated by QPOs but no interpretation for their origin had been provided before. A 5900 s QPO period is detected in the 1990, 1994 and 2002 photometry and we interprete it as follows: the QPO period results due to the beating of the Keplerian period of the orbiting ‘blobs’ with the spin period and from the storage and release of ‘blobs’ near the magnetosphere, where the stored material is rapidly accreted by the white dwarf.
Acknowledgments
NM would like to acknowledge financial support from the Sainsbury/Linsbury Fellowship Trust and the University of Cape Town. NM would also like to thank D. O’Donoghue and Tom Marsh for the use of their programs, Eagle and Molly, respectively.
References
- Belle et al. (2002) Belle, K., Howell S. B., Sirk, M., Huber, M.E., 2002, ApJ, 577, 359
- Buckley & Tuohy (1989a) Buckley, D. A. H., Tuohy, I. R. 1989a, ApJ, 344, 376
- Buckley & Tuohy (1989b) Buckley, D. A. H., Tuohy, I. R., 1989b, Accretion-Powered Compact Binaries, Proceedings of the 11th North American Workshop on Cataclysmic Variables and Low Mass X-Ray Binaries, Santa Fe October 9-13. Edited by Christopher W. Mauche. Cambridge: Cambridge University Press, 1990, 231
- Buckley & Sullivan (1992) Buckley, D. A. H. & Sullivan, D. J. 1992, Via Del Mar Workshop on Cataclysmic Variable Stars, ed. by Nikolaus Vogt, ASP Conference Series, 29, 387
- Buckley (1994) Buckley, D. A. H. 1994, Cataclysmic Variables and Related Objects, A. Evans and J.H. Wood (eds.), 185
- Fisher (1935) Fisher, R. A., The design of Experiments, 1935, New York: Hafner.
- Hassall et al. (1981) Hassall, B.J.M., 1981, MNRAS, 197, 275
- Hellier et al. (1989) Hellier, C., Mason, K., Smale, A. P., Corbet, R. H. D., O’Donogue, D., Barrett, P. E., & Warner, B., 1989, MNRAS, 238, 1107
- Hellier & Livio (1994) Hellier, C., Livio, M., 1994, ApJ, 424, 57
- Hellier (1998) Hellier, C., 1998, New Astr. Rev., 22, issue 7, 973
- Hellier (2002a) Hellier, C., 2002, The physics of Cataclysmic Variables and Related Objects, ASP Conference Series, Vol 261, Edited by B. T. Gänsicke, K. Beuermann, and K. Reinsch., San Francisco: Astronomical Society of the Pacific, 92
- King (1993) King, A., 1993, MNRAS, 261, 144
- King & Wynn (1999) King, A. & Wynn, D. W., 1999, MNRAS, 310, 203
- Kurtz (1985) Kurtz, D. W., 1985, MNRAS, 213, 773
- Mateo & Schechter (1989) Mateo, M. & Schechter. P. L., in Grosbol P. J., Murtagh F., Warmaels R. ., eds, ESO Conf. Workshop Proc. No. 31, 1st ESO/ST-ECF Data Analysis Workshop, ESO, Garching, p.69
- Mhlahlo et al. (2007a) Mhlahlo, N., Buckley, D.A.H., Dhillon, V., Potter, S. B., Warner, B. & Woudt, P., 2007a, University of Cape Town, eprint arXiv:astro-ph/0704.0017
- Mhlahlo et al. (2007b) Mhlahlo, N., Buckley, D.A.H., Dhillon, V., Potter, S. B., Warner, B. & Woudt, P., 2007b, University of Cape Town, MN submitted.
- Mhlahlo et al. (2007c) Mhlahlo, N., Buckley, D.A.H., Dhillon, V., Potter, S. B., Warner, B.,Woudt, P., 2007c, in preparation.
- Morales-Rueda et al. (1996) Morales-Rueda, L., Still, M. D., Roche, P., 1996, MNRAS, 283, L58-L62.
- Norton et al. (1997) Norton, A., Hellier, C., Beardmore A. P., Wheatley, P. J., Osborne, J. P., Taylor, P., 1997, MNRAS, 289, 362
- Norton et al. (2004) Norton, A., Wynn, A., & Somerscales, C., 2004, ApJ, 614, 349
- Patterson (1981) Patterson, J., Price, C.M., 1981, ApJ, 243, L83
- Ramsay (2000) Ramsay, G. 2000, MNRAS, 314, 403
- Retter et al. (2004) Retter, A., Liu, A., Bos, M., White dwarfs: cosmological and galactic probes. Edited by Edward M. Sion, St phane; Vennes and Harry L. Shipman. Astrophysics and Space Science Library, Vol. 332. Dordrecht: Springer, ISBN 1-4020-3693-0, ISBN 978-1-4020-3693-4, ISBN 1-4020-3725-2 (e-book), 2005, p. 251
- Spruit & Taam (1993) Spruit, H. C., Taam, R. E., 1993, ApJ., 402, 593
- Shakura & Shunyaev (1973) Shakura, N.I. & Shunyaev, R.A, 1973, A&A, 24, 337
- Suleimanov et al. (2005) Suleimanov, V., Revnivtsev, M., Ritter, H., 2005, A&A., 435, 191
- Tuohy et al. (1986) Tuohy, I. R. et al., 1986, ApJ, 311, 275
- Warner & Woudt (2002) Warner, B., Woudt, P., 2002, MNRAS, 335, 84
- Warner et al. (2003) Warner, B., Woudt, P., Pretorius M. L., 2003, MNRAS, 344, 1193
- Watson et al. (1985) Watson, M. G., King, A. R., Osborne, J., 1985, MNRAS, 212, 917
- Wickramasinghe et al. (1982) Wickramasinghe, D. T., Stobie, R.S. & Bassell, M.S., 1982, MNRAS, 200, 605
- Wynn & King (1995) Wynn, G. A., King, A., 1995, MNRAS, 275, 9