Atmospheric dynamics of Pegasi planets
Abstract
We present three-dimensional numerical simulations of the atmospheric dynamics of close-orbiting planets such as HD209458b. Our simulations show that winds of several and day-night temperature differences reaching 500– are possible at and above the photosphere. The circulation takes the form of a broad superrotating (eastward) equatorial jet. At 0.1–bar, the superrotation blows the hottest regions of the atmosphere downwind by of longitude, but at lower pressures the temperature pattern tracks the stellar illumination. We predict factors of several variation in the infrared flux received at Earth throughout an orbital cycle; if the photosphere is deep enough (50–100 mbar pressure), the peak infrared emission should lead the time of secondary eclipse by 10 hours or more. Dynamics plays a key role in shaping the spectrum, clouds, chemistry, and long-term planetary evolution.
Department of Planetary Sciences, Lunar and Planetary Laboratory, University of Arizona, Tucson, AZ 85721 [showman@lpl.arizona.edu, curtis@lpl.arizona.edu]
The past few years have witnessed many observations constraining the physical properties of extrasolar giant planets with orbital radii less than 0.1 AU (the “Pegasi planets” or hot Jupiters). Eight such planets have been discovered to undergo transits. Two such planets, HD209458b and TrES-1, have also been detected in thermal emission during the secondary eclipse, and several useful upper limits on composition, albedo, and thermal emission at various wavelengths have been achieved. This trend of detections is likely to continue.
A knowledge of atmospheric dynamics will be crucial for understanding these new observations. First, the interaction of dynamics with radiative transfer controls the temperature structure, which shapes the infrared spectrum and lightcurve. Most current radiative-transfer models adopt radiative-equilibrium conditions and make arbitrary assumptions about whether the absorbed stellar flux gets redistributed across the planet or heats only the dayside; however, dynamics can push the atmosphere far from radiative equilibrium, and the extent of heat redistribution must be calculated explicitly (and may depend strongly on height). Second, whether clouds exist depends on the temperatures and locations of ascent/descent, which is again controlled by the circulation. Cloudiness in turn determines the albedo, visible lightcurves, and — if high-altitude clouds form — causes masking of spectral lines. Third, circulation may lead to disequilibrium between CO and CH4, remove condensable species (Na2S, CaTiO3) via nightside cold trapping, and cause other chemical effects. Fourth, the atmospheric heat engine produces enormous kinetic energy, which, if transported deep enough, may affect the interior evolution. This has been suggested as a possible mechanism for producing the large radius of HD209458b, for example (Guillot and Showman 2002, Showman and Guillot 2002).
The intense starlight incident upon the surface of Pegasi planets leads to a deep radiative zone extending from the top of the atmosphere to pressures of bars (e.g., Guillot et al. 1996, Guillot and Showman 2002, Burrows et al. 2003, Chabrier et al. 2004), and any observable weather occurs in this radiative zone. The fast spindown times for Pegasi planets implies that these planets should be in near-synchronous rotation (3.5 days for HD209458b)(Guillot et al. 1996, Showman and Guillot 2002). This rotation rate implies that rotation is important but not dominating: for winds, the Rossby number is . These estimates imply dynamical length scales (the Rossby deformation radius and Rhines length) of order a planetary radius. As a result, any jets and gyres that exist should be global in scale. This contrasts with the case of Jupiter, where these length scales are only –10% of the planetary radius and — as a result — the dominant jets and vortices are much smaller than a planetary radius. Pegasi planets should therefore have physical appearances that differ greatly from Jupiter and Saturn.
Here we describe our recent work on the atmospheric circulation of Pegasi planets; the presentation describes and extends Cooper and Showman (2005), to which we refer the reader for details. We performed global, three-dimensional numerical fluid simulations using the ARIES/GEOS dynamical core (Suarez and Takacs 1995) in a domain extending from mbar—kbar. The simulations adopted the primitive equations, which are a simplified form of the Navier-Stokes equations valid for statically stable atmospheres that are vertically thin compared to their horizontal extent. We used parameters for HD209458b and assumed that the planetary interior is in synchronous rotation with the orbital period. The nominal resolution is in longitude and latitude with 40 vertical levels. In the simulations, the dynamics are driven solely by the imposed day-night heating contrast. Rather than solving the radiative transfer explicity, we adopted a thermodynamic heating rate (in ) of , where is the specified radiative-equilibrium temperature profile (hot on the dayside and cold on the nightside), is the actual temperature, and is the radiative-equilibrium timescale (a function of pressure). The vertical structure of and were taken from Iro et al. (2005); the day-night difference in was a free parameter that we varied from from 100—1000 K.
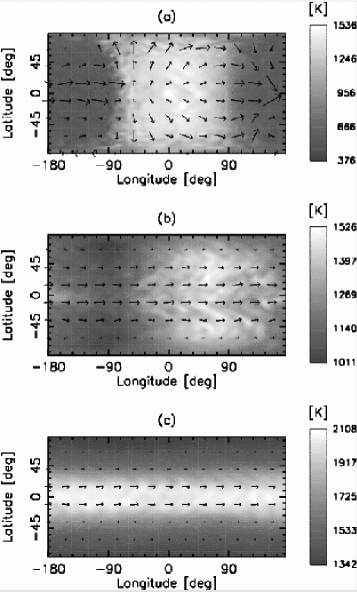
Figure 1 shows the temperature (greyscale) and winds (arrows) for three layers (2 mbar, 200 mbar, and 20 bars from top to bottom, respectively) after a simulated time of 5000 Earth days. The imposed heating contrast leads to winds exceeding several . By 5000 days the simulation has approximately reached a statistical steady state at pressures less than 3 bars, although the winds continue to increase at deeper levels. At the top (2 mbar), the radiative time constant is hour (much less than the advection time), so the hot regions remain confined to the dayside. The temperatures are in near-radiative-equilibrium, with day-night temperature differences of . At 200 mbar, close to the expected photosphere if the planet lacks high-altitude clouds, a broad eastward superrotation develops. Here, the radiative time constant, , is comparable to the time needed to advect air across a planetary radius. The circulation therefore blows the hottest regions of the atmosphere downwind from the substellar point by degrees of longitude. Temperature differences reach at this level.
The development of a broad, superrotating (eastward) jet, with large day-night temperature differences at bar, is a robust feature in all our simulations. We performed a variety of simulations using radiative-equilibrium temperature profiles from Burrows et al. (2003), Chabrier et al. (2004), or Iro et al. (2005); and using radiative-equilibrium day-night temperature differences of 1000, 750, 500, 250, or . We even performed simulations whose initial condition contained a broad westward equatorial jet extending from bars to the top of the domain. All of these simulations developed strong eastward jets resembling that in Fig. 1. Furthermore, these results agree with Showman and Guillot (2002), who also obtained broad eastward jets in every one of their simulations using a different numerical code. This gives us confidence that eastward flow is a robust result, at least within the context of our adopted input parameters. What all these simulations have in common are short radiative time constants at pressures bar, which allow the development of longitudinal temperature variations that are essentially a large-amplitude thermal tide. We speculate that, as has been suggested for Venus, this tide induces the superrotation by pumping eddy energy and eastward momentum upward and equatorward. (In absence of such eddy effects, the equatorial flow would be westward.)
Our results differ from the one-layer shallow-water calculations of Cho et al. (2003), which produce westward equatorial flow. However, shallow-water turbulence invariably produces westward flow even for planets such as Jupiter and Saturn whose equatorial jets are eastward (e.g., Cho and Polvani 1996, Iacono et al. 1999; see Vasavada and Showman 2005 for a review). This feature seems to result from the exclusion of three-dimensional processes in the shallow-water equations.
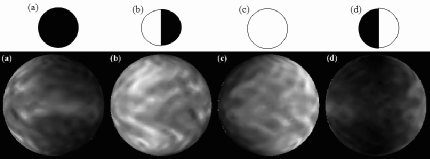
The patterns in Fig. 1 have implications for the infrared lightcurve of the planet throughout its orbit, as shown in Figs. 3 and 4. The globes in Fig. 3 (bottom row) show the infrared brightness at four phases assuming the planet emits as a blackbody from the 220 mbar level. The globes in the top row show the illumination as viewed from Earth during these same phases. The key point is that, in the absence of winds, the temperature pattern would follow the illumination (i.e., the infrared appearance would also correspond to the top row of globes). The differences between the idealized illumination patterns and the simulated brightness patterns result solely from atmospheric dynamics.
Figure 4 (left) shows the corresponding lightcurve assuming the photosphere is at the 220 mbar level, as might be expected for a cloud-free planet. Because the hot regions become offset from the substellar point at this pressure, the model predicts that the planet will radiate its maximum infared flux toward Earth hours before the secondary eclipse (rather than immediately around the time of secondary eclipse as would occur without winds). This effect could allow an observational determination of wind direction — if the winds are eastward, the peak fluxes would lead the eclipse, whereas if the winds are westward, peak fluxes would lag the eclipse.
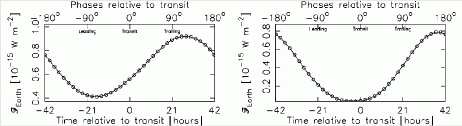
Nevertheless, uncertainties exist regarding the emission level. The lower-than-expected Na (Charbonneau et al. 2002) and null detection of CO (Deming et al. 2005, Richardson et al. 2003) on HD209458b could result from a high-altitude cloud at a few mbar pressure. If the cloud optical depth exceeds unity, then the primary infrared emission to space occurs from the cloud altitude rather than from the deeper levels expected for a cloud-free planet. Figure 4 (right) shows the lightcurve for the case of emission from the 10-mbar level. Because the radiative time constant is short at these pressures (Iro et al. 2005), the offset shown in Fig. 4 (left) has largely disappeared. The magnitude of the flux differences has increased from two-fold (Fig. 4, left) to eightfold (Fig. 4, right). Emission from such high altitudes would largely mask the signature of winds. It is possible that some planets have high-altitude clouds while others do not (HD209458b and TrES-1 may represent these cases; Fortney et al. 2005), so a range of infrared-lightcurve behaviors is to be expected among real planets.
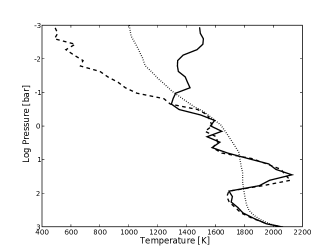
Dynamics can push the atmosphere far from radiative equilibrium, and this may have implications in explaining the existing Spitzer IRAC data at 4.5 and m for TrES-1 (Charbonneau et al. 2005). Current radiative-equilibrium models cannot easily explain the data: if they explain the m flux, then they do not predict enough flux at m (Fortney et al. 2005, Burrows et al. 2005, Seager et al. 2005, Barman et al. 2005). Part of the problem is that 8-m photons are emitted from higher altitude, where radiative-equilibrium models predict colder temperatures. One solution is to invoke a temperature inversion so that the emission region for 8-m photons is hotter than for 4.5-m photons. Fortney et al. (2005) accomplished this by adding an ad hoc heat source, which lead to an improved fit to the Spitzer data. A key point is that dynamics can naturally produce such a dayside temperature inversion, even when no such inversion would exist in radiative equilibrium (Fig. 5). The inversion occurs because of the upward-decreasing radiative time constant: as air columns superrotate from nightside to dayside, the air at the top warms much more rapidly than air at the bottom, producing an inversion. No ad hoc heat sources need be invoked.
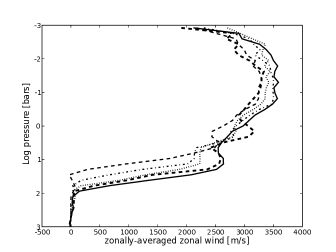
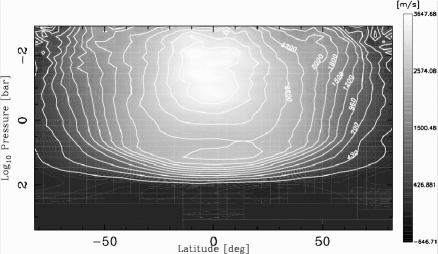
The large radius of HD209458b has remained a puzzle, particularly given that the other 7 known transiting planets have radii in agreement with evolution calculations (e.g., Guillot 2005). Showman and Guillot (2002) and Guillot and Showman (2002) suggested that mechanical energy produced by the atmospheric heat engine could be advected into the interior, where it could be dissipated and might provide a source of heat that would slow the contraction. In the current simulations, all of the heating/cooling (which is the sole energy source in the simulations) occurs at pressures bars. Nevertheless, the simulations gradually develop strong winds at pressures bars, which implies that kinetic energy is transported downward from the heated regions into the interior. Figure 6 shows the evolution of longitudinally averaged winds at the equator over time. The winds at pressures bar rapidly reach a quasi-steady equilibrium, but the winds from 10–100 bars increase throughout the simulation (this implies a large increase in total kinetic energy because that layer contains ten times more mass than the entire overlying atmosphere). The build-up of winds in Fig. 5 corresponds to a downward kinetic energy flux of , which is 10–100 times greater than the intrinsic flux predicted in evolution models (e.g., Guillot and Showman 2002, Burrows et al. 2003, Chabrier et al. 2004). More work is needed to determine the fate of this energy, but it suggests that atmospheric circulation could affect the long-term evolution.
-
Acknowledgements.
This work was supported by NSF grant AST-0307664 and NASA GSRP NGT5-50462.
References
Barman, T.S., Hauschildt, P.H., Allard, F. 2005, Astrphys. J., in press.
Burrows, A., Sudarsky, D., and Hubbard, W.B. 2003, Astrophys. J., 594, 545-551.
Burrows, A., Hubeny, I., and Sudarsky, D. 2005, Astrophys. J., 625, L135-L138.
Chabrier, G., Barman, T., Baraffe, I., Allard, F., and Hauschildt, P.H. 2004, Astrophys. J., 603, L53
Charbonneau, D., Brown, T.M., Noyes, R.W., and Gilliland, R.L. 2002, Astrophys. J., 568, 377-384.
Charbonneau, D. and 10 coauthors 2005, Astrophys. J., 626, 523-239.
Cho, J.Y-K. and Polvani, L.M. 1996, Science, 273, 335-337
Cho, J.Y-K., Menou, K., Hansen, B.M.S., and Seager, S. 2003, Astrphys. J., 587, L117-L120.
Cooper, C.S., Showman, A.P., 2005, Astrophys. J., 629, L45-L48.
Deming, D., Brown, T.M., Charbonneau, D., Harrington, J., and Richardson, L.J. 2005, Astrophys. J., 622, 1149-1159.
Fortney, J.J., Marley, M.S., Lodders, K., Saumon, D., and Freedman, R. 2005, Astrophys. J., 627, L69-L72.
Guillot, T., Burrows, A., Hubbard, W.B., Lunine, J.I., and Saumon, D. 1996, Astrophys. J., 459, L35-L38.
Guillot, T. and Showman, A.P. 2002, A&A, 385, 156-165.
Guillot, T. 2005, Ann. Rev. Earth Planet. Sci., 33, 493-530.
Iacono, R., Stuglia, M.V., Ronchi, C. 1999, Phys. Fluids, 11, 1272-1274.
Iro, N., Bézard, B., and Guillot, T. 2005, A&A, 436, 719-727.
Richardson, L.J., Deming, D., and Seager, S. 2003, Astrophys. J., 597, 581-589.
Seager, S., Richardson, L.J., Hansen, B.M.S., Menou, K., Cho, J.Y-K., and Deming, D. 2005, Astrophys. J., submitted.
Showman, A.P. and Guillot, T. 2002, A&A, 385, 166-180.
Vasavada, A.R. and Showman, A.P. 2005, Rep. Prog. Phys. 68, 1935-1996.