Multiwavelength study of massive galaxies at z .
II. Widespread Compton thick AGN and the concurrent growth
of black holes and bulges
Abstract
Approximately 20–30% of galaxies with detected with Spitzer MIPS at 24 m show excess mid-IR emission relative to that expected based on the rates of star formation measured from other multiwavelength data. These galaxies also display some near-IR excess in Spitzer IRAC data, with a spectral energy distribution peaking longward of 1.6m in the rest frame, indicating the presence of warm-dust emission usually absent in star forming galaxies. Stacking Chandra data for the mid-IR excess galaxies yields a significant hard X-ray detection at rest-frame energies 6.2 keV. The stacked X-ray spectrum rises steeply at keV, suggesting that these sources host Compton-thick Active Galactic Nuclei (AGNs) with column densities cm-2 and an average, unobscured X-ray luminosity – erg s-1. Their sky density ( deg-2) and space density ( Mpc-3) are twice those of X-ray detected AGNs at 2, and much larger than those of previously-known Compton thick sources at similar redshifts. The mid-IR excess galaxies are part of the long sought-after population of distant heavily obscured AGNs predicted by synthesis models of the X-ray background. The fraction of mid-IR excess objects increases with galaxy mass, reaching –60% for , an effect likely connected with downsizing in galaxy formation. The ratio of the inferred black hole growth rate from these Compton-thick sources to the global star formation rate at is similar to the mass ratio of black holes to stars in local spheroids, implying concurrent growth of both within the precursors of today’s massive galaxies.
Subject headings:
galaxies: evolution — galaxies: formation — galaxies: active — X-rays: galaxies1. Introduction
Active Galactic Nuclei (AGN) and galaxies are intimately connected. It is generally thought that virtually all nearby early type galaxies (and perhaps all relatively massive galaxies) contain a supermassive central black hole (BH), indicating that all massive galaxies may have experienced an AGN phase in their past (Kormendy & Richstone 1995; Magorrian et al. 1998). Moreover, remarkably tight correlations have now been unveiled between central supermassive BH and the mass or velocity dispersion of the bulge in their host galaxies (Ferrarese & Merritt 2000; Gebhardt et al. 2000), with typical mass ratio – (e.g., McLure & Dunlop 2001; Ferrarese et al 2006). This suggests but does not establish that AGN and star formation activity may have been concurrent. The origin of these correlations is in fact not entirely clear, and has been the subject of active debate during recent years. It appears to be connected to the positive feedback that the BH can exercise on its host galaxy, becoming effective if the BH exceeds some critical mass limit and thus luminosity (Silk & Rees 1998; di Matteo, Springel & Hernquist 2005; Springel, di Matteo & Hernquist 2005; Schawinski et al. 2006). If the energetic emission from accretion around the BH is large enough, the galaxy can be cleared out of its gas either via heating (e.g., Ciotti & Ostriker 1997; 2007) or accretion related outflows as in BAL quasars (e.g., Chartas et al. 2007), thereby preventing further gas accretion.
In order to probe BH growth in the distant universe efficient tracers of AGN activity are needed. Obtaining a complete census of active galaxies is complicated due to AGN obscuration by circumnuclear material. During the formation epochs of galaxies, it can be well expected that a greater abundance of gas and its chaotic motions due to merging and interactions cause the typical AGN obscuration to be much larger than locally. In that case, a substantial fraction of the cosmic BH growth history could be hidden from view and not yet taken into account. It is also currently unknown if the ”Unification Paradigm” describing the AGN phenomenon (e.g., Antonucci 1993; Urry & Padovani 1995) holds at high redshift, in particular if the ratio of obscured to unobscured AGNs (or, more accurately, the distribution of obscuring column densities) is the same as observed locally. More generally, the shape of the cosmic X-ray background, with its peak toward 30 keV (Marshall et al. 1980), suggests that much of the BH-accretion luminosity at substantial redshifts is obscured (e.g., Fabian & Iwasawa 1999).
The deepest X-ray surveys available to date, performed with the Chandra satellite in the Chandra Deep Field South (Giacconi et al. 2002; GOODS-South field, GOODS-S hereafter), Chandra Deep Field North (Alexander et al. 2003a; GOODS-North, GOODS-N hereafter), and with XMM-Newton (e.g., Hasinger 2004 in the Lockman hole) resolved most of the X-ray background at energies 0.5–6 keV, but a substantial fraction of the higher energy background remains unresolved (Krivonos et al. 2005; Worsley et al. 2005; 2006; Hickox & Markevitch 2007). Synthesis models have been built (Comastri et al. 1995; Gilli et al. 2001; 2007) showing that in order to account for the high energy X-ray background, where most of the accretion energy in the universe is being emitted, one has to postulate the existence of substantial populations of high redshift heavily obscured Compton thick AGNs (with column densities of cm-2). Such a population of Compton thick sources at high redshift still awaits discovery (e.g., Barger et al. 2007). Hard X-ray selection, the best means currently to find such sources at high redshift, is limited by telescope sensitivities and would allow one to find only the brightest sources and with non-extreme column densities (e.g., Brandt & Hasinger 2005). As an example, the archetype Compton thick AGN NGC 1068, with erg s-1, would have a hard X-ray (2–8 keV) flux of only erg s-1 cm-2 at , more than an order of magnitude fainter than that of sources detectable in the deepest (2 Ms) Chandra survey, in the GOODS-North field.
On the other hand, some of the energy absorbed by the obscuring material is reprocessed and re-emitted at longer wavelengths, providing the opportunity to detect these sources via their IR emission. For example, the nucleus of NGC 1068 would have a flux density of 25Jy at 24 m if placed at — very faint but still detectable in the ultradeep Spitzer MIPS imaging taken as part of GOODS. One of the primary goals of GOODS was indeed the discovery of previously unknown populations of distant AGNs (e.g., Treister et al. 2004) by combining the deepest multiwavelength imaging brought to bear upon these fields. Several recent studies have focused on finding distant obscured AGNs by means of mid-IR or far-IR selection, in GOODS and other deep Spitzer surveys. For example, selection by means of red IRAC (3.5–8m) colors were presented by Lacy et al. (2004), Stern et al. (2005), and similarly the selection by means of power-law spectral energy distributions (SEDs) over IRAC bands (Alonso Herrero et al. 2006; Donley et al. 2007) have provided AGN candidate samples with only partial overlap with X-ray selected sources.
The peak of QSO activity has been established to take place at (e.g., Schmidt 1968; Croom et al. 2004; Hasinger et al. 2005). Therefore, it is quite natural to look for the growth of BH in massive galaxies at the same epoch. Indeed, the massive galaxies selected at submillimeter wavelengths (SMGs) are undergoing star-formation activity and at the same time host luminous AGNs, just the signatures expected for joint stellar-BH growth (e.g., Alexander et al. 2005a,b; Borys et al. 2005). However, these sources are relatively rare and appear to represent the most strongly star-forming galaxies at these epochs (e.g., Chapman et al. 2005) and it is important to see if this joint growth is also occurring in more typical massive galaxies at .
This paper describes a source population serendipitously discovered while studying the multiwavelength emission properties of distant massive star forming galaxies in the GOODS fields, described in a companion paper (Daddi et al. 2007, Paper I hereafter). As discussed in Paper I, we have built galaxy samples free of detectable AGN activity. A sizable fraction shows distinct mid-IR excess with respect to that expected from star formation activity alone. This property of galaxies implies that the extremely efficient and penetrating 24 m photometry from Spitzer is not always a reliable estimator of the ongoing star formation rates (SFRs) in galaxies, especially in the case of sources with very bright mid-IR luminosities (particularly those encountered at in surveys shallower than GOODS). In this paper, we investigate the nature of these mid-IR excess sources in detail. Stacking in the X-ray bands with Chandra clearly unveils heavily obscured AGNs, in many cases (or perhaps most cases) with Compton thick central BHs, which might be responsible for the mid-IR excess. The 24 m photometry is therefore still extremely valuable also in the case of bright 24 m galaxies at , as it allows us to investigate this previously unidentified population of distant AGNs, relevant for the history of accretion onto super-massive BHs and their feedback on galaxy formation and evolution at a crucial epoch of massive galaxy formation.
The paper is organized as follows: in Section 2 we describe the mid-IR excess galaxy sample and summarize all relevant background work described in full detail in the companion paper (Paper I). Section 3 compares the mid-IR to UV estimated SFRs (i.e., the mid-IR excess) to a number of other observed galaxy properties and shows that a warm dust component in addition to the colder star formation component is present in these galaxies at near-IR to mid-IR rest-frame wavelengths. The X-ray stacking analysis, unveiling the presence of heavily obscured AGNs, are presented in Section 4, with the constraints on the absorbing gas column density suggesting that these sources are typically Compton thick. We discuss the implications of these results with regard to the obscured AGN fraction at high redshifts, the X-ray background, the coeval growth of BH and galaxies, and AGN duty cycle in Section 5; the possible relevance of these results for AGN feedback is discussed in Section 6. Future prospects for further developments in understanding this previously unknown population of AGNs are given in Section 7. Summary and conclusions are provided in Section 8. We quote stellar masses and star formation rates for the case of a Salpeter IMF from 0.1 and 100 , and we adopt a WMAP cosmology with , and [km s-1 Mpc-1] (Spergel et al. 2003). Unless explicitly stated otherwise, we quote magnitudes in the Vega scale.
2. The Sample
2.1. Galaxy selection and datasets
The dataset and galaxy samples used in this paper are fully described in Paper I. For completeness we provide the relevant information here. We have selected sources in the -band to completeness limits of in the GOODS-North and in the GOODS-South field, and then used the color selection technique of Daddi et al. (2004b) to identify a total of galaxies at . Accurate photometric redshifts () as well as a large number of spectroscopic redshifts have been used. We exclude from the analysis the small fraction of contaminant galaxies with or . Sources of spectroscopic redshifts are described in Paper I and include all available public datasets, plus currently unpublished redshifts from the ultradeep (15-30 hours per mask) spectroscopy of the GMASS survey (Kurk et al. 2007, in preparation). We have excluded AGN-hosting galaxies by eliminating from the sample (1) sources with a 2–8 keV band detection in the 1 Ms and 2 Ms Chandra Deep Field X-ray catalogs of Alexander et al. (2003a) for GOODS-S and N respectively, and (2) sources with power-law SEDs over Spitzer IRAC and MIPS, lacking a distinct decrease in the flux density () at wavelengths beyond m rest-frame, based on visual classification (eventually, this removes only 6 galaxies in total due to power-law SEDs that were not also detected in the hard X-ray band). We also excluded 10% of the galaxies in the sample because of source blending due to the low resolution (″) at IRAC wavelengths, which generally hampers measurement of accurate Spitzer MIPS 24 m flux densities as well.
The main aim of Paper I is to investigate the nature of star formation at high redshift and to identify the best mean to estimate the ongoing SFR activity. The work thus mostly focuses on star forming galaxies (as opposed to passive galaxies). All the multiwavelength star formation rate (SFR) indicators available in GOODS have been used. These include: (1) the deepest current Spitzer MIPS 24 m imaging (Chary et al. 2007, in preparation), reaching about 12Jy (3) in both fields; (2) the deepest current Spitzer MIPS 70 m imaging reaching about 1.8mJy in part of both GOODS fields (Frayer et al. 2006 and in preparation); (3) 160 hours of VLA 1.4 GHz data in GOODS-N with 4.7Jy of rms per beam (Morrison et al. 2007, in preparation); (4) 0.5–2 keV X-ray imaging from Chandra (used mainly in this paper, where we also discuss the AGN contamination that is needed for the interpretation of those data); (5) a deep 850 m map of GOODS-N (Pope et al. 2005); and (6) UV photometry from GOODS ground-based and HST imaging (Giavalisco et al. 2004). The way in which photometry at these various wavelengths is interpreted to measure SFR in galaxies, and the implied known limitations, are described in Section 3 of Paper I. The main results of Paper I, relevant to this work, are presented in Section 4 and 5 of that paper. In summary, we find that a fraction of the galaxies (generally those with the brightest mid-IR luminosities) have significant excess flux density in the mid-IR at 24 m, i.e. at rest-frame m, compared to the flux density expected on the basis of their ongoing star formation activity. A consistent mid-IR excess is also inferred from a comparison with radio, 70 m, UV, submm (Paper I) (and soft X-ray, as discussed later in this paper) derived SFRs. We also find that the SFRs estimated from the dust reddening-corrected UV luminosities compares fairly well with respect to all other available indicators.
The aim of this paper is therefore to carefully identify and study the population of sources with mid-IR excess. In order to work with meaningfully defined galaxy samples, being able to compute accurately SFRs from both mid-IR and from the UV, we limited in the following the analysis to 24 m detected sources with well defined UV slopes (i.e. those with an error in color less than 0.4 mag). This is required in order to obtain reasonable estimates of dust corrected UV SFR (), with a formal error in the reddening correction lower than a factor of .
We further excluded galaxies that appear to be quiescent, or have only a low level of star-formation activity. These sources are generally very red in the UV because of relatively old stellar populations affecting the colors, and not simply because of dust reddening. For such sources the dust extinction correction is expected to fail, leading to overestimated , so that the comparison of mid-IR based SFRs to UV ones is not feasible. Based on the Paper I finding of a tight correlation between SFR and stellar mass at redshift (as well known now to exist from to , Elbaz et al. 2007; Noeske et al. 2007), we excluded quiescent galaxies as those for which the specific star formation rate , where and is the median for 24 m detected galaxies in GOODS. This criterion also requires a 24 m detection.
2.2. Definition of mid-IR excess sources
Following the results from Paper I, we define here mid-IR excess sources as sources satisfying
| (1) |
Here is derived from the 24 m flux density at the measured spectroscopic or photometric redshift, and using the Chary & Elbaz (2001) templates, which are based on local mid- to far-IR correlations, with the addition of estimated from the directly observed UV luminosity (non-reprocessed light from star formation). The term is estimated from the UV after correcting for dust extinction based on the Calzetti et al. (2000) law (the average correction is a factor of for sources, Daddi et al. 2005b, and decrease to a factor of a few to the faintest limits). A galaxy can satisfy this mid-IR excess criterion either from overestimating the respect to , or from underestimating the latter relative to the former. The first case corresponds to a genuine excess flux density in the mid-IR; the second one can be due to dust obscuration exceeding the Calzetti law prediction (optically-thick UV emission). In Paper I it is shown that the second case is relevant at most for a small fraction of the sample (%), and therefore the vast majority (but not all) of mid-IR excess sources are overluminous, for some reason, at mid-IR wavelengths.
It is important to recall here that the luminosity dependent Chary & Elbaz (2001) templates that we adopt have been built on the basis of the local correlations in the mid-IR to far-IR for star forming galaxies. A mid-IR excess with respect to these SEDs is equivalent to a mid-IR excess with respect to the SED of standard star forming galaxies in the local universe. In any case, it should be clarified that this population of mid-IR excess galaxies is well defined independently of the class of SEDs used to interpret the mid-IR luminosities. As shown extensively in Paper I, galaxies at a given intrinsic or bolometric luminosity appear to display a wide range in their m). Therefore mid-IR excess galaxies can be also seen as galaxies with m) larger than the average of galaxies of a given SFR (or of local star forming galaxies with the same SFR). Deviations from the normal m) versus SFR relation are also observed in the local universe, and generally ascribed to the presence of an AGN (e.g., Genzel et al. 1998; Laurent et al. 2000; Dale et al. 2006; Armus et al. 2007).
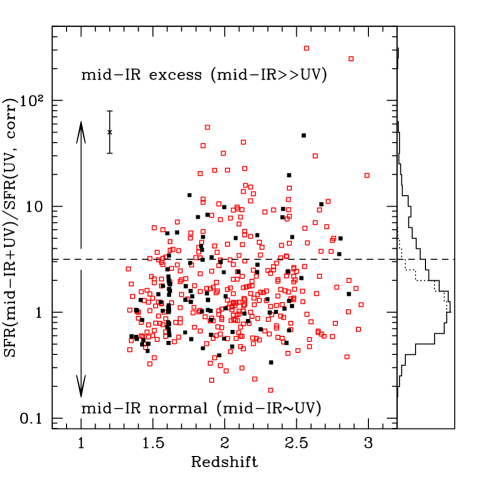
The threshold chosen in Eq. 1 (0.5 dex, about a factor of 3) is dictated by the evidence that, in the opposite direction to mid-IR excess galaxies, there are very few galaxies with in excess of more than a factor of 3 of (Fig.1). This suggests that samples of genuinely discrepant galaxies with too high ratios are to be found above a similar threshold, assuming that intrinsic scatter in the ratio is to first order symmetrical.111It is worthwhile to emphasize that, despite the large dust reddening corrections to , most sources in Fig. 1 cluster around a ratio of 1, and the Gaussian component in the distribution has a dispersion of only dex We will later show that this threshold is well defined also with respect to the X-ray properties of the samples.
Although the use of UV as the primary SFR indicator is less than optimal because of the possibility for substantial obscuration from thick lines of sight, it is the only one available for nearly all 24 m sources at in GOODS (the other SFR indicators being limited by sensitivity and applicable individually to only a fraction of the galaxies, e.g., 20% for radio).
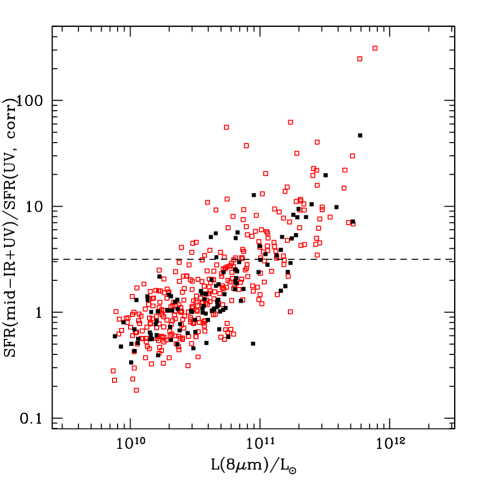
The combination of the requirements discussed in the previous section leaves us with a total sample of 430 (183) galaxies in the GOODS-S (GOODS-N) field, or about 50% of the primary sample. Of these, 106 (58) satisfy Eq. 1 and are therefore classified as mid-IR excess galaxies — representing 24.6% (31.7%) of the total sample. Likewise, robust spectroscopic redshifts are available for 108 (44) galaxies, or 25.1% (24.0%) of the total sample. Most of the mid-IR excess sources have very high m rest-frame luminosities, often in excess of (Fig.2), and the vast majority of galaxies in our sample having m) also shows a mid-IR excess. This is reminiscent of finding that most luminous IR galaxies in the local universe tend to be AGN dominated (e.g., Tran et al. 2001).
3. Mid-IR excess and other galaxy properties
With the aim of understanding the nature of the sources with mid-IR excess, and therefore the origin of this excess, we have searched for the existence of possible correlations of this excess with other galaxy properties.
3.1. UV slopes, redshift, morphology and colors
As shown in Fig. 13 of Paper I, the mid-IR excess does not strongly depend on the UV slope of the galaxies, and we therefore exclude that it is due to effects inherent in the correction for reddening of the UV luminosity. A possible origin of the excess could instead be mid-IR SED evolution with redshift, within the range populated by our sample. We have checked if mid-IR excess sources preferentially appear at some high or low redshift within the sample (Fig. 1). There is a tendency for sources to have low mid-IR to UV ratios. This could be due to 9.7m silicate absorption entering the 24 m Spitzer MIPS bandpass, or to an overestimation of the reddening correction at these lowest redshifts. There is also a tendency for sources with the strongest excess to be located at . However, the median ratio of mid-IR to UV based SFRs is fairly stable as a function of redshift, and no strong trend with redshift is detected. If we are seeing galaxies with anomalous mid-IR SEDs, compared to , they are rather homogeneously distributed in the probed redshift range.
We have performed Sersic index fitting using Galfit (Peng et al. 2002) to the ACS F850W band images of our sample of galaxies in GOODS-S. Results and full details will be presented in Ravindranath et al. (in preparation). Comparing the Sersic index and sizes distributions of mid-IR excess and normal galaxies, we do not find statistically significant differences for the full sample with in GOODS-S.
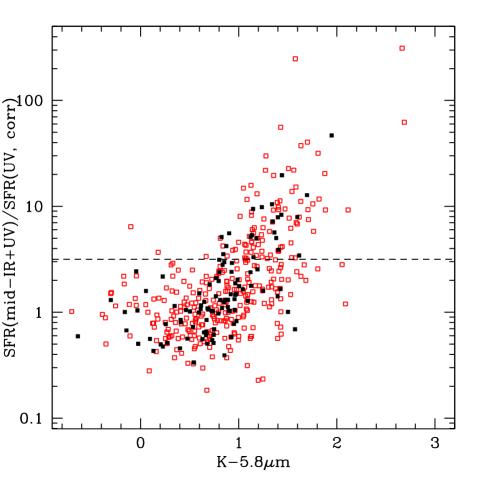
Instead, we find a strong correlation of the mid-IR excess with the colors. Fig. 3 shows that mid-IR excess objects have redder (m) colors. Galaxies with spectroscopic redshift follow the same trend of those with only a photometric redshift. Similar trends are observed for the other 3 IRAC channels (3.6 m, 4.5 m and 8.0 m, not shown here). In principle, redder colors could suggest higher than average redshifts due to -correction effects, but this is ruled out by the weak trend with redshift that we observe, e.g., for the (m) color. We conclude that the optical to near-IR rest-frame colors of mid-IR excess sources are intrinsically redder than that of normal sources. These results imply that whatever the cause of 24 m flux density excess in these galaxies, this excess is detectable also toward shorter wavelengths as seen in the IRAC bands. The distribution in the SFR ratio shown in Fig. 3 for m colors supports our choice of the factor of ratio in Eq. 1 for defining mid-IR excess sources.
3.2. Median SEDs of galaxies with and without mid-IR excess
The systematic difference observed for colors reflects different typical SEDs between the UV/optical and the near-IR rest-frame. We have derived multiwavelength rest-frame SEDs of mid-IR excess and normal galaxies by computing the median magnitude for galaxies in each sample. Results are shown in Fig. 4 for GOODS-N and GOODS-S. This visually confirms that excess emission is detected at all rest-frame wavelengths greater than 1m. The typical of the 2 samples are very close for GOODS-N, as can be inferred from the similarity of the SEDs below 1m [implying also similar median ]. Being much deeper in -band, the GOODS-S mid-IR-normal sample has lower than the mid-IR-excess sample by some 25–30%. Mid-IR excess sources tend to be found more often at brighter -mags, as one can argue from the figure; see also the next section. This explains the larger difference in the normalization of the SEDs above 1m rest-frame. At the shortest wavelengths probed here, it is instead the normal galaxies that have brighter median magnitudes. This is due to the fact that fainter galaxies are bluer (see e.g. also Daddi et al. 2004b).
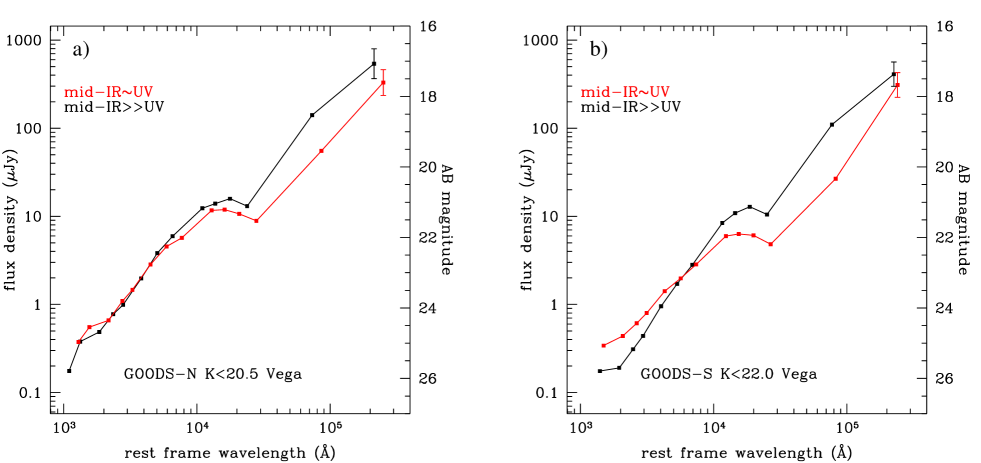
More importantly, we notice that the peak of the stellar dominated component of the SED (say, below 2-3m rest-frame) of mid-IR excess objects is located at longer wavelengths than in normal galaxies (e.g., IRAC m band versus m band), where the peak is consistently located at m as expected (e.g. Sawicki 2002). This difference persists when accounting for the slightly higher redshifts of mid-IR excess objects ( versus on average). In order for this difference to vanish, one might assume that mid-IR excess objects are at even higher redshifts than inferred here. In turn, the mid-IR excess would vanish if we assume that these galaxies are actually systematically at lower redshifts than what estimated here (which would increase more strongly than ). However there is no way to eliminate both the mid-IR rest-frame excess and near-IR rest-frame excess by simply moving the SEDs in redshift.222If these were otherwise normal galaxies (also in their mid-IR) with just photometric redshifts (and thus ) largely overestimated, we should have found the peak of the stellar SEDs at lower rest-frame wavelengths than in normal galaxies. If we had instead underestimated the redshifts of the sources (but notice that objects with and behave consistently in Fig. 3), placing them at even higher redshifts would further increase the strength of the excess seen at 24 m. This is an important piece of evidence demonstrating that we are finding mid-IR excess galaxies not simply as the result of biases in the photometric redshifts.
In principle, an SED peak longward of m could be due to extremely strong dust reddening (e.g., Chary et al. 2007). However, this is disfavored by the comparison of the UV slopes, and further by the agreement between the radio and UV SFRs which rules out substantial additional obscuration in the UV (beyond the obscuration that we estimate based on the UV slopes). We also tested that these results are robust if restricted to sources with spectroscopic redshifts only, and if excluding (in GOODS-N) sources that are radio detected and could be truly UV obscured cases. We conclude that from the SEDs there is compelling evidence that the mid-IR excess is intrinsic and extends to near-IR rest-frame wavelengths, in such a way that the SED shape is altered and its peak moved to wavelengths longer than 1.6m (to about 1.8-1.9m). The required excess component increases sharply with wavelength up to m rest-frame.
Stacking of sources at 70 m (after excluding the few individual detections) yields detections for both mid-IR excess and normal galaxies in both GOODS-N and GOODS-S fields (Fig. 4). In both fields, mid-IR excess and normal galaxies have 70 m stacked flux densities in agreement within the errors, although in both fields the mid-IR excess sources are marginally brighter (less than significance in both cases). This is consistent with the two classes having comparable underlying SFRs. This also implies that the excess emission is getting less important, in relative terms, when sampling m rest-frame wavelengths with the 70 m imaging. The observed 70 m to 24 m ratio is 3.2 and 3 for mid-IR excess galaxies in GOODS-N and GOODS-S respectively, less than half the ratio expected for a local ULIRG if placed at . The ratios for the normal galaxies are in better agreement with those expected from the Chary & Elbaz (2001) models based on local correlations. This trend is similar to what found by Papovich et al. (2007).
The mid-IR excess therefore manifests itself as a relatively warmer continuum dust emission, with respect to the star formation components, whose contribution peaks in the mid-IR but it is still detectable in the near-IR rest-frame. This kind of warm emission is unlikely to be star formation dominated, as the reprocessed emission from star formation declines very steeply below (Genzel et al 1998; Laurent et al 2000), and is a clear signature of the presence of an AGN. These galaxies could be similar to those selected as putative AGN hosts on the basis of power-law continua over the same wavelength range (e.g., Alonso Herrero et al. 2006; Donley et al. 2007), but with a smaller relative contribution of the AGN at least in the IRAC bands, at near-IR rest-frame wavelengths. By comparing the excess at near-IR and mid-IR rest-frame wavelengths, we find that the additional contribution has a shape comprised between that of the nucleus of NGC 1068 and of Mrk 231 (at a fixed 24 m excess, NGC 1068 underpredicts and Mrk 231 overpredicts the median excess over the IRAC bands).
This contamination observed in the IRAC bands will have consequences for SED fitting with stellar population models to derive stellar population parameters and stellar masses. We explore this issue in more detail in Maraston et al. (in preparation). This contamination can also affect the estimation of photometric redshifts of galaxies when using IRAC bands, as this estimate relies also on the location of the 1.6m bump of the stellar SEDs. Comparing to our set of spectroscopic redshifts, we can in fact detect a small bias, with the photometric redshifts of mid-IR excess galaxies being slightly overestimated. Compared to normal galaxies, the median difference between photometric and spectroscopic redshifts is larger by about 0.04 (0.09) in GOODS-S (GOODS-N), just a few percent of .
It is also important to recall here that the warm continuum contamination of the SEDs disappear, or at least is entirely negligible, over the UV rest frame. This is based on the median SEDs shown, and also on the consistency of UV based SFR estimates and submm, radio, and 70 m, for both mid-IR excess and normal galaxies, as extensively discussed in Paper I. In addition, no AGN emission lines are generally detectable in the UV from the mid-IR excess objects, even in the ultradeep 15–30 hour integration GMASS spectroscopy. This is also consistent with the result that the rest-frame UV morphological properties of mid-IR excess and normal galaxies are similar.
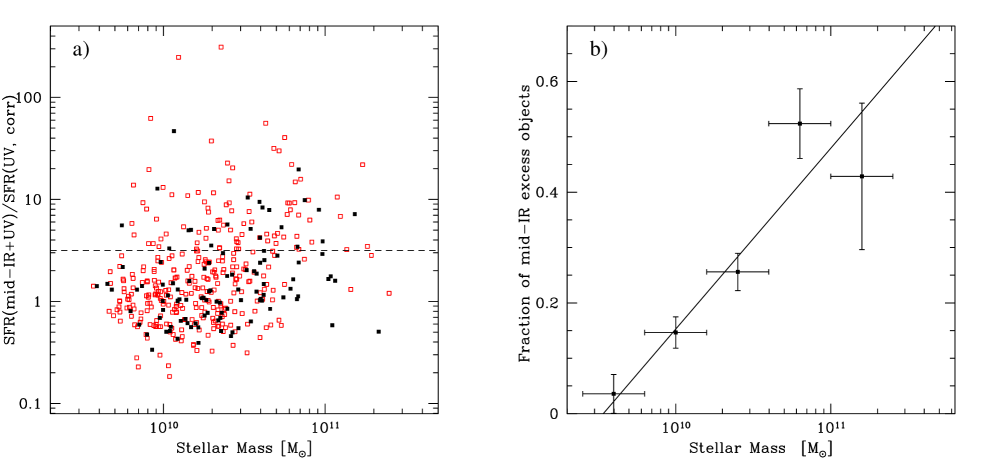
3.3. Mid-IR excess and stellar mass
We have checked if and how the incidence of mid-IR excess galaxies varies with the inferred stellar mass (Fig. 5). Stellar masses for our sample are estimated from the empirically calibrated relations presented in Daddi et al. (2004b), as discussed in Paper I, based on the observed photometry in the -, - and - bands. We find that mid-IR excess sources tend to preferentially reside in galaxies with larger than average stellar masses. The fraction of mid-IR excess sources increases steeply with the mass of the galaxies.
We have investigated if the relation shown in Fig. 5 could be the result of a selection effect. First, we have checked that the trend formally remains if we add to the sample the galaxies with uncertain measurements of the UV slope (and therefore of the UV SFR and mid-IR excess). Also, the sample plotted in Fig. 5 is not mass complete to the lowest masses it formally reaches (). Given our -band selection to (for the GOODS-South sample shown in the figure on which this analysis is based), we expect to be largely complete only above –. We would miss star forming galaxies below this stellar mass threshold if they have very red colors. However, we have verified that we still find statistical evidence for an increasing fraction of mid-IR excess sources with stellar mass if we limit the sample to the range in stellar masses that is expected to be highly complete. Similarly, if we limit our analysis to blue galaxies only, for which we are mass complete over nearly the whole mass range, we still recover the trend shown in Fig. 5.
The warm continuum contribution detected over the IRAC bands is unlikely to bias the results on the dependence of the fraction of mid-IR excess galaxies with stellar mass. Already over the IRAC bands the typical excess contribution is less than 0.5 mags333This is true for both GOODS fields; we recall that the larger difference in the SED normalizations over the IRAC bands that is observed in GOODS-S is mainly due to the different median stellar mass between mid-IR excess and normal galaxies (Fig. 5). and we recall that the stellar mass estimates are not derived using the IRAC bands, but only up to -band. The presence of a few tenths of mags of AGN contribution in the observed -band would not alter substantially the trend. Therefore we conclude that this result is solid and not simply a selection bias.
In Paper I, we describe a strong correlation between stellar mass and . Because of this correlation, the fraction of mid-IR excess objects also increases with . This effect is less pronounced and less evident than the one found for the stellar mass.
| SAMPLE | Exp | Counts | Counts | Counts | S/N | S/N | S/N | Flux | Flux | Flux | |
|---|---|---|---|---|---|---|---|---|---|---|---|
| SB | FB | SB | HB | FB | SB | HB | FB | SB | HB | ||
| Ms | s-1 | s-1 | s-1 | cgs | cgs | cgs | |||||
| NORMAL: | |||||||||||
| N | 69 | 121.2 | 2.05 | 1.42 | 0.65 | 6.6 | 8.4 | 2.4 | 1.78 | 0.74 | 1.32 |
| S | 58 | 49.3 | 3.33 | 2.35 | 1.01 | 6.8 | 8.4 | 2.5 | 2.94 | 1.25 | 2.24 |
| S | 175 | 146.7 | 2.52 | 1.86 | 0.68 | 9.0 | 11.7 | 2.9 | 2.23 | 0.99 | 1.50 |
| EXCESS: | |||||||||||
| N | 27 | 47.2 | 3.80 | 2.57 | 1.26 | 7.3 | 9.0 | 2.8 | 3.29 | 1.35 | 2.55 |
| S | 27 | 22.8 | 4.09 | 2.88 | 1.24 | 6.0 | 7.5 | 2.2 | 3.61 | 1.53 | 2.76 |
| S | 59 | 49.8 | 4.01 | 2.13 | 1.92 | 8.6 | 8.0 | 5.0 | 6.84 | 1.07 | 5.62∗ |
Note. — is the number of sources that were stacked. FB is full band (0.5-8 keV), SB is soft band (0.5-2 keV), and HB is hard band (2-8 keV). 10000 Monte-Carlo trials are performed to estimate the background and S/N for each sample. Effective exposure time is measured in the soft band. Fluxes are calculated using the X-ray spectral slope of for the GOODS-S mid-IR excess galaxies and assuming for the samples that are not detected in the hard band.
∗ using the model shown in Fig. 9 we derive a higher flux of erg s-1.
4. X-ray properties
The overall properties of mid-IR excess sources, as explored in the previous sections, point to the presence of a warm mid-IR continuum component, which could be due to AGN activity. Since we have removed from the sample all X-ray identified AGNs in the 2–8 keV band, any powerful ( erg s-1) AGN present in the mid-IR excess objects would have to be heavily obscured in order to escape being individually detected in the X-rays (note that the observed 2–8 keV band corresponds to the rest-frame 6–24 keV band). We can search for the signature of heavily obscured AGNs below the X-ray detection limit using X-ray stacking analyses (e.g., Brandt et al. 2001). Here we use the code adopted by Worsley et al. (2005), which stacks sources and calculates the significance of the stacked result using 10,000 Monte Carlo trials. In all cases, we limit the X-ray stacking to sources within 5.5 arcmin of the Chandra aim point, to maximize sensitivity.
4.1. X-ray stacking results
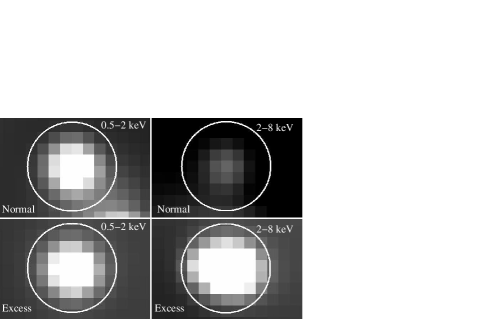
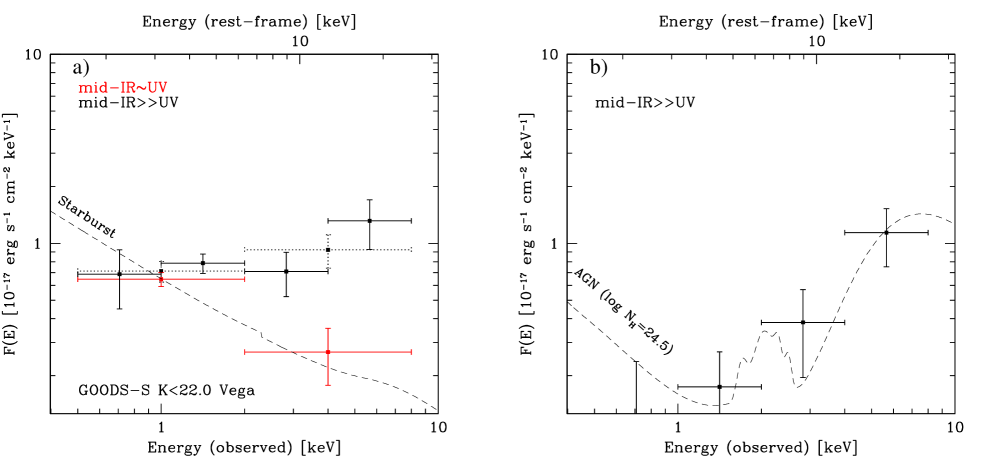
We stacked 59 mid-IR excess galaxies in GOODS-S and found a 5 detection in the 2–8 keV band and an 8 detection in the 0.5–2 keV band (Fig. 6). The count ratio (H/S) is , corresponding to a nominal power law photon index . Using , we infer an average 2–8 keV flux of erg s-1 cm-2 and an average 0.5–2 keV flux of erg s-1 cm-2. The flat X-ray spectral slope strongly argues for the presence of heavily obscured AGN (e.g., see Fig. 2 of Alexander et al. 2005b). The 175 normal GOODS-S sources (i.e., those without mid-IR excess) give a stacked 3 signal in the 2–8 keV band and a 12 detection in the 0.5–2 keV band (Fig. 6). The band ratio is 0.36, corresponding to a spectral index , which is fully consistent with star formation dominating the X-ray emission (e.g., Persic & Raphaeli 2002). Using this value of we derive a 2–8 keV flux of erg s-1 cm-2 and a 0.5–2 keV flux of erg s-1 cm-2. Stacking analysis of the smaller GOODS-N sample, that is limited to , gives a slightly less secure detection and lower S/N ratios, although still with hard X-ray fluxes twice as large for mid-IR excess versus normal galaxies. Similar properties are seen in the GOODS-S sample when limited to . In the following we concentrate on the GOODS-S sample to , because it has the highest S/N X-ray detections. The results of the X-ray stacking are listed in Table 1.
The observed X-ray fluxes can be directly used to estimate luminosities, without accounting for obscuration. For the mid-IR normal galaxies in the GOODS-S sample (), we infer isotropic luminosities of erg s-1 in the 2–8 keV rest-frame band (mapping very closely to the 0.5–2 keV observed band) and of erg s-1 in the 5.8–23.2 keV band rest-frame, assuming a spectral slope. For mid-IR excess galaxies in GOODS-S () the fluxes correspond to X-ray luminosities of erg s-1 in the 2–8 keV rest-frame band and erg s-1 in the 6.2–24.8 keV band rest-frame, for the spectral slope of derived from the count ratios.
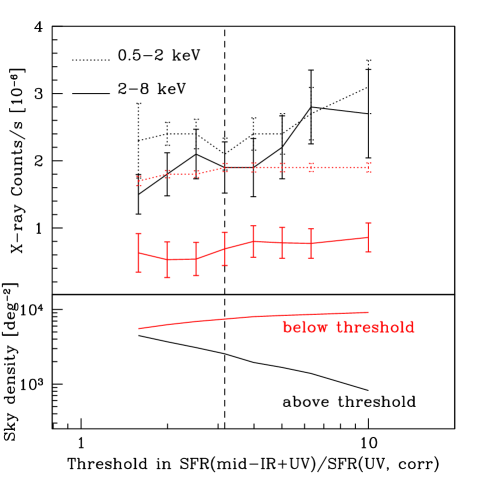
We have explored how these X-ray stacking results depend on the threshold of 0.5 dex in the ratio of to that we have adopted in Eq. 1 for defining mid-IR excess sources. We have varied the threshold from 0.2 dex to 1.0 dex, and performed X-ray stacking separately for sources above and below the threshold. Fig. 7 shows that the general X-ray properties of the ”normal” populations are quite insensitive to the threshold at which the excess sources are identified, given that the latter ones are in all cases a minority. For the mid-IR excess sources, the X-ray stacking confirms that a threshold 2–5 in the SFR ratio effectively singles out the population of hard X-ray emitters (with similar count rates in both hard and soft Chandra bands). The X-ray count rates, and therefore the average luminosities of the mid-IR excess sources, increase with the threshold, while their space density obviously decreases, but the accuracy in the measurements declines due to lower-number statistics.
A possible concern with stacking analyses is whether a small subset of bright sources dominate the stacked results. We verified that this is not the case by performing stacking in galaxy subsamples. The results shown in Fig. 7 argue that our X-ray stacking conclusions are robust to the exact definition of the sample.
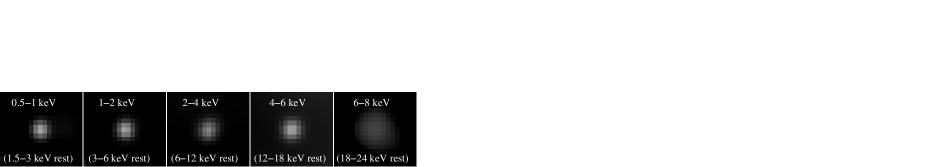
Although the X-ray band ratio indicates the presence of obscured AGNs, it does not fully characterize the properties of the sources. We can gain additional insight into the X-ray spectral properties of mid-IR excess sources by stacking the data inside narrower energy bands. Stacking the GOODS-S data using the sub bands 0.5–2 keV, 1–2 keV, 2–4 keV, 4–6 keV, 4–8 keV, and 6–8 keV, one obtains the results shown in Figs. 8 and 9 and Table 2. Significant () detections are found in all of the sub bands, except for the 6–8 keV band where the detection is only at the 1.8 level (still noteworthy given the low sensitivity of Chandra at these high energies). In summary, the mid-IR excess sources exhibit a hard X-ray spectrum which becomes harder with increasing energy, an unequivocal signature of highly obscured AGN activity.
4.2. X-ray inferred SFRs
The soft X-ray (0.5–2 keV band) fluxes of the samples (mapping quite closely to the rest-frame 2–8 keV luminosities at ) can be used to estimate SFRs, since for star forming galaxies this is proportional to the population of massive X-ray binaries (Ranalli et al 2003; Persic et al 2004; Hornschemeier et al 2005). The rest-frame 2–8 keV luminosity of mid-IR excess sources is higher than that of mid-IR normal sources, and would thus suggest % higher SFRs for the formers. This is in excellent agreement with the estimate obtained from the UV, where we find the same offset between the average of the two samples and in the same direction. Interestingly, the proportionality that we derive is
| (2) |
which is very close to the relation given in Ranalli et al. (2003) (the Persic et al. 2004 relation only accounts for the contribution of high mass X-ray binaries). The agreement between the UV and X-ray estimated SFRs, for both samples of normal and mid-IR excess galaxies in GOODS-S, suggests that no substantial AGN contribution is detected in the observed 0.5–2 keV band of these mid-IR excess objects. Similarly, we find that the soft X-ray fluxes in the mid-IR excess samples in both fields, when limited to , are fully accounted for by the SFR inferred from UV.
4.3. Evidence for Compton thick AGNs
Estimating the obscuring column density for the AGNs inside mid-IR excess sources is crucial for deriving their intrinsic properties. Their stacked Chandra 0.5–2 to 2–8 keV band ratio implies an absorbing gas column density cm-2, for an underlying standard AGN power-law continuum with . Therefore, these AGNs are clearly obscured, but this estimate of should be regarded as a strict lower limit because star-formation is contributing to the emission, especially in the soft band. The 0.5–2 keV emission of the mid-IR excess galaxies can be entirely ascribed to their ongoing star formation, as discussed in the previous section. If we consider that the AGN component in the 0.5–2 keV band is consistent with zero given the errors, we formally obtain a 2 lower limit cm-2 for an intrinsic AGN power law continuum with .
We further used the result of spectral stacking shown in Table 2 and Fig. 9 to improve our constraints on . The right panel of Fig. 9 shows the X-ray spectrum at 2–20 keV rest-frame energies of the mid-IR excess sources, after subtraction of a star-formation component (dashed line model shown in left panel of Fig. 9). We have fitted this AGN component with the Gilli, Comastri & Hasinger (2007) models for obscured AGNs, where is increased in steps of 1 dex up to cm-2 (this approach is admittedly crude, but there is little point for a more refined approach in this work). At the highest levels of obscuration, beyond the Compton thick regime of cm-2, reflection components start to be important in the AGN emission in the rest-frame 2–8 keV (observed Chandra 0.5–2 keV for ), as well as the emission from the Fe line at 6.4 keV, and both are properly included in the models of Gilli et al. (2007). Having convolved the templates with the observed redshift distribution of our sample, the best fit is obtained for cm-2, with both cases cm-2 and cm-2 producing a worse fit with . According to Avni et al. (1976), this implies that they can be rejected at the % confidence level. For the best fitting case of cm-2, the observed 2–8 keV band would be obscured by a factor of , with respect to the intrinsic, unobscured emission.
| BAND | Counts | S/N | Flux |
|---|---|---|---|
| s-1 | cgs | ||
| 0.5-1keV | 0.57 | 2.9 | 0.34 |
| 1-2keV | 1.67 | 8.5 | 0.79 |
| 2-4keV | 0.89 | 3.8 | 1.42 |
| 4-8keV | 1.16 | 3.4 | 5.25 |
| 6-8keV | 0.47 | 1.8 | 4.94 |
Note. — Results of the X-ray spectral stacking for mid-IR excess objects in GOODS-S to . Fluxes calculated using the overall X-ray spectral slope of , estimated from the X-ray band ratio. S/N of the data calculated using the background estimated from 10,000 MC trials.
Therefore, the X-ray spectrum of mid-IR excess sources is fully consistent with the presence of two major components: a star-formation component (modeled here with a power-law emission of ), plus a highly obscured AGN component with (average) cm-2, i.e., mildly Compton thick.
4.4. Column density and mid-IR luminosities
The column density of obscuring gas can be independently estimated by exploiting the correlations between mid-IR and X-ray luminosities for AGNs, in the assumption that the mid-IR excess is entirely due to the AGN. The mid-IR excess sources to in GOODS-S have average (median) 24 m flux densities of 145 (131) Jy, while normal sources have average (median) 24 m flux densities of 41 (27) Jy, consistent with the ongoing SFR on the basis of local correlations. We have computed for all galaxies the 24 m flux densities expected for their on the basis of Chary & Elbaz (2001) models, and compared to the observed 24 m flux densities. We find also in this way that for mid-IR excess galaxies the average (median) excess flux density is 100Jy (80Jy). The ratio of 24 m excess flux density to the total 24 m flux density is found to be 69% (68%) on average (median). Therefore, we infer that the typical excess flux density is –Jy and that the AGN is contributing typically some 2/3 of the observed 24 m flux density in these mid-IR excess galaxies. These figures imply a ratio of 24 m flux density to hard X-ray flux of in the [mJy]/[erg s-1 cm-2] units used by Rigby et al. (2004). According to Rigby et al. (2004), based on the local AGN templates from Silva, Maiolino & Granato (2004) with a range of obscuration, such large ratios at would imply column densities cm-2, or substantially Compton thick sources. Using the observed correlations between the AGN mid-IR light and unobscured hard X-ray light from Lutz et al. (2004), which appear to hold independently of obscuration at least to cm-2, we estimate that unobscured AGNs would contribute only –10Jy at 24 m for given their 2–8 keV X-ray fluxes. In order to match the Lutz et al. (2004) correlation, the 2–8 keV observed flux requires a correction factor of –15, i.e., higher than the factor derived in the previous section, and potentially implying Compton-thick AGN with cm-2.
It is instructive also to compare to the properties of NGC 1068, an extremely obscured local starburst harboring a heavily Compton thick AGN with cm-2. If placed at , the NGC 1068 nucleus would have a hard band X-ray flux of erg s-1 cm-2 and a 24 m flux density of 25Jy. This would give a mid-IR to X-ray ratio of ([mJy]/[erg s-1 cm-2]) fully comparable (slightly larger) than that of the mid-IR excess galaxies. Therefore, these sources are consistent with being the high-redshift analogs of NGC 1068, with overall luminosity scaled up by a factor . The AGN emission of NGC 1068 is thought to be obscured by over a factor of 10, even in the 6–24 keV band (rest frame).
We conclude from the mid-IR to X-ray comparisons that the majority of AGNs shrouded inside massive mid-IR excess galaxies are likely Compton thick, with average cm-2, perhaps even in excess of the estimate of cm-2 derived solely from the X-ray stacking, and possibly in some cases they have extreme obscuration with cm-2.
4.5. Intrinsic AGN luminosities
A determination of the intrinsic X-ray luminosity is critical to assess the general implications of our findings, but unfortunately it is made difficult because the obscuration appears to be very high. For the best fitting Gilli et al. (2007) mildly Compton thick model having cm-2, the observed 2–8 keV band is obscured by a factor of . Consistently using this model to derive 2–8 keV flux from the observed counts yields a flux larger by a factor of 1.7 than that reported in Table 1, computed for . Correspondingly, we estimate that the average, isotropic, unobscured 2–8 keV rest-frame luminosity of mid-IR excess galaxies is erg s-1. To give an idea of the uncertainty in the correction for obscuration, we find that for the Gilli et al. (2007) templates the luminosities would decrease by a factor of 2.9 for cm-2 and would increase by a factor of 3.5 for cm-2 (although we emphasize that the absorption correction for the case of cm-2 is highly dependent on the assumed reflection efficiency).
As a comparison, we can use the Lutz et al. (2004) correlation between unobscured X-ray luminosities and m luminosities for AGNs, which is found to be independent of obscuration and has a scatter for individual sources of about a factor of 3. The relationship between the X-ray and mid-IR emission is strongly dependent on the dust-covering factor around the central source and hence a source with a large dust covering factor will be more mid-IR luminous than one with a smaller dust covering factor (see Alexander et al. 2005b). The average 24 m excess flux density attributed to the AGN is converted to an average m luminosity of order for the ensemble of mid-IR excess objects. We estimate % this value for the typical m luminosity of our sources (based on typical SEDs, see also Fig. 4). From Fig. 7 in Lutz et al. (2004) we would then estimate erg s-1, a factor of 4 larger than that obtained directly from X-ray. In summary, plausible values for the typical rest-frame 2–8 keV unabsorbed luminosities of mid-IR excess galaxies appear to be within – erg s-1.
This result can be cross-checked by looking at the X-ray luminosities of individually hard X-ray detected AGNs in our GOODS samples of selected sources with . If we are finding the heavily obscured, Compton thick, counterparts of the already known population of relatively unobscured sources, we might expect that the Compton thick sources should have typical luminosities similar to the known AGNs, based on AGN unification models (Antonucci 1993; Urry & Padovani 1995). In fact, we find that the average 2–8 keV rest-frame luminosity of individually hard X-ray detected AGNs in our -selected sample is about erg s-1, neglecting obscuration corrections that are likely negligible in most of these cases. The individually X-ray detected AGNs have a sky (and thus space) density that is a factor of smaller than that of our mid-IR excess galaxies in GOODS-S. Given the estimated X-ray luminosities, the mid-IR excess galaxies are also consistent with the correlation between optical/near-IR and 2–10 keV rest-frame luminosities found by Brusa et al. (2005) for distant AGNs.
One might also hope to constrain the bolometric luminosities of the AGNs in our sample, although uncertainties in the AGN bolometric correction factors are currently large (see, e.g., discussions in Pozzi et al. 2007 and Hopkins et al. 2007). Assuming an AGN bolometric correction derived from the Elvis et al. (1994) SED, from the 2–8 keV X-ray luminosity we estimate – erg s-1, or about –. The large range reflects only the uncertainty in the derived 2–8 keV rest-frame luminosity discussed above, as we are neglecting the unknown uncertainty in the bolometric correction for these galaxies. If instead we start from the mid-IR excess, with a typical luminosity of , the Elvis et al. (1994) SED would predict a bolometric correction of a factor of 10, or . Given that our galaxies are heavily obscured in X-rays to a similar degree, it may be more appropriate to use the mid-IR bolometric correction for the NGC 1068 nucleus, which is a factor of 3. This would lead us to estimate . So, we are left with a plausible range spanning from 0.8 to , although a value as high as cannot be completely excluded at this stage. Admittedly, a very large uncertainty affects the estimated AGN bolometric luminosity.
From the ongoing star formation activity we estimate for the typical mid-IR excess object, comparable to the bolometric luminosity of the AGN.
5. Implications
5.1. The sky and space density
The main result of our study is the uncovering of a large population of Compton thick AGNs at . We characterize here the abundance of this population. The sky density of the mid-IR excess AGNs in the GOODS-S field is arcmin-2 to (59 sources in a 5.5′ radius region), after correcting for the 10% incompleteness in our sample due to the requirement of non blended IRAC photometry (see Paper I). This estimate could increase by a factor of 2, accounting for the sources that we excluded from the analysis not being able to properly measure for those either or in Eq. 1. (which requires a well measured UV slope and 24 m detection, mainly, see Sect. 2). As the excluded sources lacking 24 m detections are less likely to be mid-IR excess galaxies, we conservatively correct the sky densities only by a factor 1.3, to account for the overall fraction of red star forming galaxies that were excluded from the analysis for not having a well measured UV slope. This implies a sky density of 0.9 arcmin-2, or some 3200 deg-2. Using the volume within (see Fig. 2 in Paper I) we infer a space density of Mpc-3 for the adopted CDM cosmology.
We are dealing with detections of average properties only (X-ray stacking), and there is likely a spread in luminosities and among the sample. In principle only a fraction of the stacked mid-IR excess sources might be contributing the detected hard X-ray flux, e.g. in the case of a large contamination of the mid-IR excess galaxy sample from galaxies with peculiar mid-IR SEDs that are otherwise powered by star formation. In that case, the space density of this obscured AGN population would be lower by the same fraction, and its average X-ray flux and luminosity would be proportionally higher. The contributing fraction cannot be too small, i.e. at least , otherwise we would have detected directly most of these sources in our Chandra data. Also, the similarity in inferred X-ray luminosities of these Compton thick AGNs to individually detected sources (Sect. 4.5) argues against a lower fraction since this would boost their intrinsic luminosities. With this caveat, we have included all mid-IR sources in the computation of the space density of Compton thick AGN candidates assuming that the mid-IR excess is due to the AGN as discussed above. Relaxing this hypothesis would not substantially affect any of the implications that we derive from this work.
5.2. The predominance of Compton thick AGNs at high redshift
It is interesting to compare the properties of this previously undetected population of obscured, Compton thick, AGNs to AGN populations already known. Over the same redshift range , the sky density of mid-IR excess, Compton thick AGNs is a factor of higher than that of X-ray sources individually detected in X-rays in GOODS-S (Zheng et al 2004), a factor 10 higher than X-ray detected submillimeter-emitting galaxies (Alexander et al. 2003b), and times higher than X-ray undetected power-law AGN candidates (Donley et al. 2007).
We can assess the obscured-to-unobscured AGN ratio by comparing to the space density of unobscured AGNs selected in the soft band by Hasinger et al. (2005). For erg s-1, they find a space density of – at , a factor of smaller than what we find for obscured mid-IR excess AGNs at the same redshift. This implies that the ratio of obscured to unobscured AGNs is larger than at least 5, and is probably much larger yet, consistently with the models expectations (e.g., Gilli et al 2007). Comparing to the luminosity function for hard-X-ray selected AGNs at (Ueda et al. 2003; La Franca et al. 2005), the Compton thick sources that we have found have a space density that is larger by a factor of 2–3 than that of the sources already known and overall with similar luminosities. The difference would decrease if it is only a fraction of mid-IR excess sources that are hosting an X-ray luminous AGN. A more detailed comparison is hampered by the uncertainties inherent the detailed properties of our samples, as discussed in the previous sections. Overall, these results suggest that a dominant fraction of X-ray luminous AGNs are heavily obscured, in general agreement with expectations.
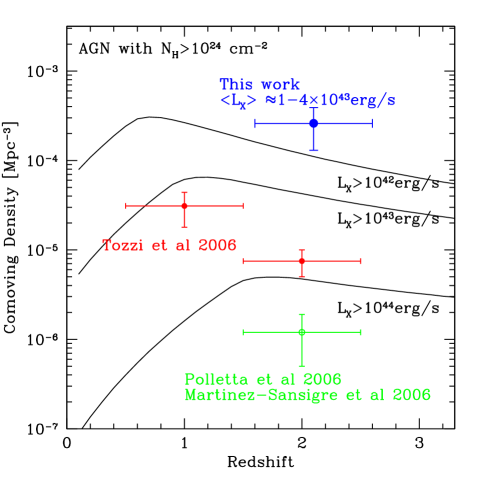
It is also interesting to compare to previously known populations of Compton thick AGNs. Tozzi et al. (2006) identify 6 Compton thick AGNs with at , detected by Chandra in the full GOODS-S, which translates into a space density at least an order of magnitude lower than that inferred here for our mid-IR excess objects. A larger density of Compton thick AGNs is directly detected at by Tozzi et al. (2006), but this is still a factor of at least 3 lower than our estimate at (Fig. 10). Overall, the space density of Compton thick AGNs that we infer at is reasonably consistent, within a factor of 2, with the predictions of the background synthesis model of Gilli et al. (2007; Fig. 10), when counting all the Compton thick sources in the models with erg s-1, which are found to have an average X-ray luminosity of that is similar indeed to that of our sources.444We emphasize that the space density of Compton thick AGNs at in the Gilli et al. 2007 models is constrained by the shape of the missing X-ray background, and is uncertain by a factor of a few. This is because Compton thick AGN in the models produce only a small fraction of the missing background, see Sect. 5.3. This large population of Compton thick AGNs has probably similar intrinsic properties to that found by Martinez-Sansigre et al. (2006), who select AGNs as mid-IR bright sources with a radio detection and a faint IRAC counterpart. They have uncovered a population of AGNs with a sky density of deg-2, turning out to be heavily obscured sources in nearly all cases. Their AGNs are likely the tip of the iceberg of the population found here, given their sky density some 2 orders of magnitude lower than that of our sources, but much higher bolometric luminosities. Similarly, Polletta et al. (2006) find a population of luminous Compton thick AGNs at using Spitzer, with a sky density of about 25 deg-2.
In parallel to this work, Fiore et al. (2007) detected a similar population of obscured AGNs from X-ray stacking of galaxies with large 24 m to optical flux ratios. Given their selection criteria, we expect that many of the Fiore et al. objects would classify as mid-IR excess galaxies.
5.3. Contribution to the X-ray background
Given an observed average hard X-ray flux of erg s-1 cm-2 (calculated directly from the model in Fig. 9 which gives a factor higher flux than given in Table 1; see Sect. 4.5) and the sky density of 3200 deg-2, the mid-IR excess sources produce a background of 0.7 keV s-1 cm-2 sr-1 in the 2–8 keV band. This is a quite small contribution to the total background in this band, which is not surprising given that this band is almost completely resolved by direct detections of individual AGNs (at least up to 6 keV; Worsley et al. 2005; 2006). The relative contribution of these mid-IR excess sources increases towards higher energies, as these sources are strongly obscured.
As an example, we have tried to extrapolate the background flux emitted in the 10–30 keV band. Using the best fitting Gilli et al. (2007) model with cm-2, we estimate that these sources would produce a background flux of about 1.2 keV s-1 cm-2 sr-1 in the 10–30 keV band. For the physically motivated SEDs described in Gilli et al. (2007) this prediction turns out to be only weakly dependent on the assumed , for AGNs around the Compton thick regime. However, for the X-ray spectral shape at the highest energies of NGC 1068 and NGC6240 (Vignati et al. 1999), we would derive a contribution a factor of 2 larger than above, being flatter at the highest energies than the Gilli et al. (2007) models (on the other hand, e.g., the Circinus galaxy has a spectral shape even softer than the Gilli et al models, Matt et al. 1999). These calculations are insensitive to the particular fraction of mid-IR excess galaxies which are actually X-ray emitters, as the dependence is only upon the stacked X-ray fluxes.
The total background in the 10–30 keV band is estimated to be about 44 keV s-1 cm-2 sr-1. On the basis of the Gilli et al. (2007) model, 70–80% of the 10–30 keV background can be ascribed to the sources detected in the deepest X-ray surveys in the 0.5–10 keV band. Therefore we conclude that this population of Compton thick AGNs can account for % of the missing background in the 10–30 keV band, i.e. of the fraction due to Compton thick AGNs which are not individually detected in X-rays. This is in reasonably good agreement with Gilli et al. (2007) model calculations for the background in this energy range emitted by Compton thick AGNs at . The same models predict that most of the rest of the X-ray background is produced by similar AGNs at (although, Steffen et al. 2007 find marginal background contributions from X-ray undetected MIPS galaxies with 24 m flux density Jy at ). Our results suggest that the AGNs in these galaxies could be identified from the presence of excess mid-IR emission.
5.4. On the coeval growth of Black Holes and bulges
About 20–25% of the star forming galaxies in GOODS with (i.e. with stellar masses ) have 24 m excesses by more than 0.5 dex, with the fraction rising to 50–60% for the most massive star forming galaxies with (Fig. 5). We have shown that this appears to be due to the presence of heavily obscured AGNs in these objects, indicating that heavily obscured AGN activity was widespread among star forming galaxies and massive galaxies in general at . This is different from the local universe, where the fraction of massive galaxies containing an AGN is only a few percent (Kauffmann et al. 2004), supporting the idea that the BH growth from the most massive BHs must have been higher in the past (see Fig 2 in Heckman et al. 2004). The AGN activity is likely connected, in some physical way, to the intense star formation activity. In fact, locally a comparably large fraction of LIRGs and ULIRGs contain AGNs with detectable mid-IR excess (Genzel et al 1998; Yun et al. 1999 Tran et al 2000; Laurent et al 2000). Therefore, the relative fraction of AGNs in LIRGs and ULIRGs might not be strongly evolving, while the fraction of AGNs in massive star forming galaxies evolves by a substantial factor. Quite obviously, this suggests that the epoch of major build-up of stellar mass in galaxies at (e.g., Daddi et al. 2005b; Papovich et al. 2006; Franceschini et al. 2006) coincided with a major build-up phase of the central supermassive BHs, as appear to be the case in the submillimeter-emitting galaxy population (e.g., Alexander et al. 2005a, Borys et al. 2005). This supports the idea that the local correlations between BH and galaxy mass were naturally put in place by a concomitant formation. Is there evidence of such a parallel growth of stellar and BH mass in our sample of galaxies ?
The rate of BH growth in these objects can be estimated from their bolometric luminosities, as , with a typical energy conversion efficiency (e.g., Marconi et al. 2004). Given the large uncertainty in the bolometric luminosities of the AGNs in mid-IR excess galaxies () , we infer that the average BH accretion rate is in the range –0.5 yr-1 (here ). The mid-IR excess sources are only of the sample of massive star forming galaxies (i.e., the growth in stellar mass is happening in a times larger sample of galaxies that remain undetected in hard X-rays). The average BH accretion per galaxy may thus be close to 1/4 of the above estimate. We are neglecting here the possible additional BH growth inside galaxies classified in our simplification as mid-IR normal, and BH growth occurring inside individually X-ray-detected AGNs. The latter term, from individually hard X-ray detected AGNs inside massive star forming galaxies, would increase the BH growth budget by at most a factor of 2, and likely much less (see Sect. 4.5). The massive star forming galaxies in our full GOODS-S sample have average SFR M⊙yr-1 (from the UV and soft X-ray). Assuming explicitly here the more physical IMF of Kroupa (2001) or Chabrier (2003), and considering (for comparison to the local Universe) that only some 70% of these stars will survive at , we get a ratio of –.
The local BH to galaxy mass correlation implies (McLure & Dunlop 2001; Marconi et al. 2004; Ferrarese et al 2006), within about a factor of 2 uncertainty. Although uncertain, our estimate of the relative growth rates brackets the observed BH to stellar mass ratio, which tantalizingly suggests that this population of mid-IR excess galaxies may indeed represent the major building phase of BHs in massive galaxies. It is in fact largely expected that massive and star forming galaxies are the progenitors of local spheroids and bulges (e.g., Daddi et al 2004ab; Shapley et al 2005; Adelberger et al 2005; Kong et al. 2006).
From the space density of these sources and their BH accretion rate, the cosmic BH accretion rate density turns out to be M⊙yr-1Mpc-3. This is a factor of –25 larger than the contribution estimated for 2 bright SMGs (Alexander et al. 2005a), which appear to represent the most extreme star-forming galaxies at this epoch; clearly, fainter submm observations may reveal significantly more AGNs and BH growth and eventually overlap with the -selected population investigated here (which have –1.5 mJy, see Daddi et al 2005b and Paper I). However, this accretion-rate density is comparable to the contribution of luminous quasars at these epochs (e.g., Yu & Tremaine 2002; Alexander et al. 2005a; Croton et al 2006). Integrating over the 2 Gyr time span corresponding to the redshift range, this would produce a local BH mass density of –M⊙ Mpc-3. Comparing to the estimate of Mpc-3 for the local integrated BH mass density (Marconi et al. 2004), our estimate is about 5–50% of the total. This is similar to the estimate that today’s massive galaxies are forming most of their stars in the redshift range, accounting for % of all the stars in the local Universe (Daddi et al 2005b).
5.5. AGN duty cycle
The high incidence of AGNs inside massive star forming galaxies, 20-30% for the overall samples, directly implies that the AGN activity at the luminosity levels at which we detect it has a relatively long duty cycle, at most only 3-4 times shorter that that of star formation. If only a fraction of mid-IR excess galaxies are actually X-ray luminous these estimates would be reduced by the same fraction. Accounting for individual X-ray detections of massive star forming galaxies would instead marginally increase these estimates (Sect. 4.5).
In Paper I we show that massive star forming galaxies with are generally ultra luminous IR galaxies (ULIRGs) with a duty cycle of at least 40% and an estimate time duration of at least 400 Myr. At these high masses the fraction of mid-IR excess sources reaches %. Therefore, our results suggest that this obscured AGN activity in massive () galaxies has a duty cycle of at least % and typical durations of at least 200 Myr. We emphasize that these figures are likely to be lower limits because, given the downsizing trends, actively star forming galaxies are likely to represent a higher fraction of all massive galaxies at masses lower than at (i.e., the fraction of quiescent/passive galaxies likely increases rapidly with stellar mass at ). This is consistent with the timescales inferred by Marconi et al (2004).
It is also worth noting that the strong increase of the fraction of mid-IR excess galaxies with stellar mass (see Fig. 5) might imply that the duty cycle of AGN activity inside star forming galaxies depends on stellar mass. This could actually be the ultimate reason for downsizing, i.e. the fact that massive elliptical galaxies are the first to stop their star formation activity (e.g., Cimatti et al. 2006; Bundy et al. 2006; Scarlata et al. 2007). With more massive systems being more likely to host an AGN, they indeed would be the first ones to turn passive if AGN activity is the preferred feedback channel for the quenching star formation. Kriek et al (2007) have proposed a similar argument.
5.6. Submm galaxies, merging and BH growth
It is relevant at this point to summarize the comparison between galaxies, particularly the mid-IR excess objects, and the co-evally selected SMGs, as this has possibly interesting implications for the triggering of BH and galaxy growth. We have discussed in Sect. 5.4 that the BH accretion-rate density at is higher by roughly an order of magnitude in the mid-IR excess galaxies, over what found in SMGs. Estimates of the star formation rate density also show that SMGs account for a similar share of the overall stellar mass growth. Compared to the mid-IR excess galaxies selected to , SMGs are much rarer (at least at bright submm flux densities of mJy; e.g., Coppin et al. 2006), have stellar masses larger by roughly a factor of 2–3 (e.g., Greve et al 2005), have star formation rates about 1 order of magnitude higher ( yr-1 versus yr-1; Chapman et al. 2005; this paper) but AGN luminosities are quite similar (a few erg s-1; Alexander et al 2005ab; this paper). This can explain why generally the SMGs do not display a mid-IR excess over their bolometric luminosity inferred from radio (Pope et al. 2006; see also Menendez-Delmestre et al. 2007; Valiante et al. 2007), as the mid-IR emission from the AGN is likely overshadowed by that from star formation. This also implies that the ratio of BH growth to stellar mass growth is higher in mid-IR excess galaxies than in SMGs. For the former, the concurrent BH and stellar mass growth can account for the buildup of galaxies lying on the locally defined black-hole–spheroid mass relation, while this is likely not the case for the activity of SMGs (Alexander et al. 2005ab).
Submm bright galaxies are likely a special phase during the buildup of massive galaxies corresponding to both the highest SFRs and specific SFRs. They lie outside the stellar mass versus SFR correlation, as described in Paper I, in the same way that ULIRGs are outliers of the local stellar mass to SFR correlation. This is consistent with the idea that SMGs like local ULIRGs are triggered by major mergers, as inferred also on the basis of their morphologies (Conselice et al 2003; Chapman et al 2003), and as suggested also by the compact sizes of the starbursts observed in CO lines and in the radio (Tacconi et al. 2006; Bouche et al 2007). Instead, the fact that galaxies in general define a tight stellar-mass to SFR relation argues against an important role of major mergers in triggering their activity. The long duty cycle of their SFR activity (Daddi et al 2005b; Paper I) also supports this idea, while SMGs are thought to be comparably much shorted lived (e.g., Greve et al 2005 but see also Swinbank et al. 2006).
Therefore, an important conclusion that one might derive from our results is that BH growth in galaxies appear more directly connected with relatively stable and long lived star formation, despite still at considerably high rates, rather than being predominantly associated to rare and short lived major mergers events. We notice that most models of coeval BH and galaxy growth and of AGN feedback postulate instead that major mergers are the most relevant events for BH growths and for triggering feedback (e.g., di Matteo et al. 2005; Schawinski et al. 2006; Croton et al. 2006). Our result is, in fact, somewhat surprising given that mergers are known to be very efficient in channeling the gas toward the center of the galaxies. Major mergers are likely still required to justify the rapid morphological transition between massive high- star forming galaxies with irregular/disk morphologies into bulge dominated systems (although perhaps disk instabilities might also play this game; Genzel et al 2006), but it appears that a substantial fraction of the BH masses inside local massive galaxies might have been put in place outside such events.
6. AGN feedback via Compton heating ?
The widespread presence of obscured AGNs lurking inside massive star-forming galaxies naturally leads to the question of their possible feedback effect on their host galaxies. Feedback from AGNs is widely believed to be the key factor for solving a major problem of galaxy formation models based on CDM cosmology. In short, these models require an ad hoc mechanism to quench star formation in massive galaxies, which is empirically required to reproduce the observed color bi-modality of galaxies as well as the old ages of stars in early-type galaxies. Passively evolving elliptical galaxies are now known to be present in significant numbers at least up to (Cimatti et al. 2004; McCarthy et al. 2004; Daddi et al. 2005a). As first shown by Granato et al. (2001; 2004), physically motivated semi-empirical models of galaxy evolution implementing AGN feedback can successfully account for the existence of massive and passive galaxies already at early epochs (see also de Lucia et al. 2006; Springel et al. 2006; Croton et al. 2006; Bower et al. 2006; Kitzbichler & White 2006), as shown also in Paper I. Our results are consistent with the idea that potentially all massive star forming galaxies contain AGNs, and therefore the ad hoc mechanism advocated by the models appears at least to be plausible because the AGNs are indeed there. Therefore, it would be of great interest to find a direct observational connection between AGN activity and star-formation quenching in massive galaxies.
We can imagine two ways that energy can be transferred from the AGN to the host interstellar medium (ISM), heating it up until it escapes from the galaxy in a wind. One is via (sub)relativistic jets, and their possible role in a similar context – suppression of galaxy cooling flows – has been invoked by, e.g., Binney & Tabor (1995). Alternatively (or in addition), the hard X-rays emitted by the AGN may produce Compton heating as they are absorbed by the ISM, again powering galactic winds (Ciotti & Ostriker 1997; 2007). AGN jets and accretion related outflows are likely a major channel for mechanical feedback in distant galaxies. However, we cannot state anything new on the issue based on our sample of galaxies and our results. We focus instead here on the latter option, as the likely Compton thick nature of these AGNs indicates that Compton heating could indeed be taking place.
The large obscuration of the central BH implies that very high energy photons are heavily absorbed by the material surrounding the AGN, which can thus be efficiently heated. The typical star forming galaxy in our GOODS-S sample has a stellar mass of , and the binding energy of the gas can be estimated to be of order of , where is the gas fraction of the galaxy’s baryonic mass and is the velocity dispersion. The X-ray luminosity absorbed at high energies, e.g., keV in the rest-frame, is erg s-1. These very high energy photons can efficiently heat the gas, through Compton scattering. Assuming, as a limiting case, that all the absorbed energy at keV goes into extracting gas from the galactic potential well, and using , it would take only yr to blow-off the gas completely. Clearly, the efficiency is likely to be much lower, chiefly because the material in the BH surroundings can absorb and re-radiate to lower energies most of the energy of the absorbed hard X-ray photons. The mid-IR excess itself testifies for (part of) the AGN energy output being indeed degraded. The energy available for feedback is the difference between the total hard X-ray energetic output of the AGN, and the fraction of it which is re-radiated at lower energies. Since both terms are affected by large uncertainties, estimating their difference would be affected by even larger uncertainties. Notwithstanding this limitation, the large unobscured luminosity in hard X-rays that we derive for these objects argues for the plausibility of a scenario in which Compton heating plays an important role in quenching star formation.
7. Future Prospects
We have discovered a substantial population of heavily obscured, Compton thick AGNs, residing in a large fraction of massive star forming galaxies at . We have shown that this result has important implications for BH–galaxy evolution but our analysis still leaves open many questions. There are two crucial points that will need to be addressed by future studies: a cleaner selection of mid-IR excess objects and an improved estimate of the obscuring column densities, hence of , and of .
For the selection, the main current limitation is that the fiducial SFR activity of the host galaxy, used to diagnose the presence of an excess at mid-IR bands, is derived from the UV. Due to the necessity of large (hence uncertain) reddening corrections, and in some case of UV obscuration exceeding what can be inferred from the UV slope, this procedure is far from being ideal. A better procedure would be to derive a reliable measurement of the bolometric IR luminosity of the galaxy from long wavelength observations, and compare this to the mid-IR rest-frame luminosity. The availability of ALMA, SCUBA2 and especially Herschel observations in the near future should all substantially help with this task, providing much better multiwavelength SEDs for the dust emission, from mid-IR wavelengths through the far-IR peak and beyond. With such a detailed SED, one could try to disentangle the cold-dust and the warm dust emission, due to, respectively, star formation and AGN heating.
Measuring reliable values for , determining accurately what fraction of mid-IR excess sources are Compton thick, and perhaps also detecting individually these sources, would require extremely sensitive observations. With Chandra this could require an ultra-deep integration, of order of 5-10 Ms, to allow to detect some of the brightest objects. Perspectives also look promising for the next generation of X-ray satellites currently under discussion, such as XEUS (Bavdaz et al 2006); if realized with a fairly high angular resolution (–3′′) XEUS would be ideally suited to X-ray spectroscopy of these X-ray faint AGNs. Rest-frame optical spectroscopy can also provide insights by looking for luminous high-excitation emission lines such as [OIII]5007.
Mid-IR spectroscopy will also be crucial to improve our understanding of these sources. We have not as yet explicitly demonstrated that AGN emission does account for the entirety of the mid-IR excess flux density. Our analysis cannot exclude the possibility that intrinsically different mid-IR SED properties, e.g. anomalously strong PAHs, exist in a fraction of galaxies, with the mid-IR still powered by SFR. This might be related to the presence of different SFR modes, rare or non-existent by , a result that would be quite interesting on its own. Clearly, the ideal means to obtain a direct diagnostic of the cause of the 24 m excess would be to perform spectroscopy at these wavelengths with Spitzer and Akari. Given that the typical mid-IR excess galaxy is highly star forming, we do expect to see PAH features in a large majority of the mid-IR excess galaxies. However, if the mid-IR excess is directly produced by the AGN, we should detect also an important contribution from AGN continuum in most of the mid-IR spectra, lowering the equivalent width of the PAH emission features. As mid-IR excess objects even at are relatively bright at 24 m, with flux densities often in excess of 100–200Jy, the observations are feasible and useful spectra are already available in the Spitzer archive, although their analysis exceeds the scope of the present paper.
8. Summary and conclusions
We have studied the nature of a population of galaxies that displays a marked excess flux density at mid-IR wavelengths, over what expected to arise from just normal star formation activity as estimated from their rest-frame UV. The examined sample includes over 600 -selected galaxies in the two GOODS fields (with 25% of them having a spectroscopic redshifts), with multiwavelength informations including data in UV, optical, near-IR, Spitzer IRAC (3.6–8.0m bands), Spitzer MIPS (24 m and 70 m bands), SCUBA, VLA 1.4 Ghz, and X-ray from Chandra. This sample has been cleaned by all known AGNs, identified via their Chandra 2–8 keV X-ray emission and/or by the presence of a power-law SED over the IRAC bands. The major results of this work can be summarized as follow.
-
•
Roughly 20–30% of the massive star forming galaxies at , selected down to , display a mid-IR excess larger than about a factor of 3, which we classify as “mid-IR excess galaxies”. This fraction increases rapidly with the stellar mass of the galaxies, reaching –60% for . We have shown that our results do not strongly depend on the exact threshold used for defining these mid-IR excess galaxies.
-
•
This population of mid-IR excess galaxies is at slightly higher average redshift than normal galaxies ( vs. 1.9), but overall the two redshift distributions are similar. This population becomes dominant at the highest 8 m (rest-frame) luminosities (for ), that we accurately derive at from Spitzer MIPS 24 m flux densities. Relatively shallow survey with Spitzer MIPS of the Universe are thus the ones that are proportionally most affected by the presence of mid-IR excess galaxies.
-
•
Mid-IR excess sources have redder colors than normal galaxies, reflecting different intrinsic SEDs in the optical to near-IR rest-frame, that can not be attributed to mere redshift effects. For these mid-IR excess sources, the peak of the stellar dominated part of the SED is longward of the canonical 1.6m rest frame. We interpret this as evidence for the presence of a warm dust AGN contribution to the continuum in these sources, consistent also with the finding that the excess flux density seems to become weaker beyond 20m rest-frame, based on Spitzer 70 m observations.
-
•
This excess AGN component over the near-IR rest-frame will likely bias the estimates of stellar masses and photometric redshifts for some of the galaxies, when including IRAC photometry in the SEDs. However, we quantify the effect on the derived photometric redshifts to be only at the level of 2-3% in , for the mid-IR excess sources.
-
•
Stacking of Chandra X-ray data reveals a strong dichotomy in the two populations: the normal sources have a soft spectrum, consistent with star formation in both 0.5–2 and 2–8 keV bands. Contrary to them, mid-IR excess objects exhibit a much harder spectrum, unambiguously showing the presence of highly obscured AGNs inside these sources.
-
•
We use a variety of methods to infer , the column density of the absorbing material along the line of sight. Our best estimate suggests typical obscuration of cm-2, derived from the X-ray spectrum after accounting for the X-ray emission due to star formation. As a result, we infer that the majority of the mid-IR excess galaxies is likely to host a Compton thick AGN.
-
•
This previously unknown population of AGNs has typical X-ray luminosity of – erg s-1 in the 2–8 keV rest frame band. We infer a range for the bolometric luminosity of . This is comparable to the bolometric luminosities of their host galaxies, as due to star formation, for which we estimate a typical value of .
-
•
The sky density of Compton thick AGNs inside massive star forming galaxies to is deg-2 and their space density is Mpc-3. Their space density is higher than that of all AGNs already known at , and much higher than that of previously known Compton thick populations at high redshifts. The space density of Compton thick AGNs that we derive agrees reasonably well with that predicted by the background synthesis models of Gilli et al (2007).
-
•
Despite their large space density, we extrapolate that this population can account for only about 10–25% of the missing X-ray background in the observed 10–30 keV band, in agreement again with the prediction of Gilli et al (2007). Most of the high energy background still to be resolved is likely inside similar sources but residing at rather than at .
-
•
The widespread presence of obscured AGNs inside massive star forming galaxies at seems to quite naturally account for the concurrent growth of the BH together with the stellar mass of the hosting galaxies. Within quite large quantitative uncertainties, this picture is consistent with these objects approaching the local values for the ratios between the mass of central BH and that of their hosting bulges.
-
•
A relatively long duty cycle for the AGN activity at , only a factor of 3-4 lower than that of star formation activity, is suggested by the widespread presence of AGNs that appear to be present among massive star forming galaxies.
-
•
Comparing to submm selected galaxies (SMGs), we find that BHs are growing faster in mid-IR excess galaxies, relatively to the ongoing SFR, and their integrated contribution to the BH accretion-rate density are also larger. This suggest that of BH growth in massive galaxies is taking place outside major merger events.
-
•
The large, increasing incidence of Compton thick AGNs with stellar mass, along with the energy deposition provided by the absorption of the hard X-ray photons, suggest that these objects may be responsible for the AGN feedback eventually leading to the termination of the star formation activity, and to do so beginning with the most massive galaxies as in the downsizing scenario. Although existing data do not allow to firmly prove this tantalizing possibility, we show that the involved energetics is consistent with this picture.
-
•
We finally discuss future prospects for improving our still limited understanding of the properties of mid-IR excess galaxies and Compton thick AGNs at high redshift. The crucial and obvious required next step is the full construction of their spectral energy distribution, including ALMA, SCUBA-2, and Herschel facilities as they become available, as well as of their spectral mid-IR properties, via Spitzer IRS and Akari spectroscopy. Extremely deep Chandra (5-10 Ms) exposures would be required to directly detect some of these Compton thick AGNs.
In summary, we have uncovered a major population of luminous and obscured AGNs, previously largely unknown. With AGN and star formation activity in massive galaxies peaking at , this newly detected population of Compton thick AGNs appears to be an excellent candidate for playing a major role both for establishing the BH mass–bulge mass relation, and for providing the feedback necessary to discontinue further star formation in massive galaxies.
References
- (1) Adelberger K. L., Erb D. K., Steidel C. C., Reddy N. A., Pettini M., Shapley A. E., 2005, ApJ, 620, L75
- (2) Alexander, D. M., et al. 2003a, AJ, 126, 539
- (3) Alexander D. M., et al., 2003b, AJ, 125, 383
- (4) Alexander D. M., Smail I., Bauer F. E., Chapman S. C., Blain A. W., Brandt W. N., Ivison R. J., 2005a, Natur, 434, 738
- (5) Alexander D. M., Bauer F. E., Chapman S. C., Smail I., Blain A. W., Brandt W. N., Ivison R. J., 2005b, ApJ, 632, 736
- (6) Alonso-Herrero A., et al., 2006, ApJ, 640, 167
- (7) Antonucci R., 1993, ARA&A, 31, 473
- (8) Armus L., et al., 2007, ApJ, 656, 148
- (9) Avni Y., 1976, ApJ, 210, 642
- (10) Barger A. J., Cowie L. L., Wang W.-H., 2007, ApJ, 654, 764
- (11) Bavdaz M., et al., 2006, SPIE, 6266, 51
- (12) Binney, J., & Tabor, G. 1995, MNRA, 276, 663
- (13) Borys C., Smail I., Chapman S. C., Blain A. W., Alexander D. M., Ivison R. J., 2005, ApJ, 635, 853
- (14) Bouche N., Cresci G., Davies R., et al., 2007, ApJ in press (arXiv:0706.2656)
- (15) Bower, R.G., et al. 2006, MNRAS, 370, 654
- (16) Brandt W. N., Hasinger G., 2005, ARA&A, 43, 827
- (17) Brusa M., et al., 2005, A&A, 432, 69
- (18) Bundy, K, et al. 2006, ApJ, 651, 120
- (19) Calzetti D., Armus L., Bohlin R. C., et al., 2000, ApJ, 533, 682
- (20) Cimatti A., Daddi E., Renzini A., et al., 2004, Nature, 430, 184
- (21) Cimatti A., Daddi E., Renzini A., 2006, A&A, 453, L29
- (22) Ciotti, L., & Ostriker, J.P. 1997, ApJ, 487, L10
- (23) Ciotti, L., & Ostriker, J.P. 2007, submitted to ApJ (astro-ph/0703057)
- (24) Chapman S. C., Windhorst R., Odewahn S., Yan H., Conselice C., 2003, ApJ, 599, 92
- (25) Chapman, S. C., Blain, A. W., Smail, I., & Ivison, R. J. 2005, ApJ, 622, 772
- (26) Chartas G., Brandt W. N., Gallagher S. C., Proga D., 2007, AJ, 133, 1849
- (27) Comastri A., Setti G., Zamorani G., Hasinger G., 1995, A&A, 296, 1
- (28) Conselice C. J., Chapman S. C., Windhorst R. A., 2003, ApJ, 596, L5
- (29) Coppin K., et al., 2006, MNRAS, 372, 1621
- (30) Croom S. M., Smith R. J., Boyle B. J., Shanks T., Miller L., Outram P. J., Loaring N. S., 2004, MNRAS, 349, 1397
- (31) Croton D. J., et al., 2006, MNRAS, 365, 11
- (32) Daddi E., et al., 2004a, ApJ, 600, L127
- (33) Daddi E., Cimatti A., Renzini A., Fontana A., Mignoli M., Pozzetti L., Tozzi P., Zamorani G., 2004b, ApJ, 617, 746
- (34) Daddi E., et al., 2005a, ApJ, 626, 680
- (35) Daddi E., Dickinson M., Chary R., et al, 2005b, ApJ, 631, L13
- (36) Daddi E., Dickinson M., Morrison G., et al., 2007, ApJ in press (arXiv:0705.2831) (Paper I)
- (37) Dale D. A., et al., 2006, ApJ, 646, 161
- (38) De Lucia G., Springel V., White S. D. M., Croton D., Kauffmann G., 2006, MNRAS, 366, 499
- (39) Di Matteo T., Springel V., Hernquist L., 2005, Natur, 433, 604
- (40) Donley J. L., Rieke G. H., Pérez-González P. G., Rigby J. R., Alonso-Herrero A., 2007, ApJ, 660, 167
- (41) Elbaz D., Daddi E., Le Borgne D., et al., 2007, A&A in press (astro-ph/0703653)
- (42) Elvis M., et al., 1994, ApJS, 95, 1
- (43) Ferrarese L., Merritt D., 2000, ApJ, 539, L9
- (44) Ferrarese, L., et al. 2006, ApJ, 644, L21
- (45) Fiore F., et al., 2007, ApJ, in press (arXiv:0705.2864)
- (46) Franceschini A., et al., 2006, A&A, 453, 397
- (47) Frayer D.T., Huynh M.T., Chary R., et al., 2006, ApJ, 647, L9
- (48) Gebhardt K., et al., 2000, ApJ, 539, L13
- (49) Genzel R., et al., 1998, ApJ, 498, 579
- (50) Genzel R., et al., 2006, Natur, 442, 786
- (51) Giacconi R., Zirm A., Wang J., et al., 2002, ApJS, 139, 369
- (52) Giavalisco M., Ferguson H.C., Koekemoer A., et al., 2004, ApJ. 600, L93
- (53) Gilli R., Salvati M., Hasinger G., 2001, A&A, 366, 407
- (54) Gilli R., Comastri A., Hasinger G., 2007, A&A, 463, 79
- (55) Granato, G.L. 2001, MNRAS, 324, 527
- (56) Granato, G. L., De Zotti, G., Silva, L., Bressan, A., & Danese, L. 2004, ApJ, 600, 580
- (57) Greve T. R., et al., 2005, MNRAS, 359, 1165
- (58) Hasinger G. 2004. Nucl. Phys. B (Proc. Suppl.) 132, 86
- (59) Hasinger G., Miyaji T., Schmidt M., 2005, A&A, 441, 417
- (60) Hickox R.C. & Markevitch M., 2007, ApJL in press (astro-ph/0702556)
- (61) Hopkins P. F., Richards G. T., Hernquist L., 2007, ApJ, 654, 731
- (62) Hornschemeier A. E., Heckman T. M., Ptak A. F., Tremonti C. A., Colbert E. J. M., 2005, AJ, 129, 86
- (63) Kitzbichler, M.G. & White, S.D.M. 2006, MNRAS, 366, 858
- (64) Kong X., Daddi E., Arimoto N., et al., 2006, ApJ, 638, 72
- (65) Kormendy J., Richstone D., 1995, ARA&A, 33, 581
- (66) Kriek M., van Dokkum P.G., Franx M., et al., 2007, submitted to ApJ (astro-ph/0611724)
- (67) Krivonos R., Vikhlinin A., Churazov E., Lutovinov A., Molkov S., Sunyaev R., 2005, ApJ, 625, 89
- (68) Lacy M., et al., 2004, ApJS, 154, 166
- (69) La Franca F., et al., 2005, ApJ, 635, 864
- (70) Laurent O., Mirabel I. F., Charmandaris V., Gallais P., Madden S. C., Sauvage M., Vigroux L., Cesarsky C., 2000, A&A, 359, 887
- (71) Lutz D., Maiolino R., Spoon H. W. W., Moorwood A. F. M., 2004, A&A, 418, 465
- (72) Magorrian J., et al., 1998, AJ, 115, 2285
- (73) Marconi A., Risaliti G., Gilli R., Hunt L. K., Maiolino R., Salvati M., 2004, MNRAS, 351, 169
- (74) Marshall F. E., Boldt E. A., Holt S. S., Miller R. B., Mushotzky R. F., Rose L. A., Rothschild R. E., Serlemitsos P. J., 1980, ApJ, 235, 4
- (75) Martínez-Sansigre A., Rawlings S., Lacy M., Fadda D., Jarvis M. J., Marleau F. R., Simpson C., Willott C. J., 2006, MNRAS, 370, 1479
- (76) Matt et al. 1999, A&A, 341, L39
- (77) McCarthy P. J., et al., 2004, ApJ, 614, L9
- (78) McLure R. J., Dunlop J. S., 2001, MNRAS, 327, 199
- (79) Menéndez-Delmestre K., et al., 2007, ApJ, 655, L65
- (80) Noeske K.G., Weiner B.J., Faber S.M., et al., 2007a, ApJ Letters, in press (astro-ph/0701924)
- (81) Papovich C., et al. 2006, ApJ, 640, 92
- (82) Papovich C., Rudnick G., Le Floc’h E., et al., 2007, ApJ, in press (arXiv:0706.2164)
- (83) Peng C. Y., Ho L. C., Impey C. D., Rix H.-W., 2002, AJ, 124, 266
- (84) Persic M., Rephaeli Y., 2002, A&A, 382, 843
- (85) Polletta M. d. C., et al., 2006, ApJ, 642, 673
- (86) Pope A., Borys C., Scott D., Conselice C., Dickinson M., Mobasher B., 2005, MNRAS, 358, 149
- (87) Pope A., et al., 2006, MNRAS, 370, 1185
- (88) Pozzi F., Vignali C., Comastri A., et al., 2007, submitted to ApJ (arXiv:0704.0735)
- (89) Ranalli P., Comastri A., Setti G., 2003, A&A, 399, 39
- (90) Rigby J. R., et al., 2004, ApJS, 154, 160
- (91) Sawicki M., 2002, AJ, 124, 3050
- (92) Scarlata, C., et al. 2007, ApJS (in press, astro-ph/0701746
- (93) Schawinski K., et al., 2006, Natur, 442, 888
- (94) Schmidt M., 1968, ApJ, 151, 393
- (95) Shapley A., et al., 2005, ApJ, 626, 698
- (96) Silk J., Rees M. J., 1998, A&A, 331, L1
- (97) Silva L., Maiolino R., Granato G. L., 2004, MNRAS, 355, 973
- (98) Spergel D.N., et al., 2007, ApJ, in press (astro-ph/0603449)
- (99) Springel V., Di Matteo T., Hernquist L., 2005, ApJ, 620, L79
- (100) Springel V., Frenk C. S., White S. D. M., 2006, Natur, 440, 1137
- (101) Steffen A.T., Brandt W.N., Alexander D.M., Gallagher S.C., Lehmer B.D., 2007, submitted to ApJ (arXiv:0705.2213)
- (102) Stern D., et al., 2005, ApJ, 631, 163
- (103) Swinbank A. M., Chapman S. C., Smail I., Lindner C., Borys C., Blain A. W., Ivison R. J., Lewis G. F., 2006, MNRAS, 371, 465
- (104) Tozzi P., et al., 2006, A&A, 451, 457
- (105) Tran Q. D., et al., 2001, ApJ, 552, 527
- (106) Treister E., et al., 2004, ApJ, 616, 123
- (107) Ueda Y., Akiyama M., Ohta K., Miyaji T., 2003, ApJ, 598, 886
- (108) Urry, C. M., & Padovani, P., 1995, PASP, 107, 803
- (109) Valiante E., Lutz D., Sturm E., Genzel R., Tacconi L. J., Lehnert M. D., Baker A. J., 2007, ApJ, 660, 1060
- (110) Vignati P., et al., 1999, A&A, 349, L57
- (111) Worsley M. A., et al., 2005, MNRAS, 357, 1281
- (112) Worsley M. A., Fabian A. C., Bauer F. E., Alexander D. M., Brandt W. N., Lehmer B. D., 2006, MNRAS, 368, 1735
- (113) Yun M. S., Hibbard J. E., Condon J. J., Reddy N., 1999, Ap&SS, 266, 29
- (114) Zheng W., et al., 2004, ApJS, 155, 73