Multiwavelength study of massive galaxies at
z .
I. Star formation and galaxy growth
Abstract
Examining a sample of massive galaxies at with from the Great Observatories Origins Deep Survey, we compare photometry from Spitzer at mid- and far-IR, to submillimeter, radio and rest-frame ultraviolet wavelengths, to test the agreement between different tracers of star formation rates (SFRs) and to explore the implications for galaxy assembly. For galaxies with moderate luminosities (), we find that the SFR can be estimated consistently from the multiwavelength data based on local luminosity correlations. However, 20–30% of massive galaxies, and nearly all those with , show a mid-IR excess which is likely due to the presence of obscured active nuclei, as shown in a companion paper. There is a tight and roughly linear correlation between stellar mass and SFR for 24 -detected galaxies. For a given mass, the SFR at was larger by a factor of and relative to that in star forming galaxies at and , respectively. Typical ultraluminous infrared galaxies (ULIRGs) at are relatively ’transparent’ to ultraviolet light, and their activity is long lived ( Myr), unlike that in local ULIRGs and high redshift submillimeter-selected galaxies. ULIRGs are the common mode of star formation in massive galaxies at , and the high duty cycle suggests that major mergers are not the dominant trigger for this activity. Current galaxy formation models underpredict the normalization of the mass-SFR correlation by about a factor of 4, and the space density of ULIRGs by an order of magnitude, but give better agreement for quiescent galaxies.
Subject headings:
galaxies: evolution — galaxies: formation — cosmology: observations — galaxies: starbursts — galaxies: high-redshift1. Introduction
Tracing the buildup of galaxies at high redshifts requires reliable measurements of two fundamental quantities: stellar masses and star-formation rates (SFR). The integrated history of star-formation rates within galaxies provides a lower limit to their stellar mass growth. Stellar mass growth in excess of this contribution is to be ascribed to galaxy mergers. Most of the rise in the space density of massive galaxies takes place in the cosmic time interval between and (e.g., Dickinson et al. 2003; Rudnick et al. 2003; 2006; Fontana et al. 2004; 2006; Daddi et al. 2004a, D04a hereafter; van Dokkum 2006; Franceschini et al. 2006; Pozzetti et al. 2007; Arnouts et al. 2007). It is still unclear, however, what is the major channel for galaxy growth during this period, and the quantitative role of mergers in building up the mass of galaxies. Violent starbursts have been found to be common in the universe (D04a, Daddi et al. 2005b, D05b hereafter; Shapley et al. 2005; Förster-Schreiber et al. 2004a), but their relevance on the mass growth of galaxies critically depends on the effective duration of these vigorous star-formation events (see D05b). To make substantial progress one needs to look at the distribution of star-formation rates in distant galaxies, in order to ascertain the relative frequency of these events among massive galaxies. This requires accurate measurements of individual star-formation rates in large samples of distant galaxies.
The advent of the Spitzer Space Telescope holds substantial promise to achieve these goals, as it now routinely allows one to detect distant galaxies with the Multiband Imaging Photometer for Spitzer (MIPS) at 24 all the way to redshift of (and even beyond). This corresponds to the rest-frame spectral mid-IR region (5–12m), which tends to be dominated by polycyclic aromatic hydrocarbon features (PAH). In the local universe, the mid-IR luminosities of galaxies are known to correlate with the total infrared luminosities (; see Chary & Elbaz 2001; Elbaz et al. 2002; Dale & Helou 2002; Förster-Schreiber et al. 2004b), a well established probe of the star-formation rate of galaxies. Problems however exist because the PAH emission is known to be reduced at low metallicities (Engelbracht et al. 2005; Madden et al. 2006). Spitzer observations show a substantial scatter in the local correlation of mid-IR luminosity vs. the total infrared luminosity (Dale et al. 2005; Smith et al. 2006; Armus et al. 2006). In addition, a substantial contribution to the mid-IR light can come from the accretion disks of Active Galactic Nuclei (AGNs). AGNs in distant galaxies can be identified by their X-ray emission, but this would not be detectable at in the case of large column densities of obscuring material even for luminous AGN (e.g., as in the case of NGC 1068).
Several recent surveys have used the 24 emission in galaxies in order to estimate their ongoing star-formation rates and related quantities (e.g., Pérez-González et al. 2005; Reddy et al. 2005; D05b, Papovich et al. 2006; Caputi et al. 2006ab; etc.). This is generally accomplished by using prescriptions relating the mid-IR luminosity to , as calibrated in the spectral libraries from Chary & Elbaz (2001; CE01 hereafter) and Dale & Helou (2002; DH02 hereafter), although sometimes other empirical conversions have been used (see, e.g., Caputi et al. 2007). However, it remains to be established to which extent these estimates are still accurate for galaxies. For example, the impact of the silicate 9.7 m absorption feature at high redshift has still to be quantified, and the relative strength of the PAH emission as a function of star formation activity might be different at high redshift with respect to the local Universe.
Using multi-wavelength data from the Northern field of the Great Observatories Origins Deep Survey (GOODS), D05b showed that the average SED of massive galaxies is consistent with that of present–day ULIRGs. This implies, on average, a good agreement between star-formation tracers as calibrated locally and based on the radio, far-IR, mid-IR and even UV (corrected for the extinction by dust) and the X-ray. This agreement is encouraging in view of our need to estimate the star-formation rates in distant galaxies, especially given the currently limitations in probing the luminosities of galaxies at at the peak of the far-IR emission at m in the rest-frame. In this regard, the situation will eventually improve with Herschel, and later on with ALMA. In D05b a number of interesting features of high redshifts ULIRGs were discussed, e.g., that they may have fairly long duty cycles and that they appear to be relatively ’transparent’ to the UV photons. These and other aspects are visited again here in more detail.
The main aim of this paper is to verify to which extent this agreement among the various star formation tracers persists individually for distant massive galaxies, hence to which extent SFRs can be unambiguously measured at high redshift. In particular, reliable SFRs are instrumental for relating to them other galaxy properties in a meaningful way. For example, recent surveys have shown that a tight correlation exists at and at between the stellar mass and the SFRs of blue, actively star forming galaxies (Noeske et al. 2007; Elbaz et al. 2007). It is not yet clear if such a fundamental correlation exists also at higher redshifts, when most of the stars in massive galaxies were formed.
For this work we make use of some of the deepest multiwavelength datasets, available as part of GOODS. In particular, compared to D05b, we use here a much deeper 1.4 GHz dataset over GOODS-North (GOODS-N hereafter) obtained with the Very Large Array (VLA) (Morrison et al. in preparation), and 70 photometry from both GOODS fields from Frayer et al. (2006). Also crucial to this work is the large dataset of spectroscopic redshifts that is available to us, including the VLT/FORS2 spectroscopic redshifts for the GOODS-South field (GOODS-S hereafter; Vanzella et al. 2005, 2006) and those from the ultradeep spectroscopy of the GMASS survey (Kurk et al., in preparation). Finally, we have used in this work the latest realization of galaxy formation models based on the Millennium simulations (Springel et al. 2005), in the form of mock lightcones presented by Kitzbichler & White (2007). This allows us to constrain the models and gain insights into the nature of star forming galaxies at high redshifts.
The paper is organized as follows. The sample selection of galaxies, with spectroscopic and photometric redshifts are presented in Section 2. The multiwavelength datasets used are presented in Section 3, with a discussion of known limitations of each dataset as a star formation indicator, especially for high redshift galaxies. Section 4 compares the 8 rest-frame luminosities of galaxies (estimated from their 24 flux densities) to those at other wavelengths, while Section 5 focuses on the use of ultraviolet (UV) luminosities and on the reliability of extinction corrections. A suggested recipe for estimating SFRs in galaxy samples is given in Section 6. We present the implications of our findings for the characterization of star formation in distant galaxies, galaxy growth and the comparison with theoretical models in Section 7. Our conclusions are summarized in Section 8. We assume a Salpeter initial mass function (IMF) from 0.1 and 100 , and a WMAP3 cosmology with , and [km s-1 Mpc-1] (Spergel et al. 2007). Throughout the paper we use magnitudes in the Vega scale, unless stated otherwise.
2. Samples of galaxies in GOODS
The sample of galaxies analyzed in this study has been selected in the -band, and applying the selection technique introduced by Daddi et al. (2004b; D04b hereafter), that allows us to define highly complete samples of galaxies in the redshift range . Unless explicitly stated otherwise, we limit the analysis to star forming galaxies (or s, as opposed to the passive ones or s), as we aim to focus on galaxies with active star formation. In the GOODS-N field we have selected 273 galaxies to , corresponding to the 5-sigma detection limit of the data taken with the Flamingos camera on the Mayall 4m NOAO telescope (the dataset used here is slightly deeper than that used in D05b). In the GOODS-S field we selected 1018 sources detected with down to . The GOODS-S field -band VLT ISAAC data is not homogeneously deep over the whole field, but reasonably complete over the whole used area at these -band limits. We have excluded from the analysis all hard X-ray detected galaxies in both GOODS fields, using the catalogs of Alexander et al. (2003), and galaxies with power law SEDs over the 3.6–24 m wavelength range observed by the Spitzer Infrared Array Camera (IRAC) as likely AGN-dominated sources. Only a handful of power-law galaxies remain undetected in our deep X-ray imaging data. Also, in both fields we only consider galaxies whose IRAC counterpart is closer than 0.5′′ from the K-band position. We have empirically verified that this criterion is efficient at excluding sources where the IRAC bands photometry is substantially contaminated by blending due to the relatively poor IRAC PSF of about 1.6′′. Statistically, this excludes some 10% of the galaxies, for the accurate IRAC detection procedures carried out in GOODS and based on mexhat kernel detections using SExtractor (Dickinson et al., in preparation). This criterion is required in order to have reliable photometry over the IRAC bands (hence solid photometric redshift estimates), and to avoid problems with blending in the MIPS 24 photometry. The 24 flux densities (Chary et al., in preparation) are in fact estimated using prior source positions from the IRAC catalogs.


In both fields we used multiband photometry in the optical and near-IR (see Giavalisco et al. 2004 for datasets descriptions), updated to the latest releases and observations. SEDs were derived using the method described, e.g., in D04b and D05b. Photometric redshifts were determined in both fields for all selected galaxies by fitting to the empirical templates of Coleman et al. (1980), as described in D04ab. However, for the GOODS-S field we find that the photometric redshifts measured by Grazian et al. (2006), which include deep U-band data similarly to what we have in GOODS-N, are in slightly better agreement with the spectroscopic redshifts and we decided to adopt them for the present analysis.
Spectroscopic redshifts are available in GOODS for a fairly representative fraction of the galaxy sample considered in this paper. When limiting to spectroscopic redshifts with flags warranting reliability, redshifts are available for 175 galaxies in GOODS-S (17% of the total sample) and in GOODS-N (21% of the sample). For GOODS-S, in addition to all sources of publicly available redshifts (VVDS: Le Fevre et al. 2004; GOODS/FORS2: Vanzella et al. 2005, 2006; K20 survey: Mignoli et al. 2005; CDFS survey: Szokoly et al. 2004) we have most notably used results of redshift surveys developed as part of GOODS or in collaboration with GOODS, that explicitly targeted the galaxies. This includes the Galaxy Mass Assembly Spectroscopic Survey (Kurk et al. 2006, and in preparation111see http://www.arcetri.astro.it/cimatti/gmass/gmass.html) that targeted galaxies selected at 4.5m (IRAC channel 2) to a limiting AB magnitude = 23. For the GOODS-N field major sources of spectroscopic redshifts are Keck LR-blue and DEIMOS observations carried out within GOODS (Stern et al., in preparation) and the BM/BX samples of Reddy et al. (2006b), in addition to the TKRS survey (Wirth et al. 2004).
Fig. 1 panels show the comparison of photometric and spectroscopic redshifts for our samples of selected galaxies. The dispersion of the residual in the difference between spectroscopic and photometric redshifts is for GOODS-N and GOODS-S. The larger number of outliers in the full samples, with respect to the samples, shows that the use of the selection does help in defining a clean sample of galaxies, which is substantially free from lower redshift contaminants. We have identified a small sample of galaxies in both fields with strong discrepancies between spectroscopic and photometric redshifts. From a careful analysis of the multiwavelength SED of these outliers, we found that in most cases the spectroscopic redshift appears to be the wrong one, and we have adopted the photometric redshift for the analysis. This does not affect any of our major conclusions.
Fig. 2 panels show the redshift distribution of the sources used for the analysis of SFR indicators in this paper. We do not include in the analysis carried out in the next sections the objects in the tails of the distributions, with either or .

3. Multiwavelength datasets, their interpretation and known limitations
A major focus of this paper is the comparison between luminosities at various wavelengths, each of which is known to correlate with the SFR in galaxies. In order to put emission at different wavelengths onto a common footing for intercomparison, we will adopt nominal conversions between these observed luminosities and fiducial quantities such as the total infrared luminosity (, integrated from 8 to 1000m) or an equivalent star formation rate (SFR). The use of as a star formation indicator implies that all energy from star formation is absorbed by dust and re-radiated in the thermal infrared, and that there are no other significant sources for dust heating. Neither assumption is universally correct: on the one hand not all UV photons from young massive stars may be absorbed by dust, whereas emission from an AGN can boost emission at various wavelengths, including the infrared luminosity . Thus, SFR estimates based only on would result in underestimates in the former case, and in overestimates of the true SFR in the latter. Starburst galaxies with the high SFRs (many tens to hundreds of yr-1) and infrared luminosities ( are called luminous infrared galaxies or LIRGs; then, for one refers to ultraluminous infrared galaxies, or ULIRGs; we will also refer to objects with as hyperluminous, or HyLIRGs) characteristic of some the galaxies studied here. Values for and the SFR may differ substantially, depending on the specific tracer used to evaluate them. In this section, we present the different indicators, and give a description of the techniques used to analyze the data, and of the recipes used to convert the observed emission to SFRs. These recipes are generally based on empirical calibrations in the local universe. In the next section, we will compare the derived equivalent or SFR values, looking for agreement, which would suggest coherent behavior from low to high redshift, or for discrepancies, which may suggest that other effects are coming into play.
Following Kennicutt (1998), we may express the conversion between and SFR as:
| (1) |
This conversion depends on the adopted IMF; here we have adopted the IMF of Salpeter (1955). Given this relation, SFRIR and can be seen as equivalent quantities for star forming galaxies. In order to estimate the total SFR, we must also include the contribution of energetic emission from young, massive stars that is not absorbed and reprocessed by dust. We estimate it from the rest-frame UV luminosity as in Eq. 5 of D04b, with no reddening correction, so to have:
| (2) |
We shall return to the conversion of UV light to SFR in Section 3.6. The second term above is negligible for red galaxies, as for most of the -selected sources with , but becomes more relevant at fainter magnitudes when bluer galaxies are more prevalent.
3.1. Spitzer MIPS 24 imaging
Both GOODS-N and S have been observed with Spitzer MIPS at 24 for about 10 hours per sky pixels. See D05b for a slightly more detailed description of these datasets and for the associations of 24 flux densities to K-selected galaxies. Catalogs for the 24 sources will be presented by Chary et al. (in preparation). For a galaxy the 24 emission corresponds to approximately an 8 m rest-frame measurement. For each galaxy in the redshift range we have derived bolometric infrared luminosities from the observed flux density at 24 and using the luminosity dependent SED libraries of Chary & Elbaz (2001) and Dale & Helou (2002). In practice, this is done by interpolating over the template SEDs, sorting the value of that corresponds to the observed 24 flux density. This determination of the bolometric IR luminosity implies a large extrapolation, as the m rest-frame luminosity is generally a small fraction of , and therefore the result is template-dependent. For this reason we also derived more direct 8 m rest-frame luminosities from the 24 flux density, using the model SEDs (from CE01 and DH02) only to K-correct the measurement from 24 observed to 8 m rest-frame luminosities (this K-correction is also template dependent but generally small in the probed redshift range, within a factor of 2). For the CE01 templates the relations between and is:
| (3) |
for , and
| (4) |
for ; while for the DH02 templates it is:
| (5) |
Here, and in the remainder of the paper, is at . The two relations give the same for , For higher the CE01 templates result in increasingly larger values of , up to a factor of 2.3 for . At the CE01 templates results in lower values with respect to DH02. For the range of interest in this work, the differences are always well within a factor of 2, also due to the two-slope dependence of the CE01 conversion.
3.2. Spitzer MIPS 70 imaging
The 70 data used here are a combination of all of the GOODS-N and GOODS-S available to us from the Spitzer programs ID-3325, -20147, -81, and -30948. The data were reduced following the techniques given in Frayer et al. (2006). These data represent 3 hours of integration over the full GOODS-N field and the central () region of GOODS-S. The outer regions of GOODS-S have an integration time of about 2 hours. The typical limit of these data is 1.8mJy at 70 in the deepest regions. Only 7 star forming galaxies are individually detected at 70 (6 of which are in GOODS-N, a likely effect of small number statistics). Therefore, we used stacking techniques to measure average properties of galaxies at 70 . Bright low-redshift sources were removed from the data to avoid biasing the stacking results. We convert the 70 flux densities into total IR luminosities again using the CE01 and DH02 template libraries. Being closer to the peak of IR SEDs, the conversion of observed 70 flux densities into is much less critical than for 24 , even at .
3.3. VLA 1.4 GHz radio imaging
For this work, we use new ultradeep 20 cm (1.4 GHz) imaging of the GOODS-N obtained at the VLA in various array configurations for maximizing the data quality and the dynamic range (Morrison et al., in preparation). Coadded to the previous radio data (mostly from Richards et al. 2000), the new data currently reach an rms of 4.5 Jy per beam over the field. We then assume a radio spectral index for deriving 1.4 GHz rest-frame radio luminosities from the observed flux density. The local radio-IR correlation (Condon et al. 1992; Yun, Reddy & Condon 2001) is used to estimate the bolometric IR luminosity from the radio luminosity:
| (6) |
Using radio luminosities to estimate for our sources implies assuming that the radio-IR correlation still holds at high redshift. The dispersion of the local radio-IR correlation can reach a factor of 2 for the most luminous sources (Yun et al. 2001), with luminosities comparable to those of the objects detectable at . The introduction of a K-correction term, to derive 1.4 GHz rest-frame flux densities from the observed ones, can introduce extra noise (or a bias) if the radio slope is different from the assumed value. This effect is likely smaller than the intrinsic dispersion seen locally, as a 10% error in the slope translate in a similar error in the intrinsic 1.4 GHz rest-frame flux density and therefore in the estimated .
In order to reach deeper radio flux densities, we stacked individually undetected sources using the following technique. We measured the average radio flux density level in a 1′′ radius aperture and correlated this measure to the total radio flux density using simulated radio sources of various flux densities (defining an aperture correction, about a factor of 1.4). By measuring a large number of empty regions in the radio image we estimated the rms fluctuations of this measure in order to associate an error to each measure. This allows us to recover radio flux densities of ultra-faint sources with an rms of 4.7 Jy per source, very close to the noise per beam. We used a 1′′ radius aperture, very close to the radio beam size, after testing a variety of apertures from 0.5′′ to 2′′, as it provides the best compromise between final S/N and the necessity to measure over a relatively large area in order to cope with possible coordinate misalignments. To statistically account for the coordinate mismatches (of order of 0.1–0.2′′). By applying this procedure to bright, individually detected galaxies based on the K-band prior position, and comparing the result to radio flux densities derived by direct fit of the profiles, we found that the radio flux densities required an average additional correction of 10%. All these measurements and errors take into account the primary beam correction for off-axis measurements. For obtaining stacking measurements of undetected sources we obtained weighted averages of the flux densities measured in this way.
3.4. SCUBA 850 m imaging
The GOODS-N field has been observed with the Submillimeter Common User Bolometer Array (SCUBA) at 850 m in a variety of programs, whose data have been merged together into a so-called super-map by Borys et al. (2003) and Pope et al. (2005). The depth of the submillimeter (submm) map is highly variable over the field. In D05b, we found that only one GOODS-N galaxy with is individually detected at 850m in the catalog described in Pope et al. (2006). When considering galaxies down to , as in the present work, we detect five objects at 850m. We note again here that we are excluding all submm galaxies (SMGs) that are individually detected in hard X-rays.
We obtained SCUBA 850 m stacking of individually undetected sources by estimating flux densities and errors from the super-map at the position of each program galaxy, and then proceeding as in D05b.
Using sub-mm flux densities at 850 m to infer bolometric luminosities () relies on assumptions for the long wavelength shape of the SED, i.e., on dust temperatures. For this work, we continue to use the SED shape templates of CE01 and DH02, derived from local correlations. The to conversion is to first approximation independent of redshift for the range explored here. However, the conversion is not perfectly linear. According to the CE01 templates, a ULIRG () would have a flux density of about 1 mJy at these redshifts, raising to about 4.6 mJy for a HyLIRG (). DH02 templates give % higher flux densities at a given , over the same regime of luminosities. The non linearity is due to the luminosity-temperature trend observed in the local Universe (less luminous galaxies harbor colder dust).
3.5. X-ray imaging
We use the catalog of X-ray detected sources of Alexander et al. (2003). All sources detected in the hard X-ray band were excluded from the SFR analysis in this paper as likely containing AGNs. SFRs can be derived from the soft band 0.5–2 keV fluxes (mapping closely to the 2–8 keV rest-frame band) at (see e.g., Ranalli et al. 2004, Persic et al. 2004, Hornschemeier et al. 2005), provided that no substantial AGN contamination is present at those energies. We have performed X-ray stacking of samples over the two fields. Results are presented in Paper II, as an assessment of the presence of AGNs is required for interpreting the X-ray stacking results.
3.6. UV based SFR estimates
Ongoing SFRs in galaxies are estimated using the UV luminosity, following the prescriptions in D04b. The 1500Å rest-frame luminosity is derived from the observed -band flux density, and a K-correction term is derived based on the redshift of each source (photometric or spectroscopic) and its UV spectral slope. Then L(1500Å) is converted into a SFR using Eq. 5 of D04b, i.e.:
| (7) |
The amount of dust reddening is estimated adopting a a Calzetti et al. (2000) reddening law (see also Meurer, Heckman & Calzetti 1998), and using the relation from D04b:
| (8) |
An attenuation of mag is then adopted to obtain dust-corrected SFRs from Eq. 8. With this procedure we obtain reddening corrected SFRs consistent to what derived with SED fitting (D04b) for the bulk of -selected galaxies.
Clearly, this technique is affected by several limitations. In applying a reddening correction (which median is a factor of for , galaxies), the technique assumes that the UV spectral slope is entirely due to reddening, rather then to the presence of evolved stellar populations. Therefore we expect it should only work for actively star forming galaxies. Even more importantly, it is well known that strongest starbursts are opaque to UV radiation and its total SFR activity cannot be reliably estimated solely from the UV, even after reddening corrections (e.g., Goldader et al. 2002; Buat et al. 2005). Things can be different though at higher redshifts, as shown later in the paper (see also Flores et al. 2004; D05b; Reddy et al. 2005).
3.7. IMF related effects
It is worth mentioning to which extent the analysis presented in this paper depends on the adopted IMF, i.e., a Salpeter (1955) IMF from 0.1 to 100 . All of the luminosities that we use as SFR indicators are sensitive to the population of high mass stars (), but the bulk of the mass in stars that is actually formed is dominated by lower mass stars. Therefore, changing the slope of the low-mass end of the IMF, e.g., adopting the IMF of Kroupa (2001) or Chabrier (2003) that are in better agreement with current observations, would just imply lower overall SFRs, i.e., different normalizations in Eqs. 1 and 7 and different stellar masses (by nearly the same factor). We prefer to quote numbers for Salpeter IMF for consistency with much of the literature in the field.
However, changing the intermediate or high-mass slope could have a significant effect on the relative conversions between different SF indicators, since stars in different mass ranges can be responsible for varying contributions to the different SF indicators. For example, the radio emission is thought to be powered by higher mass stars than the IR or the UV emission (e.g., Condon et al. 1992), and a steeper IMF slope at the high masses would systematically increase the IR/UV over radio luminosities. Timescale issues, e.g., observing a starburst very close to the beginning (Roussel et al. 2003) or a long time after the SFR peak, can also alter the luminosity ratios. Conceivably, IMF and star formation timescale are partly degenerate for some of the effects that we discuss later in the paper. We neglect timescale effects in the following of the paper.
3.8. Limiting depths and effect of photometric redshifts
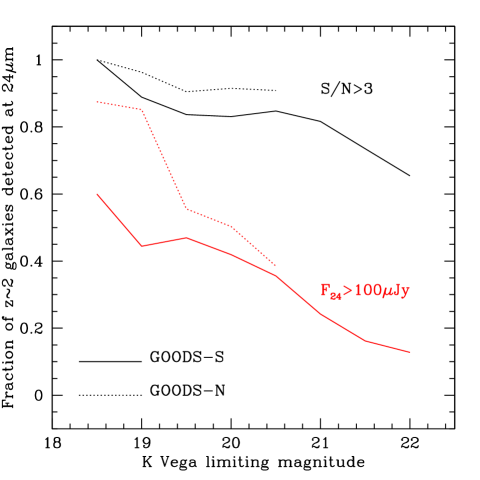
Fig. 3 shows the limiting sensitivity to bolometric IR luminosity from the various tracers using the recipes described in the previous sections (deep radio and SCUBA photometry are available only in GOODS-N). It is clear that the MIPS 24 flux density is the most sensitive IR tracer by at least an order of magnitude, allowing in GOODS to detect galaxies with for most of the redshift range considered here. This is illustrated in Fig. 4, showing that the fraction of galaxies in our sample detected at 24 remains very high, over 60% even at the limit of the GOODS-S field. Even lower SFRs can in principle be derived from the UV over the whole redshift range, provided there is no or just small dust obscuration. An unreddened galaxy at with AB (3 limit) would have SFR M⊙ yr-1. A more practical limit is given by the faintest galaxy detectable in the -band () having no dust reddening, which would have SFR yr-1 for , similar to the depth reached at 24 . In the case of galaxies with non zero dust reddening we can measure the SFRs only above higher limits. For example, a galaxy with and (the median value at the bright limits) would have SFR M⊙ yr-1 at (Fig. 3). It is therefore quite interesting to compare UV and 24 based SFR and estimates, given that these are the most powerful tracers, and available for nearly all of the galaxies in our GOODS sample.
The dependence of with redshift is generally steep, and varying as a function of redshift itself, except for SCUBA 850 m photometry. In turn, photometric redshift errors propagate into and SFR errors differently when different tracers are used. We note, however, that this is mitigated when considering the ratios of derived from two independent tracers, as is generally done in this paper. Even in this case, however, one can commit significant errors in cases of catastrophic redshift failures, e.g., if a galaxy at is mistaken to be at . In this case, the derived from the 24 or 70 data could be strongly overestimated relative to that derived from, e.g., 20 cm data or from the UV, due to the stronger K-corrections for the emission in the MIPS bandpasses. We take these effects into account when comparing the SFRs from different tracers. In general, the high quality of the adopted photometric redshift (see Fig. 1) should limit this problem to a small minority of cases. In addition, we use the extensive spectroscopic redshift sample to consolidate any conclusion first derived using the full combination of spectroscopic and photometric redshifts.
4. IR Bolometric luminosities from mid-IR, sub-mm and radio
4.1. Bolometric luminosities from the 24 flux densities
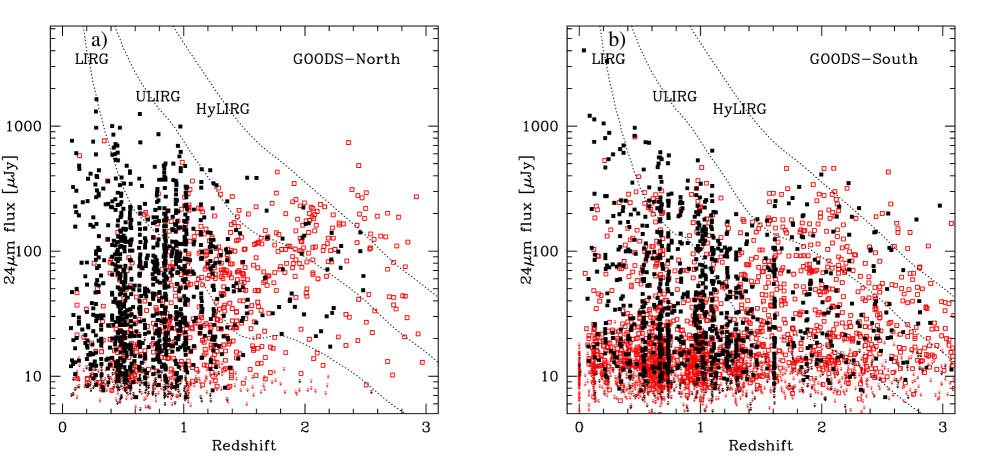
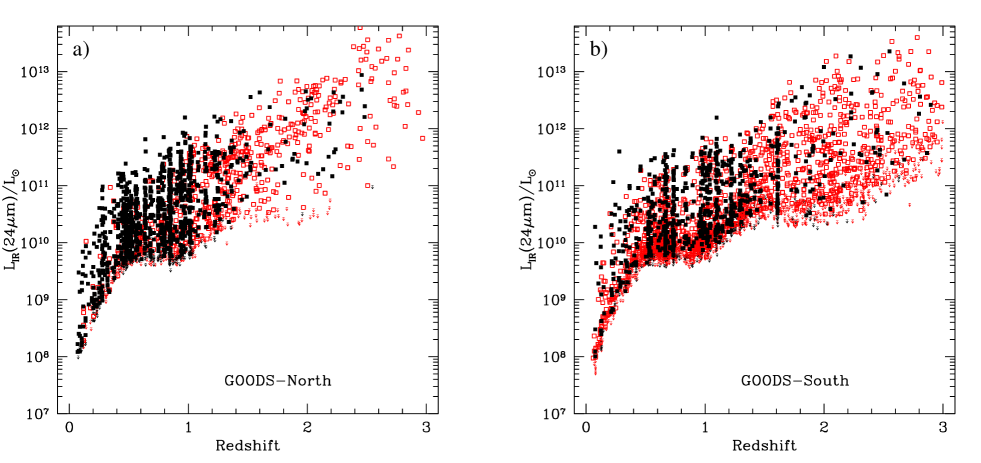
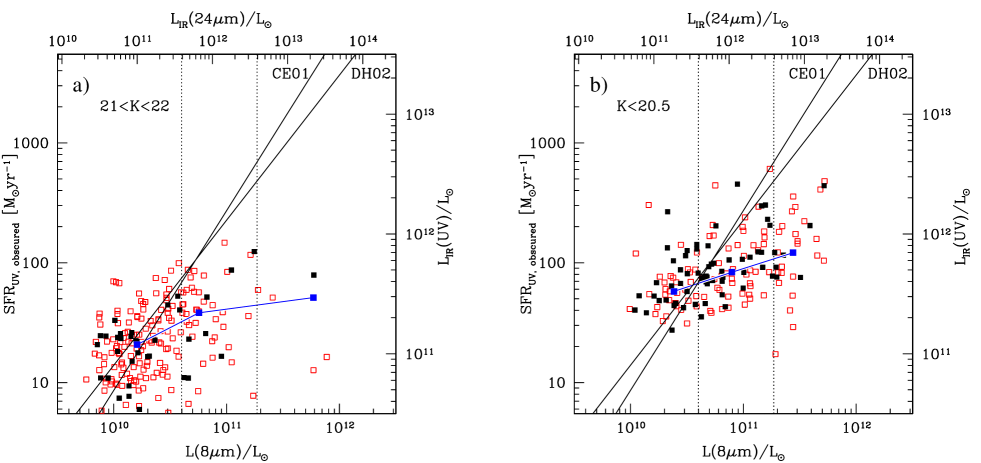
Fig. 5 shows the flux density versus redshift relation of MIPS 24 detected sources in the two GOODS fields, to the corresponding -band limit in each field. Fig. 6 shows the bolometric IR luminosity inferred from the 24 flux densities using the CE01 templates. From both sets of figures it is apparent that moving to higher redshifts sources with brighter and brighter are found, implying (after accounting for volume effects) a rapid brightening of the IR luminosity function (as already emphasized in the literature; e.g., Le Floc’h et al. 2005; Caputi et al. 2007). However, it is somewhat surprising that the rise extends all the way to redshift , and sources with and even appear in the GOODS fields (see Peres Gonzales et al. 2004; Papovich et al. 2006; Caputi et al. 2006 for similar results). If due to star-formation, these extreme luminosities would imply obscured SFRs up to 10000 yr-1. Such extremely high SFRs as inferred from 24 flux densities are somewhat suspicious, suggesting that the mid-IR light may not be entirely powered by star formation, or may be reflect different intrinsic mid-IR properties of these star forming galaxies, with respect to local sources.
4.2. MIPS 24 versus radio luminosities
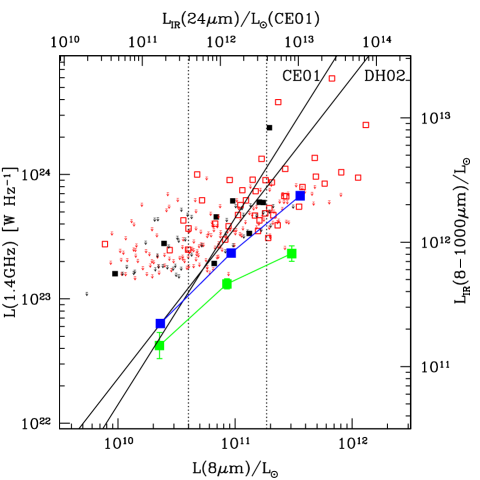
Bolometric luminosities derived from the 24 flux densities are compared to those derived from radio in Fig. 7, for GOODS-N galaxies. For radio detected sources (about 21% of the total sample to ) the average galaxy has and there is overall agreement between 24 and radio derived luminosities, for both CE01 and DH02 templates. However, a large scatter is present and there are galaxies with 24 to radio inferred ratios much different from unity in both directions. We will come back to these sources later in this section. For 94% (46/49) of the galaxies with , the radio detection (or limit) implies a higher estimated from 24 with respect to radio, using either CE01 or DH02 templates.
We used radio stacking in order to investigate trends for radio-undetected sources. Green symbols in Fig. 7 show the result for radio-undetected sources, stacked as a function of the 8 m rest-frame luminosity, in turn derived from the 24 flux density. Stacked flux densities are in the range of 3–7 Jy, comparable to or larger than the single beam noise, and the signal to noise of the detections is larger than 3 in all cases. The stacking emphasizes the existence of a substantial population of sources with where the estimated from 24 exceeds on average by an order of magnitude the same quantity derived from radio. When considering together radio detections and non-detections, we see a good agreement at low luminosities and an overall increasing discrepancy of higher with respect to both CE01 and DH02 templates. For [], the average overestimate is about a factor of 3. It can be noticed from Fig. 7 that radio limits move to higher in the right part of the plot. This corresponds to the fact that most of these putative HyLIRGs (from 24 ) tend to lie at higher redshift than average.
There are eight galaxies, spread over a range of mid-IR and radio luminosities, that on the contrary show a radio-derived bolometric luminosity that exceeds by a factor (and up to ) that inferred from . This could be due to additional radio emission from an AGN (despite non detection at X-ray wavelengths), as suggested also by Donley et al. (2007), mostly in lower redshift sources. Some sources might have 24 deficit, as expected in the case of very low metallicity (Engelbracht et al. 2005; Madden et al. 2006), or in the case of a strong 9.7 m silicate absorption entering the 24 bandpass. The latter case can happen for , and we do find that 6 out of the 8 galaxies are indeed at .
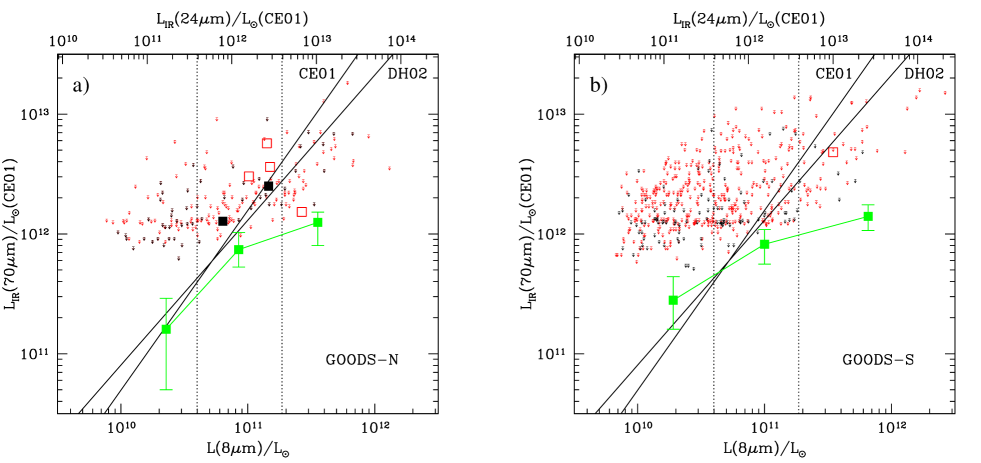
4.3. MIPS 24 versus MIPS 70
We have cross-checked this result using additional indicators. Fig. 8 panels show the comparison with luminosities inferred from the MIPS 70 flux densities from the survey of Frayer et al. (2006; and in preparation). In the area with available deep 70 imaging from Spitzer, about 200 arcmin2 from the two fields, there are only a handful of individually detected galaxies at . The 70 imaging has reached much shallower limits than the 24 data; however the non-detections are meaningful for the sources with higher as inferred from the 24 data and imply that from 24 is overestimated in those sources. Similarly to radio, we have performed stacking of galaxies at 70 in both GOODS fields, binning the individually undetected galaxies as a function of their 8 m rest-frame luminosities (see green boxes in Fig. 8). Again, the most notable feature is that sources with the brightest 8 m rest-frame luminosities are not correspondingly brighter at 70 , as would be expected on the basis of local templates. The average 70 to 24 flux density ratio is for sources with , and of for those with . Templates from CE01 and DH02 predict instead that the 70 to 24 flux density ratio at should steeply increase with intrinsic . A similar trend is found by Papovich by al. (2007) in galaxies.
Notice that contrarily to the radio case, for a given the 70 to 24 flux density ratio is fairly independent on the redshift, for a given template, in the range considered including , due to more similar K-corrections. Therefore these conclusions are relatively robust against uncertainties coming from photometric redshifts.
4.4. MIPS 24 versus SCUBA 850 m
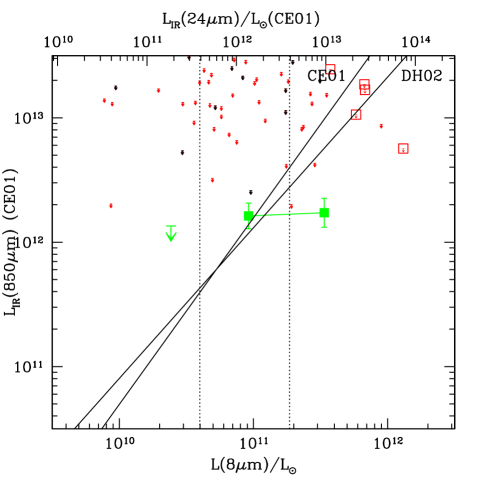
Finally, we have used the SCUBA super-map from Borys et al. (2003) in order to investigate the comparison of 850 m versus 24 inferred values for galaxies. Only 5 galaxies in the sample are individually detected, all at the highest luminosities. For 4 of them the bolometric luminosities inferred from the 24 and 850 m flux densities are in good agreement with expectations based on local templates, while in a single case the 24 flux density lead to overpredicting by over an order of magnitude compared to SCUBA. It is interesting to notice that this result is different from the findings by Pope et al. (2006) for 850 m selected galaxies, where for typical galaxies the 850 m flux density was in excess of what could have been predicted from the 24 flux density. Our 5 sub-mm detected galaxies represents actually a small part of the Pope et al. (2006) sample. The most likely explanation of the differences is that the sub-mm selection favors galaxies with relatively cold dust, as emphasized also in Pope et al. (2006).
We stacked 850 m undetected sources as a function of their m luminosities. We detect the intermediate and highest luminosity bins only, both with S/N=4 and mJy. This is consistent with the result presented in D05b and Knudsen et al. (2005) for SCUBA stacking of distant sources. This also confirms the result that for the most luminous 8 m rest-frame galaxies, the 8 m luminosity is in excess of what the local templates would predict given the of the galaxies estimated from other means. As to first order the 850 m flux density is independent of redshifts for IR luminous galaxies within the probed redshift range, finding the same 850 m for the two bins shown in Fig. 9 while their average m luminosity differers by a factor of testifies again for a large scatter in m to bolometric luminosity ratio for high- LIRGs and ULIRGs in our K-selected sample.
5. SFR from UV light: ’transparent’ ULIRGs at
D05b found that the UV estimated SFRs, averaged over the full sample of star forming galaxies with , was well within a factor of 2 of the average of the estimates derived from the radio, mid-IR, X-rays and sub-mm data. This suggested that –at least on average– UV is a a good tracer of star-formation for massive galaxies, as advocated e.g., also by Reddy et al. (2005). We investigate here to which extent this remains valid when considering individual galaxies.
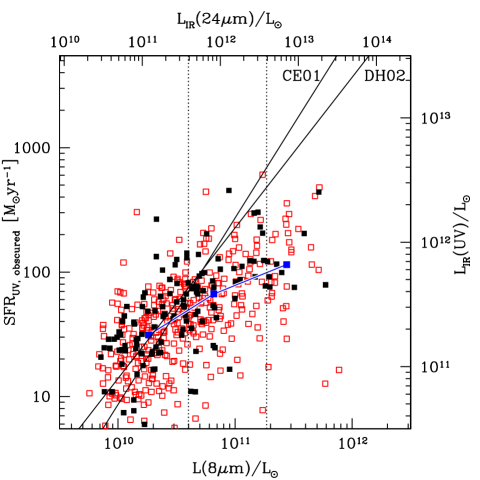
5.1. UV versus MIPS 24
Fig. 10 shows the UV estimate of the obscured SFR as a function of the 8 m rest-frame luminosities, for the GOODS-S field only where we reach much fainter star-forming galaxies. This quantity is defined as:
| (9) |
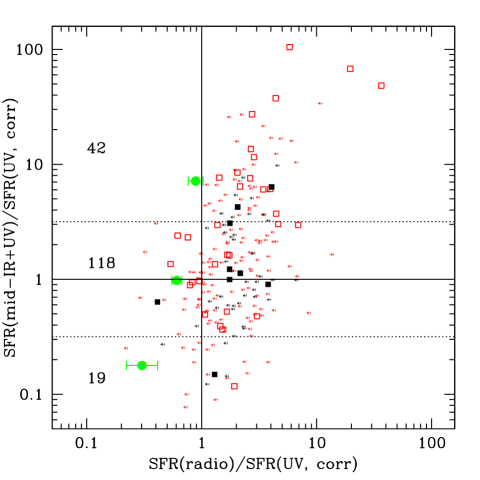
where the correction is for dust extinction, as described in Section 3.6. The term SFRUV,obscured is equivalent to SFRIR in Eqs. 1 and 2. Moreover, entering with this quantity into Eq. 1 and solving for one gets the expected infrared luminosity as due to the partial obscuration of the star formation and the reprocessing of its UV photons, i.e., , also plotted in Fig. 10. For this comparison we limit to sources detected at 24 and to galaxies where the color is well estimated, with total error below 0.4 mag (corresponding to a maximum acceptable error of a factor of 2.5 in the reddening correction to the SFR). At low 8 m rest-frame luminosities, there is a fairly good agreement between IR light (and SFR) estimated from UV and from the 24 flux density, which is within a factor of 2 for most galaxies. The two estimates start to diverge for , and by the UV underestimates the IR light by more than a factor of compared to the mid-IR. However, given the discussion in the previous section, it is not clear how often this is due to an underestimate of the obscuration of the UV light, or to an excess emission at 24 .
5.2. UV versus radio
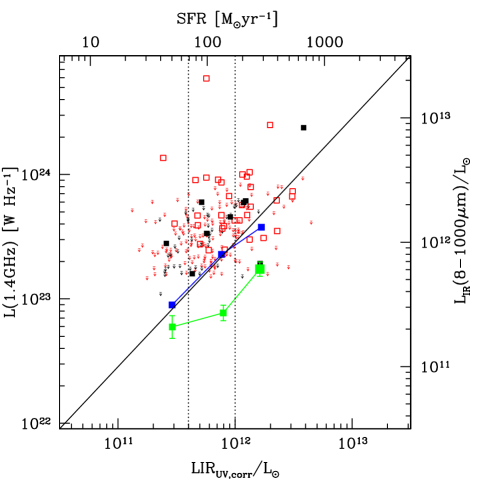
In order to further check the reliability UV-derived SFRs we compared UV-based estimates to radio observations. For radio detected sources (20% of the sample) we find that the median ratio between the IR luminosity estimated from the radio to that from the UV is about a factor of 2, as shown in Fig. 11. This is likely the effect of the limiting flux density in the radio, such that only the sources with brightest continuum are detected (i.e., the Malmquist bias). When stacking radio-undetected sources as a function of UV inferred , and considering together radio-detected and undetected sources, Fig. 11 shows that the ratio of UV to radio ’s appear to be very close to unity at all UV luminosities, within the errors. This implies that the UV-based SFR, corrected for dust reddening, is on average a good tracer of SFR even for the case of ULIRGs with .
On the other hand, there are also evidences of extreme obscuration at UV wavelengths. For 2-3 sources in the sample the UV underestimates by a factor up to 10–30 (some of these objects might be radio loud AGN, despite their non detection in the X-ray). For the most luminous sources with based on radio (a limit above which we should have a complete sample over GOODS-N) the median galaxy has UV underestimating by a factor of 2.7. For the typical (or median) ULIRG in our sample, however, the UV appears to provide a fairly good estimate of , with no systematic trend/offset with respect to the radio estimates. This is quite different from local ULIRGs, where the UV is known to underestimate by factors (Trentham et al. 1999; Goldader et al. 2002) even after correcting for dust extinction.
Similarly, for SMGs the UV underestimates SFRs by an average factor of 120 (Chapman et al. 2005). For the 5 galaxies in GOODS-N to that are detected by SCUBA at 850 m, the 3 objects where the UV slope can be estimated with relatively good S/N the ratio of radio- to UV-derived SFR is in the range between 3 and 35. For the other two objects, with a poorer quality UV-derived SFR, this ratio is also . As we are considering here a subsample of SMGs with bright near-IR magnitudes, it is likely that we are limiting to the least obscured sources in their class, hence these results appear to be consistent with Chapman et al. (2005).
All in all, there seems to be evidence that the typical ULIRG is fairly ’transparent’ to UV light, the word meaning that we can estimate its SFR given its rest-frame UV 1500Å luminosity and UV slope. However, at much brighter bolometric luminosities, well in excess of , the UV starts to saturate, as inferred from the brightest radio or sub-mm galaxies. There appears to be a shift of UV saturation level from about at to greater than a few at . This is in line with the overall rise of the SFR density of the Universe during these epochs.
Thus, it appears that the UV is on average performing well for the galaxies. However, for the discrepant cases with (see again Fig. 10) it remains unclear whether the discrepancy is due to excess obscuration or to an intrinsic 24 excess. To disentangle this ambiguity we have again used the radio as a diagnostic tool. In Fig. 12 we show the total SFR [from Eq. 2 using as input into Eq. 1] of the radio-derived SFRs, both normalized to the reddening corrected SFR from the UV. For the sources whose SFR derived from the 24 flux density exceeds by more of a factor of 3 that derived from the UV, we find that only –15% of them have a similar or larger excess also in the radio (and thus could be represent ULIRGs with anomalously high obscuration). For the majority of 24 excess objects, however, we find again that radio SFRs agree with UV SFRs, suggesting again that it is 24 flux density to be genuinely in excess also with respect to the UV luminosity.
5.3. Reliability of reddening correction and quiescent galaxies
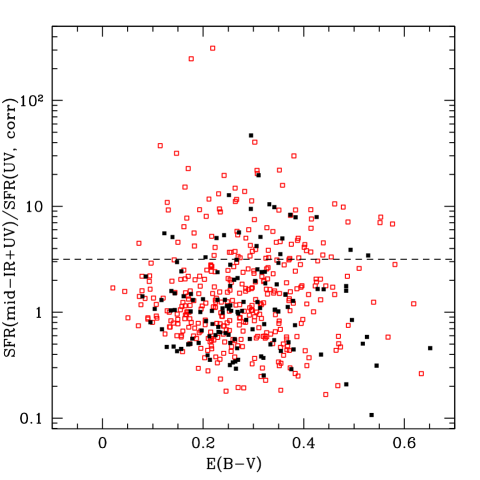
The discrepancies that have emerged from the comparisons in the previous sections lead to the question of how well we can correct UV luminosities for dust reddening, given the adopted reddening law, and if the mid-IR excess is somewhat related to dust reddening and UV slopes. Fig. 13 shows the ratio of “total” SFR as from Eq. 2 estimated from the mid-IR using the 24 flux densities over the UV-corrected SFR, as a function of the estimated reddening from Eq. 8. There appears to be no appreciable trend of a larger such ratio as a function of reddening. This implies that if excess obscuration is present over what corrected using the Calzetti et al. (2000) law, then the UV slope has to be very poorly correlated with such an excess obscuration. A grey obscuration would work, but all known dust absorbers are not grey. On the other hand, for the average galaxy, correcting the observed UV luminosities based on the UV slope and using the Calzetti et al. reddening law, allows us to obtain fairly robust SFR estimates, as indeed illustrated by Fig. 13.
There are a few galaxies where the reddening corrected SFR from the UV exceeds that derived from the mid-IR by more than a factor of 3. As opposed to 24 excess objects, Fig. 12 shows that in most of these cases it is the UV that is overestimating SFRs. These latter ones are mostly confined to the sources with reddest colors, and are likely galaxies in a post-starburst phase that are on their way to turn passive/quiescent. In these cases, the redness of the UV continuum is due to a dearth of young/massive stars rather than to dust reddening, and the SFR inferred from the UV, corrected for dust extinction following the recipes of Section 3.6, is obviously overestimated. These sources are intermediate cases between passive galaxies and star-forming ones, and similar to the two blue systems discussed in Daddi et al. (2005a). The fraction of these systems is fairly small, implying a rapid transition from the star-forming stage to the passive one. This is related to the possible presence inside samples of sources with passive or quiescent stellar populations, as emphasized by Grazian, Nonino & Gallozzi (2007) and Quadri et al. (2007). The 25% discrepancy between average radio and UV estimates of for the most luminous UV galaxies (see the blue points in Fig. 11) is completely solved by excluding these nearly quiescent sources (about 20% of the radio undetected galaxies in that bin). Clearly, MIPS 24 photometry is required to identify these likely post starburst galaxies, where the UV corrected for dust extinction provides an incorrect estimate of the ongoing SFR activity.
5.4. The nature of mid-IR excess galaxies
The results of the previous sections have clearly singled out the existence of a population of galaxies that we call mid-IR excess galaxies, for which the MIPS 24 flux densities would imply IR bolometric luminosities and SFR in excees to those implied by all other available tracers of star formation activity. We emphasize that the existence of these mid-IR excess galaxies is independent on the classes of templates used or on the particular recipe to convert an observed 24 flux density at into a measure of SFR/. The result shown in Figs. 7–10 can be read as evidence that at a fixed bolometric luminosity around there is a very large scatter of , and one can objectively define mid-IR excess galaxies as the galaxies with the largest observed for a givel .
Understanding and investigating the nature of these sources and the origin of the mid-IR excess has potentially far reaching implications. These aspects are directly developed in full in Paper II. In such paper we provide evidence indicating that mid-IR excess galaxies contain heavily obscured, often Compton Thick, AGNs. We then argue that the AGN energetic input is the most likely cause of the mid-IR excess in these galaxies.
6. Star formation rates in galaxies: a recipe
We summarize the work described in the previous sections by suggesting a recipe for obtaining the best estimates of SFRs for samples of galaxies, by exploiting a variety of multiwavelength SFR indicators as available in GOODS (and many of the current surveys, although to less deep levels, such as e.g., in COSMOS, Scoville et al. 2007). This procedure assumes that galaxies hosting relatively unobscured and luminous AGN have been eliminated from the sample, e.g,. by means of deep X-ray imaging.
-
1)
Compare UV-derived SFRs (SFR), obtained as described in Section 3.6, to the ones obtained from the 24 m flux density, using the CE01 or DH02 templates. For the sources where SFR and SFR agree within a factor of (Fig. 12), use the 24 m based SFR plus the UV-based SFR uncorrected for reddening (i.e., SFR) as the best estimate for the galaxy SFR. These sources are called mid-IR normal star forming galaxies.
-
2)
For the sources where SFR is lower than about one third of SFR, use only the 24m based SFR (SFR) as the best estimate. These sources are not likely to have the UV/optical light dominated by young massive stars, and are probably quiescent or post starbursts (Fig. 12).
-
3)
In the cases where SFR is larger than about 3 times SFR, i.e., for mid-IR excess galaxies, use SFR as the best SFR indicator, as it is likely that there is a contribution to the 24 m flux density from other than star formation. Availability of deep radio imaging and/or submm/mm imaging, can allow one to identify the subsample of galaxies among these that are actually opaque to UV light, and longer wavelength estimates of SFR are to be used in the latter.
To our understanding these recipes makes the best possible use of the multiwavelength database currently available, in order to cope with the limitations of each individual star formation indicator. In particular, they are meant to single out those sources where a particular method is bound to fail, e.g., because the UV slope reflects age rather than reddening effects, or the mid-IR output is partly powered by an AGN.
In principle, the similarity in the trends observed in Fig. 7–10 could suggest to define modified, highly non linear relations between 8 m luminosities and for galaxies, as suggested also by Papovich et al. (2007), for recovering corrected for all galaxies. However, Fig. 14 shows that in practice any such relation would be dependent on the sample properties itself, e.g. shifting as a function of -band magnitude, and therefore not well defined in general.
7. Implications
In this section, we exploit the results presented so far, and in particular the improved SFRs for our sample of star-forming galaxies at , in order to address a number of issues which are relevant for our understanding of the nature of star-formation and mass assembly in such galaxies.
7.1. The cosmic evolution of ULIRGs
As already shown by D05b (see also Papovich et al. 2006; Reddy et al. 2006a; Caputi et al. 2007), the typical massive ( yr-1) star-forming galaxy at is a ULIRG, i.e., it appear to have or more. Here, we provide a more detailed estimate of the space density of ULIRGs using multiwavelength information. In GOODS-N there are 113 galaxies that are classified as ULIRGs based on their 24 m flux densities, 58 based on UV SFRs, and 45 based on radio emission (or up to 69 if considering the undetected radio sources with limits still consistent with the ULIRG regime). Similarly, in GOODS-S there are 155 s classified as ULIRGs from their 24 m flux densities, and 50 from the UV SFRs. At luminosities of the mid-IR starts to be systematically in excess of radio (Fig. 7), and therefore ULIRG densities derived from MIPS 24 data are likely to be overestimated. We notice however that the number of ULIRGs inferred from MIPS 24m emission does not increase appreciably when moving from the sample with in GOODS-N to the one limited at in GOODS-S. On the other hand, there can be some sources that are not classified as ULIRGs in the UV due to obscuration. Also, the radio flux density limits over this redshift range are very close to the ULIRG detection threshold, and hence a radio-based estimate could be somewhat incomplete. Therefore, we average the UV/radio and MIPS estimates to derive ULIRG space densities at . Combining GOODS-N (154 arcmin2) and GOODS-S (140 arcmin2 used in this work), and correcting the ULIRG counts to compensate for the fact that we are including only sources not blended in the IRAC images, we finally derive a sky density of ULIRGs of 0.6 arcmin-2. Using the comoving volume within (Fig. 2), this implies a space density of Mpc-3. The uncertainty in this density is order of 0.2 dex, when accounting for the scatter in the ULIRG counts from the different tracers, as mentioned above. We note that we have excluded galaxies with hard X-ray detections from this analysis as likely hosting AGNs. If we use the 24m emission for the X-ray AGNs to estimate , the sample of ULIRGs increases by 15-20%, thus still within the range of uncertainties estimated above. The space density of ULIRGs at is a factor of 1000 larger than in the local Universe (e.g., Sanders er al. 2003), confirming the previous estimate of D05b.
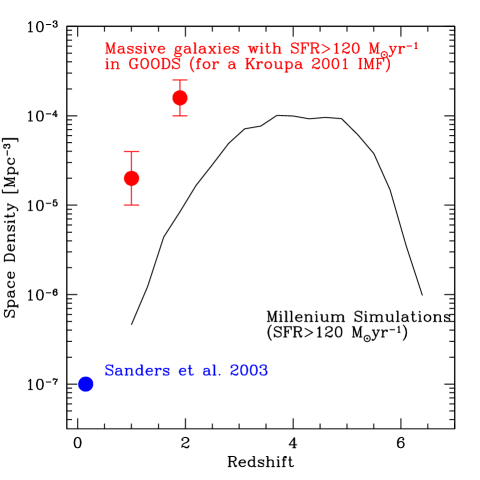
In a similar way, we derive the space density of ULIRGs in GOODS at , taking galaxies with (using photometric and spectroscopic redshifts) and estimating using 24 flux densities. We find only 7 such sources in the combined GOODS, which implies a space density of , an order of magnitude lower than that at .222Adding hard X-ray detected galaxies only marginally increases the estimated ULIRG space density also at .
In Fig. 15 we compare these results to predictions from the Millennium simulation of galaxy formation (Springel et al. 2005). We use the lightcones based on semianalitic models presented by Kitzbichler & White (2007). For a Kroupa et al. (2001) or Chabrier (2003) IMF the ULIRG regime corresponds to a star-formation rate of 120 yr-1, lower than the rate reported in Eq. 1 for a Salpeter IMF. We considered all simulated galaxies with SFR above this threshold as ULIRGs. We explicitly quote here results for the Kroupa (2001) and Chabrier (2003) IMFs because these are favored by observations in the local Universe and therefore more appropriate for comparison to predictions of SFRs in galaxies. The model underpredicts the space density of ULIRGs at both and by at least an order of magnitude. Only at higher redshifts, , do the Millennium models predict a ULIRG space density as large as that which we observe at . This suggests that star-formation in massive galaxies occurs too early in the simulations, or was terminated too early due to the adopted truncation of SFR from AGN feedback (e.g., Croton et al. 2006). However, we reach similar conclusion when comparing to simulated galaxy catalogs based on the model of Oppenheimer & Davé (2006), which also predicts a comparably large space density of ULIRGs only at .
7.2. Counts of passive galaxies
One possible means for reconciling the models with the observations would be to delay star-formation until later epochs. Therefore, it is important to compare observations and model predictions for the abundance of passive, non-star-forming galaxies at . In fact, the feedback from AGNs has been implemented in the Millennium models in order to allow them to reproduce the existence of passive and massive galaxies both at high and low redshifts (de Lucia et al. 2006). The Oppenheimer & Davé (2006) models, lacking the crucial mechanism of AGN feedback, predict very low space density of passive galaxies at 1–2, much below the observed density.
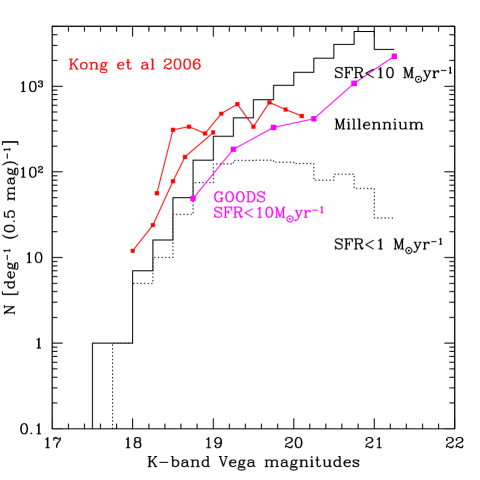
In Fig. 16 we show the number counts of passive () galaxies from Kong et al. (2006). These objects, selected according to the criteria defined in D04b, are expected to provide a fair census of the population of passively evolving systems (see, e.g., Daddi et al 2005a; Arnouts et al. 2007). In GOODS the B-band data are not deep enough to reliably distinguish passive from star-forming galaxies using the color definition of D04b. However, we may approximate this by using the number counts of GOODS galaxies that have SFR yr-1 based on the 24 measurements. As we have shown in Fig. 3, the MIPS 24 observations are very sensitive for detecting low rates of star formation, and in particular to identify galaxies with red UV slopes but relatively low SFRs (Fig. 12). The counts of galaxies with SFR yr-1 from the combined GOODS N&S fields are shown in Fig. 16. These are lower than the counts of Kong et al. (2006), most likely due to cosmic variance, as these sources are very strongly clustered (Kong et al. 2006). The larger COSMOS survey may provide more robust statistics on the abundance of passive galaxies, although we note that the 24 data in COSMOS (Sanders et al. 2007) are shallower and cannot set such tight constraints on low SFRs at .
Overall, the Millennium simulations predictions, shown in Fig. 16, seem to reproduce the data reasonably well, given the large uncertainties, perhaps somewhat overestimating the counts of galaxies with relatively low SFRs.
7.3. The duty cycle of ULIRGs
The Millennium models might under-predict the ULIRG space density if the star formation episodes were short lived, so that the peak SFR is missed caught when averaging over the simulation time steps (250 Myr at for the evolution of the dark matter, with much finer steps for physical processes computed in the semi-analytic models). It is therefore important to try to constrain the duration of the phase at high redshifts. This is also relevant in order to evaluate the contribution from this star-formation mode to the assembly of stars in massive galaxies. In D05b it was suggested that duty cycles are high, based on the very large detection rate and brightness of the most massive galaxies at 24 . Caputi et al. (2006) agree with this conclusion, based on their 24 study of galaxies in GOODS. We investigate this point in more detail here, in the light of our new results on the comparison of the different star formation estimators.
In order to do this, we consider a mass– and volume-limited sample of galaxies, and evaluate the fraction of ULIRGs in the sample. If ULIRGs stopped forming stars, they would remain in the mass-selected sample as passive or slowly star-forming galaxies. The fraction of ULIRGs in this mass-selected sample is therefore a lower limit to their duty cycle, as the ULIRG phase could have started well before the galaxies reached the required mass threshold, or at an earlier era, before the redshift boundary of the sample considered here.
To build a mass-limited sample of galaxies, we consider all of the galaxies, including both star forming and passive galaxies. The latter were excluded for the analyses in previous parts of the paper. We use the empirical mass estimate described in D04b that is based on detailed SED fitting results with the Bruzual & Charlot (2003) models performed by Fontana et al. (2004). This calibration allows us to associate a mass to each galaxy based on its K-band magnitude, with a correction for varying ratio based on the observed color. Maraston et al. (2006; 2007) have shown that for passive galaxies, where the overall SED is dominated by –1 Gyr old stars, the use of the Maraston (2005) model libraries results in masses that are smaller by 0.2–0.3 dex (see also Bruzual 2007). For star-forming galaxies, where the young stellar component dominates the light, we find (Maraston et al., in preparation) that the Maraston models provide ratios that are consistent on average with those from Bruzual & Charlot (2003).
In the sample constructed in this manner, we find 34 galaxies at in GOODS-S and in GOODS-N. Only 1/34 of the GOODS-S galaxies above this mass threshold has , which suggests that the sample is fairly complete also in the GOODS-N to this limit. The space density of massive galaxies with is about Mpc-3. This estimate is within a factor of of the one reported by van Dokkum et al. (2006) using the larger MUSIC survey, despite the different methods for estimating stellar masses.
In order to estimate SFRs, we use both MIPS 24 and the UV luminosities corrected for reddening. While we have shown that SFRs inferred from 24 are suspect if they are substantially larger those derived from the UV data, the MIPS data are also very efficient for measuring relatively low SFRs in red galaxies where UV-reddening estimates would be in turn overestimated (see Fig. 12). Therefore, the MIPS data are ideal for isolating the most quiescent galaxies even in the case that some low level residual SFRs place these sources in the star forming region.
By taking the minimum SFR for each object, estimated from either the 24 flux density or from the extinction–corrected UV luminosity, we find that the fraction of ULIRGs among the most massive galaxies at is % (Poisson counting error only). This very conservative estimate sets a similar constraint on the duty cycle of the ULIRG phase in massive high- galaxies, i.e., 40%. The cosmic time span elapsing during the redshift range is about 2 Gyr, with only 1 Gyr per galaxy available on average (given the reasonably flat redshift distribution within these limits). This implies that these ULIRG phase will last for at least some 400 Myr, one order of magnitude longer than what is currently estimated for SMGs at similar redshifts, or for local ULIRGs (see, e.g., Greve et al. 2005; Tacconi et al. 2006; although see also Swinbank et al. 2006).
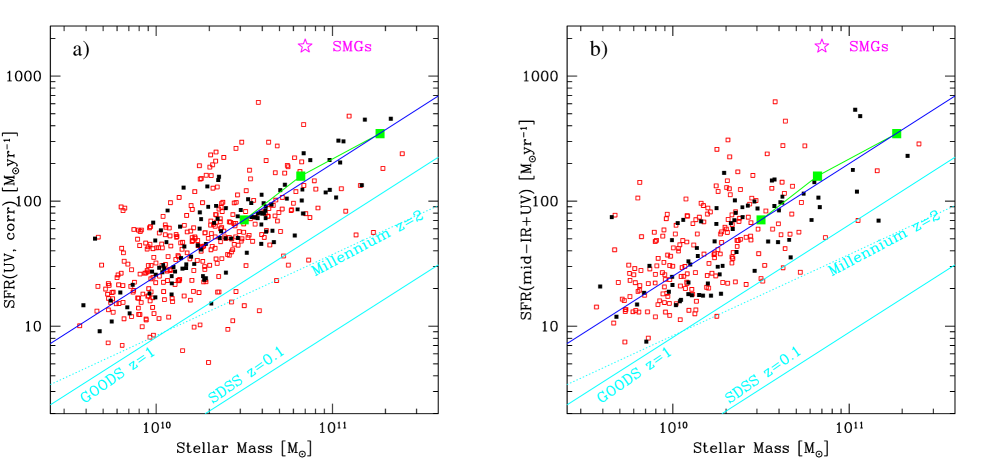
7.4. The star formation mass correlation at
We can gain further insights on the nature of star-formation at by examining correlations between galaxy mass and star formation rates. Recently, Noeske et al. (2007) and Elbaz et al. (2007) have shown that star formation and stellar mass define a tight correlation (0.2 dex scatter) in galaxies at , with rough proportionality (logarithmic slope of 0.9). Similar proportionality is also seen at in data from the Sloan Digital Sky Survey (Elbaz et al. 2007), although with a lower normalization reflecting the overall decline in cosmic SFR density with time.
Fig. 17 (left panel) shows the SFR- stellar mass relation for galaxies at in GOODS-S using the UV to derive SFRs. In this plot, we show only those sources with MIPS detection, with 24 -derived SFR not less than 1/2 of the UV one (to avoid estimating SFR from UV for evolved galaxies, see Fig. 12) and with a well-defined UV slope for obtaining an accurate reddening estimate. We find that a proportionality with a logarithmic slope of 0.9 (blue line in Fig. 17), normalized to the median SFR/M∗ ratio of the sample (2.4 Gyr-1), provides a good fit to the data, with semi interquartile range of only 0.16 dex in the SFR/M ratio. We have cross-checked the validity of this relation in GOODS-N using the deep radio observations. We have divided the galaxies (limited to , a smaller range than what plotted in Fig. 17) in 3 independent mass ranges and obtained the average SFR in the bin using the radio, averaging together radio detections and non detections. The green points in Fig. 17 show that the star formation results from the stacked radio emission agree very well with the relation that we derive from the UV light. This check is important because it is based on an indicator that should, in principle, be more solid than UV, and also because it allows us to include many of the massive galaxies for which UV SFR could not be estimated due to their faintness in the optical bands.
Due to the substantial presence of mid-IR excess objects at , we do not expect that this relation can be accurately recovered using the 24 inferred SFRs. This explains why Caputi et al. (2006b) find a much looser correlation between SFR and masses for galaxies. If we use 24 inferred SFR only for those galaxies where this quantity is within a factor of 3 of the UV one (the mid-IR normal objects), we obtain a SFR-mass correlation fully consistent with that based on UV (Fig. 17, right panel).
The correlation appears to have a slope similar to that at lower redshifts. Instead, the normalization at is a factor of 3.7 larger than that at , and 27 times larger than at (Elbaz et al. 2007; Noeske et al. 2007). At fixed stellar mass, star forming galaxies were much more active on average in the past. This is most likely due to a larger abundance of gas, depleted with passing of time.
The inferred correlation is quite tight, with semi interquartile range of only 0.16 dex in the dispersion of specific SFRs. We caution that, having used mainly the UV as a SFR estimator, we cannot reliably rule out the presence of a larger number of outliers at low stellar masses, for which we might strongly underestimate the SFR from the UV. These cannot be reliably identified to meaningful depths with radio data (due to the flux density limits of current observations), nor at 24 (due to the existence of mid-IR excess sources). We will have to wait for Herschel and ALMA to address this issue accurately.
Submillimeter-selected galaxies are strong outliers to this trend, however. Tacconi et al. (2006) estimate that SMGs in their sample have typically and dynamical masses (see also Greve et al. 2005 for similar results). For a given stellar mass (assuming that most of the dynamical mass in the central regions of SMGs is stellar), SMGs are forming stars at a 10x or larger rate respect to ordinary massive star forming galaxies. Their space density is also approximately an order of magnitude smaller. SMGs at appear to be like LIRGs and ULIRGs at , i.e., relatively rare objects and outliers of the mass-SFR correlation (see Elbaz et al. 2007). To this regard, it is not surprising that much shorter star formation duty cycles and lifetimes have been inferred for SMGs and local ULIRGs (Myr; Greve et al. 2005; Solomon & Vanden Bout 2005). These represent short-lived stages of the life of galaxies, due, e.g., to ongoing mergers or some temporary perturbations (see, e.g., Dannerbauer et al. 2006 for a discussion). ULIRGs and SMGs also generally have smaller physical sizes (Tacconi et al. 2006) than those of more ordinary massive, star-forming galaxies at (D04a; Ravindranath et al. 2007, in preparation), suggesting that the SMGs are in more advanced merger states.
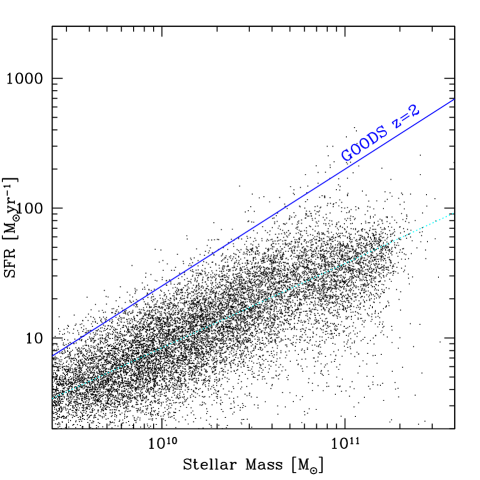
We have used the mock lightcones from Kitzbichler et al. (2007), based on the Millennium simulations, to explore the comparison of mass and SFR at in these models (Fig. 18). As emphasized already by Finlator et al. (2006) theorethical simulations quite naturally predict the existence of correlations between galaxies SFRs and stellar masses. However, we find that at fixed stellar masses, the model galaxies are forming stars at about 1/4 of the observed rate for galaxies with . The correlation is also substantially tilted, with decreasing specific SFR at larger masses. It seems that a major change required for models would be to increase the star-formation efficiency (and thus the typical SFR) at all masses for star-forming galaxies at redshifts , while still keeping the current proportion of massive galaxies in a passive/quiescent state. Interestingly, we find that if we reproduce Fig. 18 plotting simulated Millennium galaxies at instead of , we find that simulated galaxies match the GOODS galaxies quite accurately, with the same SFR versus mass normalization, slope and with similar scatter. This again reinforces the idea that SFR and mass growth happens too early in the current version of the simulations.
The observed mass-SFR correlation defines a more basic dichotomy of galaxy properties than those based on colors, as emphasized also by Elbaz et al. (2007). In future papers, we will investigate other physical properties of galaxies (like morphology) as a function of their distance from the correlation. Finally, we note that the trend of SFR increasing with galaxy mass, and the fact that star formation is sustained with long duty cycles, formally imply very rapid growth of the stellar mass during the period spanned by the observations. We confirm the conclusions of D05b, that the epoch within corresponds to the major build-up period of the most massive galaxies in the local Universe.
8. Summary and conclusions
We have investigated the properties of K-selected, star forming galaxies at in the GOODS fields, by means of over 1000 galaxies with , several hundred of which have measured spectroscopic redshifts. We have used the deepest observations at a variety of wavelengths, including radio, Spitzer 24 and 70 , SCUBA 850 m and UV light, in order to derive and compare multiwavelength luminosities of galaxies, and to investigate the reliability of these luminosities for measuring star formation rates. Our findings can be summarized as follow:
-
•
For most galaxies with moderate mid-IR luminosities, , Spitzer 24 measurements can be used to estimate total infrared luminosities and star formation rates of galaxies at . The ratios of the mid-IR luminosities to those at other wavelengths (radio, 70 , 850 m and even reddening-corrected UV light) are consistent with expectations from local correlations, provided that their mid-IR luminosities is not too large.
-
•
However, most galaxies with – show a mid-IR excess with respect to all other luminosities, compared to that expected from local correlations, and on ratios observed in less luminous galaxies. We therefore report the discovery of a large population of galaxies with intrinsic mid-IR excess. We investigate the nature of these sources in a companion paper (Daddi et al. 2007; Paper II hereafter), concluding that these objects contain heavily obscured, often Compton thick, AGN.
-
•
The presence of galaxies with seemingly extreme yr-1 estimated from 24 flux densities is nearly always due to the existence of these mid-IR excess sources. A large proportion of 24 sources at detected in Spitzer surveys shallower than GOODS will be mid-IR excess objects, and their star formation rates and infrared luminosities may be greatly overestimated if bolometric corrections from local starburst galaxy templates are applied. The true SFR of these objects rarely exceeds a few hundred yr-1.
-
•
For typical galaxies, observed at fainter 24m flux densities, the local correlations among the SFR tracers that we have probed here still hold within the uncertainties.
-
•
The observed UV luminosity, corrected for dust reddening based on the observed UV slope using a Calzetti et al. (2000) extinction law, allows one to obtain reliable estimate of the SFR activity for a large majority of galaxies. This is demonstrated in comparison with mid-IR estimates (except for sources with intrinsic mid-IR excess), and with radio, 70 and 850 m observations through stacking in bins of UV and mid-IR luminosity. The typical ULIRG at is ’transparent’ to UV light, contrary to present–day ULIRGs and to SMGs.
-
•
As exceptions, we do find a minority of galaxies which appear to be opaque to UV emission from star formation. Even after correction for dust reddening, the SFR derived from the UV light in these objects is underestimated by large amounts. These objects are similar to SMGs, and given the depths of current GOODS multiwavelength data, they are best recognized as highly obscured outliers by comparing their UV and radio properties.
-
•
Similarly, there is a small population of K-selected sources that are classified as star forming galaxies based on optical-UV colors (e.g., with the diagram) but for which the UV estimates of SFR greatly overpredict the true amount of SFR. These are probably post-starburst galaxies, whose red UV colors are not only due to dust reddening, but also have important contributions from intrinsically cooler, lower-mass stars. Also these objects can be identified from the comparison of UV and mid-IR based SFRs.
-
•
Exploiting all available SFR estimators, we have derived a measure of the space density of ULIRGs at in the GOODS fields. We find a space density of about Mpc-3 and a sky density of 0.6 arcmin-2 at . This is a factor of 10 larger than the abundance predicted by semianalitic models based on the Millennium simulations.
-
•
Similarly, we have used our improved understanding of SFR tracers to investigate the abundance of massive galaxies with low ongoing SFR (below 10 yr-1). We have computed number counts of these galaxies as a function of their K-band magnitude, and find that the counts are lower than that of passive () objects selected by Kong et al. (2006), likely due to cosmic variance and possibly to some contamination of samples from dusty galaxies. Predictions based on the Millennium simulations can reasonably well account for the space density of these galaxies.
-
•
We have built a mass-limited sample of galaxies with at . By estimating the distribution of SFRs in these galaxies, we derive lower limits to the duty cycle of ULIRGs. This is defined as the fraction of ULIRGs inside the mass-limited sample. We conclude that this duty cycle is at least 0.4. This is much larger than the duty cycle estimated for local ULIRGs, and also for SMGs. The relatively large duty cycles imply SFR duration at ULIRG levels of order of 0.5 Gyr or more. This also implies that large gas reservoirs have to exist in most of the massive galaxies, or that gas must be accreted very efficiently over time.
-
•
We have found that a relatively tight stellar mass-SFR relation is already in place at , for star forming galaxies detected at 24 , with a scatter (semi-interquartile range) of only 0.16 dex in the specific star formation rate. This has been derived mainly basing on the UV estimates of SFRs, and confirmed through radio stacking of galaxies in mass bins and using SFRs derived from the 24 flux density, once mid-IR excess objects are excluded from the sample. The typical star forming galaxy at is forming stars more rapidly by factors of 3.7 and 27 respect to an object with similar mass at and . Current numerical simulations are able to reproduce the mass-SFR correlation with similar slope and similarly small scatter to what observed, but with much lower normalization than the observed one.
-
•
We conclude by suggesting that current realizations of galaxy formation models could come to fairly good agreement with the observations available for galaxies if, by some means, the major periods of star formation activity could be delayed until later epochs than in current implementations.
References
- (1) Alexander, D. M., et al. 2003, AJ, 125, 383
- (2) Armus L., Charmandaris V., Bernard-Salas J., et al., 2006, astro-ph/0610218
- (3) Arnouts S., Walcher C.J., Le Fevre O., et al., 2007, submitted to A&A (arXiv:0705.2438)
- (4) Borys C., Chapman S., Halpern M., Scott D., 2003, MNRAS, 344, 385
- (5) Bruzual, G. & Charlot, S. 2003, MNRAS, 344, 1000
- (6) Bruzual G., 2007, Proceedings of the Meeting ”From Stars to Galaxies: Building the Pieces to Build Up the Universe”, eds. A. Vallenari, R. Tantalo, L. Portinari, and A. Moretti, ASP Conf. Ser. (in press) (astro-ph/0702091)
- (7) Buat V., et al., 2005, ApJ, 619, L51
- (8) Caputi K.I., et al., 2006a, ApJ, 637, 727
- (9) Caputi K.I., et al., 2006b, ApJ, 454, 143
- (10) Caputi K.I., et al., 2007, ApJ, in press (astro-ph/0701283)
- (11) Calzetti D., Armus L., Bohlin R. C., et al., 2000, ApJ, 533, 682
- (12) Chabrier G., 2003, ApJ, 586, L133
- (13) Chapman, S. C., Blain, A. W., Smail, I., & Ivison, R. J. 2005, ApJ, 622, 772
- (14) Chary R., Elbaz D., 2001, ApJ, 556, 562 (CE01)
- (15) Coleman, G. D., Wu, C.-C., & Weedman, D. W. 1980, ApJS, 43, 393
- (16) Condon J. J., 1992, ARA&A, 30, 575
- (17) Croton D. J., et al., 2006, MNRAS, 365, 11
- (18) Daddi E., Cimatti A., Renzini A., et al., 2004a, ApJ, 600, L127 (D04a)
- (19) Daddi E., Cimatti A., Renzini A., et al., 2004b, ApJ, 617, 746 (D04b)
- (20) Daddi E., et al., 2005a, ApJ, 626, 680 (D05a)
- (21) Daddi E., Dickinson M., Chary R., et al, 2005b, ApJ, 631, L13 (D05b)
- (22) Daddi E., Alexander D.M., Dickinson M., et al., 2007, ApJ in press (arXiv:0705.2832) (Paper II)
- (23) Dale D.A., Helou G., 2002, ApJ, 576, 159 (DH02)
- (24) Dale D.A., et al., 2005, ApJ 633 857
- (25) Dannerbauer H., et al., 2006, ApJ, 637, L5
- (26) De Lucia G., Springel V., White S. D. M., Croton D., Kauffmann G., 2006, MNRAS, 366, 499
- (27) Dickinson M., Papovich C., Ferguson H. C., Budavári T., 2003, ApJ, 587, 25
- (28) Elbaz D., Cesarsky C.J., Chanial P., et al., 2002, A&A, 384, 848
- (29) Elbaz D., Daddi E., Le Borgne D., et al., 2007, A&A in press (astro-ph/0703653)
- (30) Engelbracht C. W., et al., 2005, ApJ, 642, L127
- (31) Finlator K., Davé R., Papovich C., Hernquist L., 2006, ApJ, 639, 672
- (32) Flores H., Hammer F., Elbaz D., Cesarsky C. J., Liang Y. C., Fadda D., Gruel N., 2004, A&A, 415, 885
- (33) Fontana A., et al., 2004, A&A, 424, 23
- (34) Fontana A., et al., 2006, A&A, 459, 745
- (35) Förster Schreiber N. M., Roussel H., Sauvage M., Charmandaris V., 2004, A&A, 419, 501
- (36) Förster Schreiber N. M., van Dokkum P. G., Franx M., et al., 2004, ApJ, 616, 40
- (37) Franceschini A., et al., 2006, A&A, 453, 397
- (38) Frayer D.T., Huynh M.T., Chary R., et al., 2006, ApJ, 647, L9
- (39) Giavalisco M., Ferguson H.C., Koekemoer A., et al., 2004, ApJ. 600, L93
- (40) Goldader, J. D., Meurer, G., Heckman, T. M., Seibert, M., Sanders, D. B., Calzetti, D., & Steidel, C. C. 2002, ApJ, 568, 651
- (41) Grazian A., Fontana A., de Santis C., et al., 2006, A&A, 449, 951
- (42) Grazian A., Nonino M., Gallozzi S., 2007, A&A in press (astro-ph/0701233)
- (43) Greve T. R., et al., 2005, MNRAS, 359, 1165
- (44) Hornschemeier A. E., Heckman T. M., Ptak A. F., Tremonti C. A., Colbert E. J. M., 2005, AJ, 129, 86
- (45) Kennicutt R. C., 1998, ARA&A, 36, 189
- (46) Kitzbichler M.G., White S.D.M., 2007, MNRAS, 376, 2
- (47) Knudsen K. K., et al., 2005, ApJ, 632, L9
- (48) Kong X., Daddi E., Arimoto N., et al., 2006, ApJ, 638, 72
- (49) Kroupa P., 2001, MNRAS, 322, 231
- (50) Kurk J. D., Cimatti A., Daddi E., et al., 2006, to appear in the proceedings of ”Infrared Diagnostics of Galaxy Evolution”, Pasadena, November 2005 (astro-ph/0604132)
- (51) Le Fèvre O., et al., 2004, A&A, 428, 1043
- (52) Le Floc’h E., et al., 2005, ApJ, 632, 169
- (53) Madden S. C., Galliano F., Jones A. P., Sauvage M., 2006, A&A, 446, 877
- (54) Maraston C., 2005, MNRAS, 362, 799
- (55) Maraston C., Daddi E., Renzini A., Cimatti A., Dickinson M., Papovich C., Pasquali A., Pirzkal N., 2006, ApJ, 652, 85
- (56) Maraston C., Daddi E., Renzini A., Cimatti A., Dickinson M., Papovich C., Pasquali A., Pirzkal N., 2007, ApJ, 656, 1241 (erratum)
- (57) Meurer G. R., Heckman T. M., Calzetti D., 1999, ApJ, 521, 64
- (58) Mignoli M., et al., 2005, A&A, 437, 883
- (59) Noeske K.G., Weiner B.J., Faber S.M., et al., 2007a, ApJ Letters, in press (astro-ph/0701924)
- (60) Noeske K.G., Faber S.M., Weiner B.J., et al., 2007b, ApJ Letters, in press (astro-ph/0703056)
- (61) Oppenheimer B. D., Davé R., 2006, MNRAS, 373, 1265
- (62) Papovich C., et al., 2006, ApJ, 640, 92
- (63) Papovich C., Rudnick G., Le Floc’h E., et al., 2007, ApJ, in press (arXiv:0706.2164)
- (64) Pérez-González P.G., Rieke G.H., Egami E., et al., 2005, ApJ, 630, 82
- (65) Persic M., Rephaeli Y., Braito V., et al., 2004, A&A, 419, 849
- (66) Pope A., Borys C., Scott D., Conselice C., Dickinson M., Mobasher B., 2005, MNRAS, 358, 149
- (67) Pope A., Scott D., Dickinson M., 2006, et al., MNRAS, 370, 1158
- (68) Pozzetti L., Bolzonella M., Lamareille F., et al., 2007, submitted to A&A (arXiv:0704.1600)
- (69) Quadri R., et al., 2007, ApJ, 654, 138
- (70) Ranalli P., Comastri A., Setti G., 2003, A&A, 399, 39
- (71) Reddy N.A., et al., 2005, ApJ, 633, 748
- (72) Reddy N.A., et al., 2006a, ApJ, 644, 792
- (73) Reddy N.A., et al., 2006b, ApJ, 653, 1004
- (74) Richards E. A., 2000, ApJ, 533, 611
- (75) Roussel H., Helou G., Beck R., et al., 2003, ApJ, 593, 733
- (76) Rudnick G., et al., 2003, ApJ, 599, 847
- (77) Rudnick G., et al., 2006, ApJ, 650, 624
- (78) Sanders D. B., Mazzarella J. M., Kim D.-C., et al., 2003, AJ, 126, 1607
- (79) Sanders D. B., et al., 2007, ApJS in press (astro-ph/0701318)
- (80) Scoville N., Benson A., Blain A.W., et al., 2007, ApJS in press (astro-ph/0612306)
- (81) Shapley A., et al., 2005, ApJ, 626, 698
- (82) Smith J.D.T., Draine B.T., Dale D.A., et al., 2006, ApJ in press astro-ph/0610913
- (83) Solomon P. M., Vanden Bout P. A., 2005, ARA&A, 43, 677
- (84) Spergel D.N., et al., 2007, ApJ, in press (astro-ph/0603449)
- (85) Springel V., White S.D.M., Jenkins A., et al., 2005, Nature, 435, 629
- (86) Steidel, C. C., Shapley, A. E., Pettini, et al., 2004, ApJ, 604, 534
- (87) Swinbank A. M., Chapman S. C., Smail I., Lindner C., Borys C., Blain A. W., Ivison R. J., Lewis G. F., 2006, MNRAS, 371, 465
- (88) Szokoly G. P., Bergeron J., Hasinger G., et al., 2004, ApJS, 155, 271
- (89) Tacconi L. J., et al., 2006, ApJ, 640, 228
- (90) Trentham, N., Kormendy, J., & Sanders, D. B. 1999, AJ, 117, 2152
- (91) van Dokkum P.G., et al., 2006, ApJ, 638, L59
- (92) Vanzella E., et al., 2005, A&A, 434, 53
- (93) Vanzella E., et al., 2006, A&A, 454, 423
- (94) Wirth G. D., et al., 2004, AJ, 127, 3121
- (95) Yun M. S., Reddy N. A., Condon J. J., 2001, ApJ, 554, 803