A sharper view of the outer Galaxy at 1420 and 408 MHz from the Canadian Galactic Plane Survey II: The catalogue of extended radio sources
Abstract
A new catalogue of extended radio sources has been prepared based on arcminute-resolution 1420 MHz images from the Canadian Galactic Plane Survey (CGPS). The new catalogue provides both 1420 MHz and 408 MHz flux density measurements on sources found near the Galactic plane in the second quadrant of our Galaxy. In addition cross-identifications are made with other major radio catalogues and information is provided to facilitate the recovery of CGPS image data associated with each catalogued source. Numerous new radio sources are identified and the catalogue provides a comprehensive summary of both newly discovered and previously known H ii regions and supernova remnants in the outer Galaxy. The catalogue should be of use both for synoptic studies of Galactic structure and for placing higher resolution observations, at radio and other wavelengths, in context.
keywords:
surveys – catalogues – Galaxy: disc – radio continuum: general.1 Introduction
The Canadian Galactic Plane Survey (CGPS; Taylor et al. 2003) has recently completed observations of the second quadrant of the Galaxy at 1420 and 408 MHz. The images from this survey provide an unprecedented view of the extended radio continuum emission in this portion of the Galaxy at arcminute-scale resolution. This paper presents positional and flux density information on all extended sources identified in the CGPS data covering between . Cross-identifications with other major catalogues of extended radio sources and optical H ii regions are provided along with mosaic codes that will facilitate the acquisition of CGPS data for individual sources from the Canadian Astronomy Data Centre (CADC). The catalogue is especially well suited as the starting point for large-scale studies of the outer Galaxy, especially those focusing on the structure of the Perseus and Outer spiral arms, and for placing small-scale observations in their proper context.
| CGPSE | RA (J2000) | DEC (J2000) | Fν (1420) | (1420) | Fν (408) | (408) | Mosaic Code | ||||
|---|---|---|---|---|---|---|---|---|---|---|---|
| h m s | arcmin | arcmin | (mJy) | (mJy) | (mJy) | (mJy) | |||||
| 1 | 90.240 | 21 05 18 | 49 40 | 5.70 | 5.70 | ML2 | |||||
| 2 | 90.310 | 21 06 38 | 49 34 | 5.16 | 4.56 | ML2 | |||||
| 3 | 90.495 | 21 26 21 | 46 38 | 6.72 | 1.50 | MK1 | |||||
| 4 | 91.020 | 21 07 44 | 50 22 | 31.44 | 11.94 | MK2 | |||||
| 5 | 91.115 | 21 09 35 | 50 14 | 5.16 | 5.10 | MK2 | |||||
| 6 | 90.970 | 21 09 08 | 50 06 | 11.70 | 8.58 | MK2 | |||||
| 7 | 91.550 | 21 14 13 | 50 07 | 6.78 | 5.22 | MK2 | |||||
| 8 | 91.790 | 21 19 58 | 49 33 | 7.08 | 5.88 | MK1 | |||||
| 9 | 92.155 | 21 07 03 | 52 00 | 73.26 | 20.52 | MK2 | |||||
| 10 | 92.240 | 21 14 34 | 51 02 | 7.08 | 1.68 | MK2 |
Table 1 is presented in its entirety in the electronic edition of the journal.
Prior to the CGPS the best synoptic view of the radio continuum emission at centimetre wavelengths in the outer Galaxy was provided by a series of surveys done by the Effelsberg 100-m telescope at 9-arcmin resolution. The surveys were summarized in the Kallas & Reich (1980) and Reich, Reich & Fürst (1997) catalogues (KR and RRF respectively). Another very useful summary is the catalogue of outer Galaxy radio sources within , compiled by Fich (1986), as part of his VLA “snapshot” survey of point sources in the KR catalogue. The Fich (1986) catalogue includes all of the KR sources along with extended objects observed by the Effelsberg 100-m telescope but not noted in the KR catalogue.
| CGPSE | KR | Kothes et al. (2006) | Sh-2 | RRF | F3R | Paladini et al. (2003) | Notes |
|---|---|---|---|---|---|---|---|
| 1 | 121 | 825 | 2906 | 781 | |||
| 2 | 2910 | ||||||
| 3 | B3 2124+464 | ||||||
| 4 | BG 2107+49, north plume | ||||||
| 5 | 835 | 2930 | BG 2107+49, compact core | ||||
| 6 | 2927 | BG 2107+49, south plume | |||||
| 7 | 2941 | ||||||
| 8 | 2945 | ||||||
| 9 | 1 | filaments probably associated with CGPSE 14 (KR 1) | |||||
| 10 | 850 | 2957 |
Table 2 is presented in its entirety in the electronic edition of the journal.
Paper 1 in this series (Kerton, 2006) used CGPS data to look at sources listed in the KR catalogue focusing on those sources misclassified as extended sources, and thus not observed by Fich (1986), along with point sources with flat or rising spectra between 408 and 1420 MHz. This paper presents a catalogue of all extended emission features seen in the CGPS radio continuum data and thus provides an expanded and updated version of the Fich (1986) catalogue. Specifically it: 1) includes newly discovered radio continuum sources, especially sources with a filamentary morphology not identified in earlier, lower resolution, surveys; 2) covers essentially the entire second quadrant along the Galactic plane; 3) corrects misclassified and omitted objects in the Fich (1986) catalogue and 4) provides 408 MHz flux densities for the objects when possible.
In the next section the relevant characteristics of the CGPS data are reviewed. Source identification and analysis techniques are discussed in Section 3. The catalogue is presented and described in Section 4. Some interesting new radio sources and high spatial dynamic range images of large star-forming complexes are discussed in Section 5 followed by conclusions in Section 6.
2 Observations
As part of the CGPS, observations at 1420 and 408 MHz were obtained using the Dominion Radio Astrophysical Observatory (DRAO) interferometer (Landecker et al., 2000). The first part of the survey (termed Phase 1) covered approximately between at 1420 MHz. The data acquisition and survey strategy for Phase 1 are described in detail by Taylor et al. (2003). Phase 2 of the survey extended the coverage along the Galactic plane to using the same methodology as in Phase 1 of the survey.
The typical survey spatial resolution is approximately 1 arcmin at 1420 MHz and approximately 3 arcmin at 408 MHz. Existing surveys from the Effelsberg and Stockert single-dish telescopes were used to provide short-spacing data (Reich et al., 1997; Reich, 1982; Haslam et al., 1982). This, combined with the extensive uv-plane coverage used in the individual interferometer observations, means that the survey is sensitive to essentially all spatial frequencies. This is crucial for the study of extended Galactic radio emission as is illustrated by the comparison of the CGPS and NVSS (NRAO VLA Sky Survey, Condon et al. 1998) mosaics shown in Figure 1.
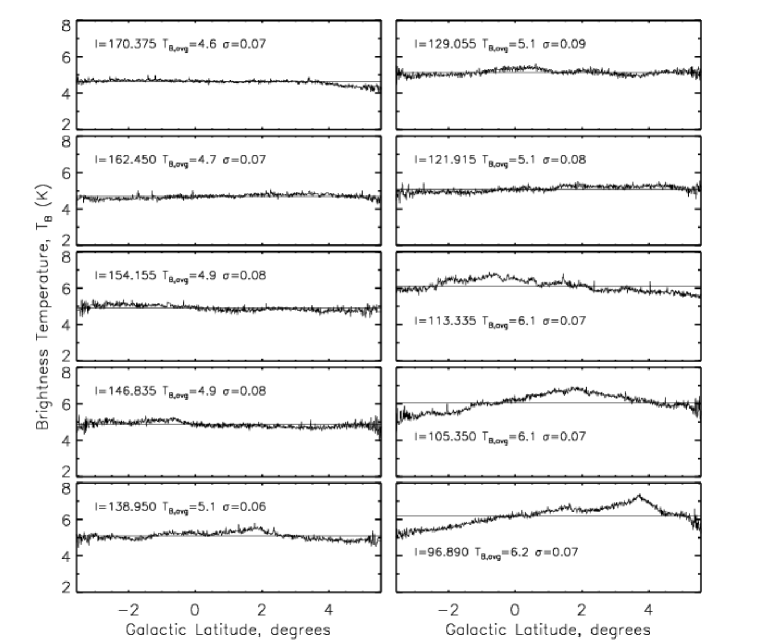
To illustrate the noise characteristics of the data at 1420 MHz we show in Figure 2 brightness temperature (TB) as a function of galactic latitude at intervals spaced approximately 10 degrees apart across the survey region. The specific longitudes were chosen to avoid extended sources and to minimize the number of point sources in the cut. At the smallest ( arcminute) scale the measured noise level is 1 K which is in agreement with the estimate quoted by Taylor et al. (2003). Also apparent in most of the cuts is a very large scale (2 – 5 degree) variation in the background with a 0.25 – 0.5 K amplitude. As noted by Taylor et al. (2003) this large-scale variation in the background limits our ability to identify faint diffuse structures at these larger angular scales.
CGPS data also includes H i 21-cm line observations from DRAO, 12CO () data from the Five College Radio Astronomy Observatory (FCRAO) Outer Galaxy Survey (OGS; Heyer et al. 1998) and HIRES processed IRAS data from the IRAS Galaxy Atlas (IGA; Cao et al. 1997) and the Mid-infrared Galaxy Atlas (MIGA; Kerton & Martin 2000). All of these data sets have approximately 1 arcmin resolution and, as part of the CGPS, are projected onto a common spatial and (when appropriate) velocity grid (10241024, 18 arcsec pixels, 0.82 km s-1 channels). The resulting series of mosaics or data cubes are freely available via the Canadian Astronomy Data Centre (CADC).
3 Source Identification and Analysis
Each of the CGPS 1420 MHz mosaics for was visually inspected for extended radio sources using the kvis image viewer.111kvis is part of the karma suite of image visualization tools (Gooch, 1996). The inspection typically involved the use of a variety of greyscale stretches in order to examine both faint and bright structures. Each mosaic was viewed independently by at least two of the authors before a final source list was compiled.
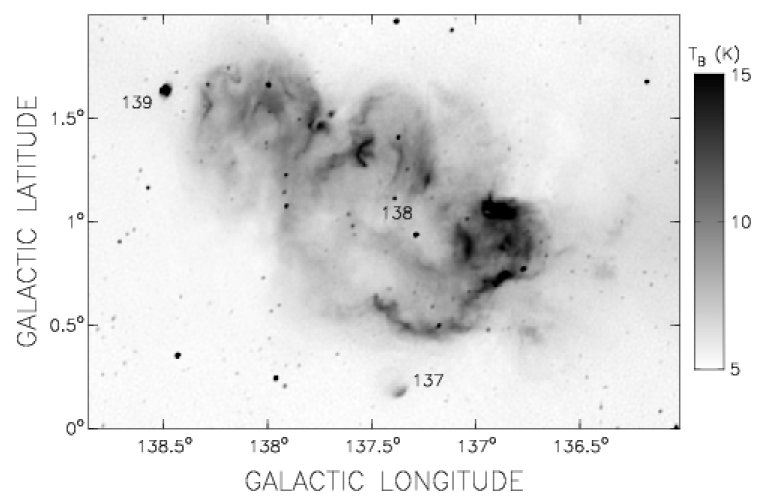
We followed a grouping philosophy in the construction of the catalogue where distinct substructures within extremely large sources were not individually identified. For example, the numerous bright rims and other distinct structures within the larger W5 H ii region (see Figure 3) were not individually noted, rather a note was made in the catalogue that this source shows extensive sub-structure.
After sources were identified in the 1420 MHz mosaics the corresponding 408 MHz mosaic was inspected to see if the source could also be identified in the lower resolution 408 MHz images. For each source the centroid position of the radio emission in galactic coordinates was noted, the maximum and minimum axis of each source (as seen at 1420 MHz) was measured using the kvis program, and a CGPS mosaic code was associated with each source.
Inspection of the extended sources identified in this manner showed that their extent was defined at a contrast level of T TT K, where Tedge is the brightness temperature at the edge of the region and Tbg is the local background level. This contrast level is throughout the survey region. A typical example is shown in Figure 4 where we plot TB at 1420 MHz along longitude and latitude cuts taken through the centroid position of the large ( arcmin scale), faint (peak T K) extended source CGPSE 153.
Flux density measurements were made at 1420 MHz and at 408 MHz (when possible), using the imview program.222imview is part of the DRAO Export Software Package This program allows the user to interactively define a background level using twisted-plane or twisted-quadratic fits to user-selected background points. For the vast majority of the sources the uncertainty associated with this background determination was the largest source of error. The error estimates quoted in the catalogue are the range of the flux density values determined using two different, but equally valid, backgrounds. This situation is very similar to that described by Fich & Terebey (1996) in their study of extended infrared sources along the Galactic plane where background estimation uncertainty also dominates the error budget of their flux density measurements. The only exception to this was when the source was isolated and particularly well defined. In these cases uncertainties associated with original observations, 3% and 6% at 1420 and 408 MHz respectively (Kothes et al., 2006),are quoted.
For SNRs located in the survey region the flux density measurements of Kothes et al. (2006), which were obtained from the same data, are quoted. The SNR catalogue of Kothes et al. (2006) includes SNRs newly discovered in the CGPS data and clarifies the nature of some of the “possible SNRs” listed in older versions of the Green (2006) SNR catalogue. In addition the very challenging flux density measurement of the large diffuse H ii region OA 184, again based on the same data, was taken directly from Foster et al. (2006).
4 The Extended Source Catalogue
In this section we present the catalogue of extended radio sources in the second quadrant of the Galaxy. The catalogue will be useful for global studies of the distribution of SNRs and H ii regions within the outer Galaxy particularly along the Perseus and Outer arms. An additional use of the catalogue will be in placing higher-resolution studies in context.
The catalogue is presented in three parts. The first part (Table 1) contains information on the position, angular size and flux density of the sources. Column 1 is a running source number (denoted CGPSE for CGPS Extended source). Galactic coordinates of the source are given in Columns 2 and 3 followed by equatorial coordinates (J2000) in Columns 4 and 5. The angular size of the source is listed in Columns 6 and 7. Columns 8 and 9 give the 1420 MHz flux density and error estimate for each source. When possible the 408 MHz flux density and error estimates are given in Columns 10 and 11. For 58 of the sources 408 MHz emission could not be distinguished from the background due to the higher 408 MHz noise level (K) and lower resolution. This was particularly a problem in the region around the Cas A SNR (the ME and MF CGPS mosaics) where sidelobe effects can be observed at 408 MHz out to almost 5 degrees from the SNR. In these cases no data values are indicated by “” in the printed tables and by flux density and error values of “999” and “99” respectively in the machine-readable version of the catalogue. Finally, Column 12 gives the code of the CGPS mosaic containing the source. Some sources are visible in multiple mosaics because of the overlap between mosaics. In such cases we selected the mosaic where the source is most centrally located. Multiple codes in Column 12 are associated with those very large sources that fall across mosaic boundaries.
The second part of the catalogue (Table 2) provides cross-identifications between the CGPSE sources and selected catalogues. Associations were done by visually comparing, using kvis, the CGPS 1420 MHz mosaics with coordinates and size information given for sources in various other catalogues. Column 1 lists the CGPSE number. Columns 2 through 7 provide the applicable entry from the KR catalogue, the SNR catalogue of Kothes et al. (2006), the Sh-2 optical H ii region catalogue (Sharpless, 1959), the RRF and F3R (Fürst et al., 1990) small-diameter radio source catalogues, and the Paladini et al. (2003) catalogue of Galactic H ii regions respectively. The final column lists other common associations along with brief notes about the source in most cases.
Finally, the third part of the catalogue (Table 3) lists the average local background and noise level for each of the sources. Column 1 lists the CGPSE number, Columns 2 and 3 are the background and noise levels respectively at 1420 MHz and, when applicable, Columns 4 and 5 list the same information for the 408 MHz data.

In total we identify 201 CGPSE sources, 27 of which have no cross-references in the catalogues examined. The CGPSE catalogue is a major update of the Fich (1986) catalogue of extended sources as it does not include KR sources that were incorrectly originally identified as being extended (see Kerton 2006 for more details). Also the CGPSE catalogue includes some large objects that were not included in Fich (1986) (e.g., DA 568 as discussed in Kerton, Brunt & Kothes 2004) and updates the nature of some of the mis-identified SNRs.
| 1420 MHz | 408 MHz | |||
| CGPSE | (K) | (K) | (K) | (K) |
| 1 | 7.70 | 0.10 | 72.89 | 0.89 |
| 2 | 7.85 | 0.10 | 71.08 | 1.10 |
| 3 | 5.03 | 0.14 | 42.82 | 1.14 |
| 4 | 8.05 | 0.17 | 78.71 | 2.58 |
| 5 | 8.50 | 0.21 | 80.51 | 3.91 |
| 6 | 8.09 | 0.21 | 77.33 | 2.25 |
| 7 | 6.93 | 0.07 | 68.65 | 1.64 |
| 8 | 6.73 | 0.11 | ||
| 9 | 8.01 | 0.09 | 79.75 | 1.17 |
| 10 | 7.59 | 0.13 | 74.83 | 1.08 |
Table 3 is presented in its entirety in the electronic edition of the journal.
Overlap between the CGPSE and the RRF and F3R catalogues is minimal (there are RRF sources and F3R sources within the survey area) as the majority of the RRF and F3R sources remain unresolved at the 1 arcmin resolution of the CGPS at 1420 MHz. Larger CGPSE sources are also not found in the RRF and F3R catalogues as the latter include only small diameter radio sources having angular extents of arcmin and arcmin respectively. In some cases bright, compact portions of larger CGPSE regions do have RRF or F3R identifications and this is indicated in the notes to the source.
5 High Spatial Dynamic Range Views of Star-Forming Regions
What truly sets the CGPS data apart from any previous observation of our Galaxy at radio continuum wavelengths is its spatial frequency sensitivity (see § 2 and Fig. 1) combined with its high spatial dynamic range, i.e., the combination of hundreds of square degrees of spatial coverage with arcminute-scale resolution. The unbiased nature of the survey also makes it well suited for the discovery of new radio sources. In this section we highlight three regions within the CGPS which illustrate the utility of the CGPS data for large-scale synoptic studies of Galactic structure. In addition to these examples we note a series of papers that have already been published studying the region around (Foster, 2005; Foster, Routledge & Kothes, 2004; Foster & Routledge, 2001). This region also includes the enormous KR 1 (CTB 102) H ii region which was highlighted in Kerton (2006) and was recently the target of a radio-recombination line (RRL) observing campaign at the Green Bank Telescope which will determine if the extensive filamentary structure surrounding KR 1 is associated with the main body of the H ii region (Foster, Kerton & Arvidsson, in preparation).
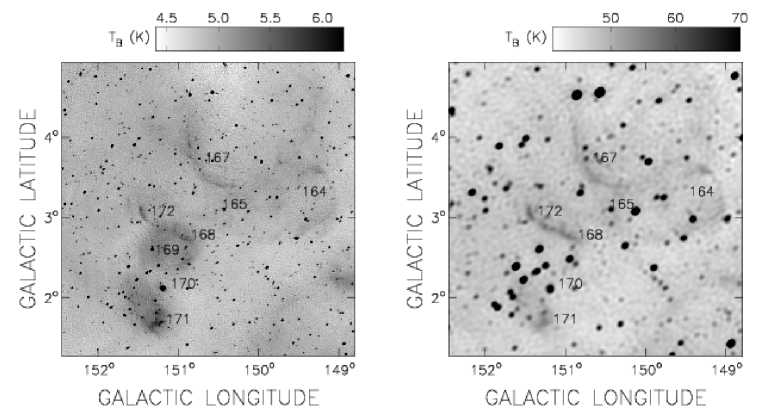
5.1 A new Galactic SNR candidate near ,
Figure 5 shows a 3.5 degree square region centered on , at 1420 and 408 MHz. Except for the smaller-diameter CGPSE 170 (Sh 2-207) and CGPSE 165 (F3R 4369) none of the other extended sources in this region have been previously noted. Table 4 summarizes the radio spectrum data for the various extended sources in this region listed in Column 1 by their CGPSE number. Columns 2 and 3 give the spectral index between 408 MHz and 1420 MHz and the error estimate on the spectral index, and respectively. Here we use the convention that flux density () and frequency () are related by . This is followed in Column 4 by brief notes on some of the sources.
Most of the extended sources have flat or rising spectral indexes ( or respectively) consistent with thermal radio emission associated with Galactic H ii regions. The filament CGPSE 167 also has associated diffuse infrared emission, visible in the ancillary IR data sets available as part of the CGPS, which would also be expected for a Galactic H ii region.
| CGPSE | Notes | ||
|---|---|---|---|
| 164 | |||
| 165 | extragalactic | ||
| 167 | associated IR emission | ||
| 168 | with 172, SNR | ||
| 169 | no 408 MHz detection | ||
| 170 | optical H ii region | ||
| 171 | |||
| 172 | with 168, SNR |
Three of the sources have falling (non-thermal, ) spectra. CGPSE 165 is a likely extragalactic source. It is only slightly extended at 1420 MHz, has a non-thermal spectrum and has no associated infrared emission. Particularly noteworthy though is the filamentary structure made up of CGPSE 172 and 168. Both sections of this filament have falling spectrum between 408 and 1420 MHz. A combined flux density measurement yields a spectral index of . This steep, non-thermal, spectral index combined with the filamentary morphology seen at both 408 and 1420 MHz makes this object a strong candidate for a new Galactic SNR (G151.2+2.85).
5.2 A newly forming OB association at
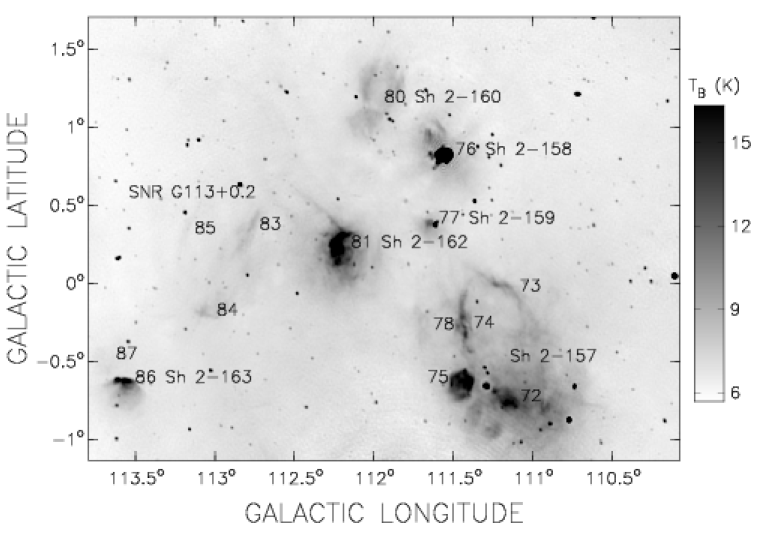
Figure 6 shows the region near the Cas A SNR. The region is rich in optical H ii regions and has been interpreted as being the early stages of the formation of an OB association (Israel et al., 1973; Israel, 1977) or even being part of a much larger complex of star-forming regions (Lozinskaia, Sitnik & Lomovskii, 1986). Some of the individual H ii regions have been observed at radio wavelengths at higher resolution but the CGPS data show all of the regions in context and are sensitive to the extensive extended emission. For example, the observations of Sh-2 157 by Israel (1977) and Birkinshaw (1978) focus only on the region around CGPSE 72 and 75, while CGPSE 73, 74, and 78 are probably also related. The VLA survey of optically visible H ii regions by Fich (1993) does not include any of these regions presumably due to a combination of the angular size limit for survey targets ( arcmin) and the difficulty of obtaining images close to the Cas A SNR.
While Cas A itself was not imaged by the DRAO interferometer because its high brightness makes image calibration extremely difficult (Taylor et al., 2003), the CGPS image quality at 1420 MHz for the region close to Cas A is extremely high. Special data reduction techniques, described by Willis (1999), were used to minimize artifacts associated with the bright SNR. In addition the field centres for the fields surrounding Cas A were selected so that the SNR was located in the first null of the primary beam of the DRAO interferometer at 1420 MHz (Taylor et al., 2003).
Since the CGPS observations were not directed only to the locations of the optical H ii regions a new Galactic SNR, G113.0+0.2 (CGPSE 83, 84 and 85), was discovered at the high-longitude end of this complex (Kothes, Uyaniker & Reid, 2005). Also CGPSE 87 is a newly identified faint extended radio source. The combined infrared, H i line and high-resolution (approximately 45 arcsec) molecular line data also available for this area would make the reinvestigation of this region, in the context of it possibly being a forming OB association, particularly worthwhile.
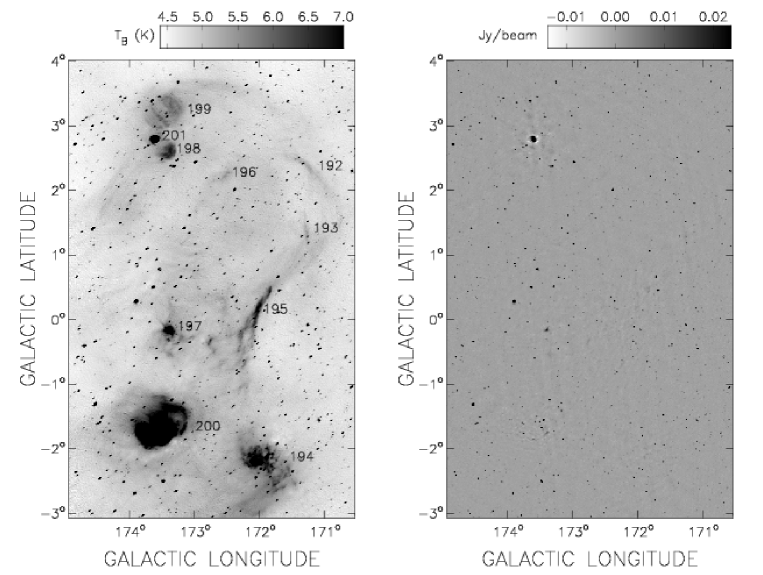
5.3 The complex
There are a large number of optical H ii regions with sizes ranging from 0.2 degrees up to about 0.5 degrees located around (see Figure 1). The emission associated with these regions is encompassed by a very extended “bowtie” structure of which the southern portion is associated with the large optical H ii region Sh 2-230.
The region around CGPSE 201 (Sh 2-235) has been studied in some detail (Israel & Felli, 1978) owing to its compact nature, which facilitates interferometric observations, and the fact it contains a number of embedded infrared sources. The region around the bright source CGPSE 200 (Sh 2-236) is probably worthy of a more detailed investigation beyond the existing studies which use this large H ii as as tracer of the Galactic velocity field (e.g., Brand & Blitz 1993).
The filaments CGPSE 192, 193, 195 and 196 are all apparently thermal emission. CGPSE 195 has a rising spectrum between 408 and 1420 MHz and infrared (IRAS) images of this area clearly show associated infrared emission. CGPSE 196 is associated with a small ridge of infrared emission which is originating from an embedded infrared source, IRAS 05329+3628 within a distant molecular cloud (Wouterloot & Brand, 1989). There is no obvious infrared emission associated with CGPSE 192 and 193, however, given the fact the filaments are not detected at 408 MHz, they are most likely thermal emission associated with Sh 2-230.
6 Conclusions
The CGPSE catalogue provides a summary of the extended radio emission sources detected in the second quadrant of the Galaxy by the CGPS at 1420 MHz and at arcminute-scale resolution. In addition to flux density measurements at both 1420 and 408 MHz, the catalogue contains positional information and cross-identifications with other major radio and optical H ii catalogues. Also included are mosaic codes for each source that will facilitate the retrieval of CGPS data from the CADC. The catalogue includes a number of newly identified radio continuum sources including a new Galactic SNR G151.2+2.85. It expands the coverage of previous catalogues of extended Galactic radio sources to include essentially the entire second quadrant along the Galactic plane, and corrects a number of misclassifications and inadvertent omissions of large sources from previous catalogues. For example, CGPSE 34 and 37 (DA 558 and DA 568) were not included in the Fich (1986) catalogue, and objects like CGPS 17 and 187 are now correctly classified as H ii regions not SNRs.
The outer Galaxy is an ideal region for the study of the structure of spiral arms and for the observation of the content of star-forming regions owing to the relative proximity of the sources of interest and limited confusion when compared with similar studies directed towards the inner Galaxy. We have illustrated how the radio continuum data alone from the CGPS can provide new synoptic views of star forming complexes and lead to the discovery of new sources. The entire CGPS data set is a unique resource for the investigation of Galactic structure and star formation and it is hoped that this catalogue will facilitate the use of the CGPS data set by the wider astronomy community.
Acknowledgments
J.P. contributed to this research as part of the Freshman Honors Program at Iowa State University. J.M. participated in this research through an undergraduate research opportunity funded by Iowa State University. The Dominion Radio Astrophysical Observatory is operated by the National Research Council of Canada. The Canadian Galactic Plane Survey is supported by a grant from Natural Science and Engineering Research Council of Canada.
References
- Birkinshaw (1978) Birkinshaw, M. 1978, MNRAS, 182, 401
- Brand & Blitz (1993) Brand, J., Blitz, L., 1993, A&A, 275, 67
- Cao et al. (1997) Cao, Y., Terebey, S., Prince, T.A., Beichman, C. A., 1997, ApJS, 111, 387
- Condon et al. (1998) Condon, J.J., Cotton, W.D., Greisen, E.W., Yin, Q.F., Perley, R.A., Taylor, G.B., Broderick, J.J., 1998, AJ, 115, 1693.
- Fich (1986) Fich, M., 1986, AJ, 92, 787
- Fich (1993) Fich, M., 1993, ApJS, 86, 475
- Fich & Terebey (1996) Fich, M., Terebey, S., 1996, ApJ, 472, 624
- Foster (2005) Foster, T., 2005, A&A, 441, 1043
- Foster & Routledge (2001) Foster, T., Routledge, D., 2001, A&A, 367, 635
- Foster, Routledge & Kothes (2004) Foster, T., Routledge, D., Kothes, R., 2004, A&A, 417, 79
- Foster et al. (2006) Foster, T., Kothes, R., Sun, X.H., Reich, W., Han, J.L., 2006, A&A, 454, 517
- Fürst et al. (1990) Fürst, E., Reich, W., Reich, P., Reif, K., 1990, A&AS, 85, 805
- Gooch (1996) Gooch, R. E., 1996, in Jacoby, G.H, Barnes, J., eds, ASP Conf. Ser. Vol. 101, Astronomical Data Analysis Software and Systems V. Astron. Soc. Pac., San Francisco, p. 80
- Green (2006) Green D.A., 2006, A Catalogue of Galactic Supernova Remnants (2006 April version), Astrophysics Group, Cavendish Laboratory, Cambridge, United Kingdom (available at http://www.mrao.cam.ac.uk/surveys/snrs/)
- Haslam et al. (1982) Haslam, C.G.T., Salter, C.J., Stoffel, H., Wilson, W.E., 1982, A&AS, 47, 1
- Heyer et al. (1998) Heyer, M.H., Brunt, C., Snell, R.L., Howe, J.E., Schloerb, F. P., Carpenter, J.M., 1998, ApJS, 115, 241
- Israel (1977) Israel, F.P., 1977, A&A, 59, 27
- Israel & Felli (1978) Israel, F.P., Felli, M., 1978, A&A, 63, 325
- Israel et al. (1973) Israel, F.P., Habing, H.J., de Jong, T., 1973, A&A, 27, 143 1977, A&A, 59, 27
- Kallas & Reich (1980) Kallas, E., Reich, W., 1980, A&AS, 42, 227
- Kerton (2006) Kerton, C.R., 2006, MNRAS, 373, 1023
- Kerton & Martin (2000) Kerton, C.R., Martin, P.G., 2000, ApJS, 126, 85
- Kerton, Brunt & Kothes (2004) Kerton, C.R., Brunt, C.M., Kothes, R. 2004, AJ, 127, 1059
- Kothes, Uyaniker & Reid (2005) Kothes,R., Uyaniker, B., Reid, R., 2005, A&A, 444, 871
- Kothes et al. (2006) Kothes, R., Fedotov, K., Foster, T.J., Uyaniker, B., 2006, A&A, 457, 1081
- Landecker et al. (2000) Landecker, T.L. et al. 2000, A&AS, 145, 509
- Lozinskaia, Sitnik & Lomovskii (1986) Lozinskaia, T.A., Sitnik, T.G., Lomovskii, A.I., 1986, Ap&SS, 121, 357
- Paladini et al. (2003) Paladini, R., Burigana, C., Davies, R.D., Maino, D., Bersanelli, M., Cappellini, B., Platania, P., Smoot, G., 2003, A&A, 397, 213
- Reich et al. (1997) Reich, P., Reich, W., Fürst, E., 1997, A&AS, 126, 413
- Reich (1982) Reich, W., 1982, A&AS, 48, 219
- Sharpless (1959) Sharpless, S., 1959, ApJS, 4, 257
- Taylor et al. (2003) Taylor, A. R. et al., 2003, AJ, 125, 3145
- Willis (1999) Willis, A. G., 1999, A&AS, 136, 603
- Wouterloot & Brand (1989) Wouterloot, J.G.A., Brand, J., A&AS, 80, 149