Outer jet X-ray and radio emission in R Aquarii: 1999.8 to 2004.0
Abstract
Chandra and VLA observations of the symbiotic star R Aqr in 2004 reveal significant changes over the three to four year interval between these observations and previous observations taken in with the VLA in 1999 and with Chandra in 2000. This paper reports on the evolution of the outer thermal X-ray lobe-jets and radio jets. The emission from the outer X-ray lobe-jets lies farther away from the central binary than the outer radio jets, and comes from material interpreted as being shock heated to 106K, a likely result of collision between high speed material ejected from the central binary and regions of enhanced gas density. Between 2000 and 2004, the Northeast (NE) outer X-ray lobe-jet moved out away from the central binary, with an apparent projected motion of 580 km s-1. The Southwest (SW) outer X-ray lobe-jet almost disappeared between 2000 and 2004, presumably due to adiabatic expansion and cooling. The NE radio bright spot also moved away from the central binary between 2000 and 2004, but with a smaller apparent velocity than of the NE X-ray bright spot. The SW outer lobe-jet was not detected in the radio in either 1999 or 2004. The density and mass of the X-ray emitting material is estimated.Cooling times, shock speeds, pressure and confinement are discussed.
1 Introduction
R Aquarii is a well studied symbiotic system made up of a Mira-type giant star and a compact object, most likely a white dwarf. The system has been observed in the radio (Kafatos et al., 1989), optical (Solf & Ulrich, 1985; Hollis et al., 1991; Solf, 1992; Paresce & Hack, 1994; Hollis, Pedelty & Kafatos, 1997), UV (Hollis et al., 1991), and X-rays (Kellogg, Pedelty & Lyon, 2001), hereafter KPL. The R Aqr system was first reported as an unresolved Einstein X-ray source by Jura & Helfand (1984). It was later observed with EXOSAT (Viotti et al., 1987) and ROSAT (Hünsch et al, 1998). Since this system is relatively close, about 200 pc away (Hollis, Pedelty & Lyon, 1997), there has been intense study of its evolution. R Aquarii is contained in an inner nebula extending 1′ north-south and another that is 2′ east-west. One of the most interesting features of the system is a bi-polar collimated outflow first observed around 1977 (Wallerstein & Greenstein, 1980; Herbig, 1980).
Collimated non-relativistic outflows have been found in accreting compact stars – symbiotic stars and supersoft X-ray sources. They have also been observed in Herbig-Haro objects. X-ray jets may also be produced in the fast collimated winds from the central stars or binaries in some bipolar planetary nebulae (Soker & Kastner, 2003), and recently, a possible X-ray jet has been reported in the T Tauri star DG Tau (Güdel et al, 2005), and optical spectroscopic evidence for jets in Hen 3-1341 was reported by Tomov, Munari & Marrese (2000). Also see Table 2 of Brocksopp et al (2004).
The symbiotic star R Aqr is the most dramatic example of a white-dwarf collimated outflow, and it was the first white dwarf found to have an X-ray jet (KPL). There are currently only two white dwarfs known to have X-ray jets, R Aqr and CH Cyg (Galloway & Sokoloski, 2004), and both are in symbiotic stars. In both cases, X-rays are present due to shock heating of the outflowing material as it collides with surrounding nebular material. The jet in CH Cyg is not completely resolved in the Chandra observation, but is visible in an HST observation shown in the same publication. It is more similar to the central R Aqr source and inner jets (Nichols et al, 2007) than to the outer lobe-jets discussed here. It is also possible that the CH Cyg jet spectrum contains an admixture of emission from the central CH Cyg source because the jet is not completely spatially resolved. That could explain the counts at 5 keV from the jet - they could be from the central source, as seen in R Aqr.
Supersoft X-ray sources (SSS) show evidence for jet outflow but jets like those we observe in R Aqr have not been imaged directly. This is not surprising because most SSS are much more distant, being at kiloparsec distances in our galaxy, in the Magellanic Clouds, or even in external galaxies, making their angular sizes likely too small to be resolved. The primary evidence for jets in SSS is the observation of pairs of red and blue shifted “satellite” optical emission lines in their spectra (Cowley et al, 1998; Kahabka and van den Heuvel, 2006). SSS are typically close binaries and are far more luminous than R Aqr in X-rays, with Lx in the near-Eddington range 1037-38 erg s-1. The radial velocities of these jets range up to thousands of km s-1, considerably higher than the outer lobe-jet R Aqr velocity. These SSS jets are thought to be radiation driven. However, they are likely to be situated very close to the WD accretion disk, whereas the R Aqr lobe-jets we study here are very far away from the central source, with an expectation of lower velocity due to various sources of drag or dissipation.
Production of X-rays from non-relativistic jets occurs in some protostellar jets in Herbig-Haro objects (e.g. Pravdo et al. (2001) in which there is marginal evidence for extended emission in HH2 below 2 keV, but not enough detail to know if there is a jet. An expanding x-ray feature was seen in HH154, moving outward at km s-1 (Favata et al., 2002; Favata et al, 2006). These jets in YSOs, the Herbig-Haro (HH) objects, are similar to those seen in R Aqr. HH objects have been known for 50 years to be luminous condensations of gas in star-forming regions, but not fully explained. A jet-induced shock model is favored, with material streaming out of a young stellar object, colliding with the ambient medium. HH2 was the first HH object discovered as an X-ray source by Pravdo et al. (2001). Eleven photons were detected, establishing that the source was extended by about 1-2 arc sec. The position of the emission is known to 1/2 arc second accuracy and is at the leading edge of an Hα feature moving at several hundred km s-1 away from the star of origin, an obscured YSO named VLA 1. The shape of the spectrum cannot be determined from so few counts, but the counts are all at energies 2 keV, similar to the R Aqr outer lobe-jets. HH154 was observed by Favata et al (2006) in 2001 and 2005.
The Herbig Ae star HD 163296 is also an X-ray source with a suggestion of emission in the direction of a Lyα emitting jet and Herbig-Haro outflow (Swartz et al, 2005). The authors fit variable abundances with elements of similar first ionization potentials fixed at their relative solar abundances to allow for chemical fractionation commonly observed in late-type stars of this type. Most of the X-ray emission comes from the central star, and is fitted to a mekal thermal plasma emission model with kT = 0.49 0.03 keV, a somewhat higher temperature than for the outer lobe-jets in R Aqr, and qualitatively different from the central R Aqr source (Nichols et al, 2007). The suggestion of X-ray emission from a jet was only five counts, so not much could be learned, except that the counts are at about 0.8 keV, considerably higher energy than for the R Aqr outer lobe-jets.
The remainder of this article gives a description of the 2004.0 Chandra and VLA observations of the outer lobe-jets in R Aqr, comparing with the earlier 2000.7 (Chandra and 1999.8 (VLA) epochs, presenting images and contour maps, and giving results on X-ray spectra. The X-ray data, including image and spectral analysis, are presented in §2.1. The radio data are presented in §2.2. In §3, we discuss the expected vs. observed cooling times, the mass, mass loss rate and kinetic energy in the lobe-jets, and the inferred shock speeds. We conclude with a summary of our results in §4.
2 Observations and Results
2.1 Chandra Observations
The new X-ray observations reported here were taken with Chandra on 2003 December 31 15:05:40 UT, MJD 53004.62894 start time (hereafter 2004.0) with the ACIS-S3 back illuminated detector (Chandra X-ray Center, 2003). The dataset is sequence 300140 and obsid 4546 222available at http://cfa.harvard.edu/chaser/mainEntry.do (catalog ) with an exposure time of 36523 s.
In order to compare the obsid 651 observation taken in 2000.7 with the new data, we reprocessed the 651 data to apply the same calibration and processing techniques to both observations (see cxc.harvard.edu for a description of the current calibration system). Our reprocessing of the data used CALDB version 2.28, and the most current correction algorithms as of Aug. 11, 2004. We applied a time-dependent gain correction and the CTI correction to the original level 1 event file, and created new rmf’s for each observation. We removed pixel randomization, and then applied the sub-pixel repositioning algorithm(Li & Kastner, 2004). These new level 1 event files were then filtered by grade and status, rejecting inappropriate events, to create level 2 event files, used in the analysis.
2.1.1 X-ray images
Figures 1, 2, 3 and 4 show a general X-ray view of R Aqr in the recent 2004.0 epoch, compared with the previous 2000.7 epoch. The total number of counts in 2004.0 with E8 keV from a 0.083 square arc min area encompassing the region in these figures is about 1000, or 0.027 counts s-1. The total counts from a region of the same size nearby, an indication of background, is 47, or 0.0013 counts s-1.
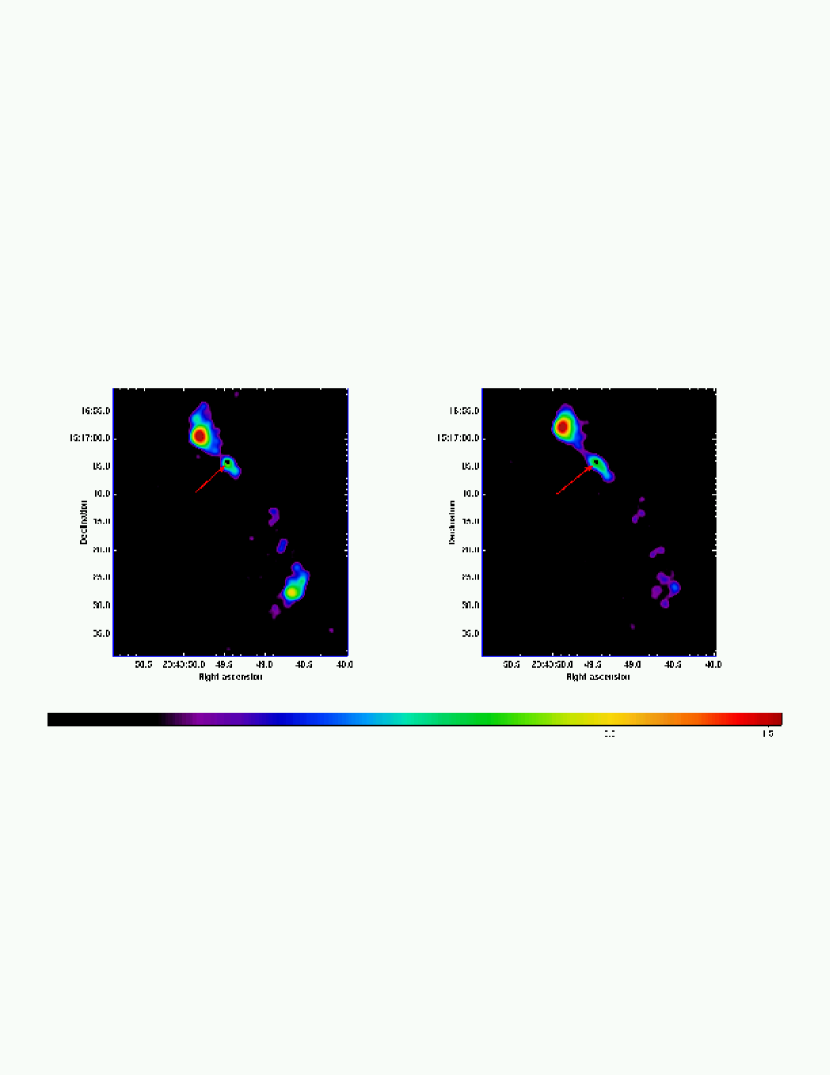
The images in figures 1, 2, 3 and 4 were created by first resampling the level 2 event files to 0.25 ACIS pixels, so the resulting pixel size is 1/8. A smoothing algorithm available in CIAO, aconvolve, was used with a 1- gaussian profile one ACIS pixel in extent to create the final images. This removes graininess without introducing significant blurring. The false color representation in Figure 1 has colors assigned on the basis of source brightness, with a color bar attached.Although the two observations were of different exposure times, they were adjusted for decreasing efficiency of the ACIS-S3 detector so equal numbers of counts in this 0.2-3.5 keV energy range would be expected if the source strength didn’t vary.
The X-ray morphology of R Aqr consists of several distinct structures. X-ray emission is detected from the central interacting binary, and from a small inner jet to the SW within of the central binary (clearly present for the first time in 2004.0; see Nichols et al (2007) for more discussion of this new X-ray jet), an outer jet to the NE and an outer jet to the SW. While the inner jet and the outer NE lobe-jet are largely aligned along a line at PA, the peak of the outer SW lobe-jet is located at PA, a significant difference from the position angle of expected from a simple opposing jet. In general, the SW outer lobe-jet is fainter and more extended than the NE lobe-jet. This kind of change in position angle has been interpreted as evidence for precession of the accretion disk close to the binary (Kafatos et al., 1986). Alternately, we suggest the jet may be encountering a wall of material constraining its motion, such as described by Soker & Kastner (2003) and Solf (1992).
In 2000.7, the NE outer lobe-jet emission was dominated by a bright spot approximately 8 from the central binary. The NE lobe-jet also produced diffuse emission extending all the way from the central binary out to a small, northward-curving spur-like structure roughly 12 away (see Fig. 1). In 2004.0, the NE outer lobe-jet bright spot had moved outward by . This change in position corresponds to an apparent velocity of km s-1 in the plane of the sky, where d is the distance to R Aqr divided by 200 pc. The extent of the more diffuse emission, however, remained approximately the same. Bodo et al (1998) did a specrocoptic optical observation of R Aqr and observed outward motion of the same region as our NE lobe-jet in Hα with a tangential velocity of 550300 km s-1, agreeing with our measurement within the errors.
The total number of counts from the NE outer lobe-jet was about the same in 2000.7 and 2004.0. Taking into account the the decrease in effective area resulting from contamination buildup on the ACIS-S3 optical blocking filter and increased exposure time, there was also no statistically significant change in total flux from the NE outer lobe-jet between the two epochs (see Table 1). The constancy of the NE lobe-jet flux is remarkable given that the morphology of the source changed significantly between the two observations. If the nominal change were truly occurring, it would be consistent with a factor of five reduction in flux in the ten years between the 1990-1991 observation (Hünsch et al, 1998) and our 2000.7 epoch observation. However, the Hünsch et al (1998) observation with ROSAT PSPC could not resolve the NE and SW lobe-jets and the central source from each other, and did not have spectral resolution nor range comparable with our Chandra observations, so more detailed conclusions cannot be drawn.
In 2000.7, the SW outer lobe-jet consisted of a series of disconnected, faint emission regions (with a slightly southward curvature) and a bright spot 26 from the central binary. The SW outer lobe-jet bright spot was 3 times fainter than the NE outer lobe-jet bright spot. In 2004.0, the appearance of the SW outer lobe-jet had changed dramatically. The SW outer lobe-jet X-ray emission faded by 75% overall (see Table 2). The disappearance of the X-ray bright spot at the center of the SW lobe-jet (see Figure 1) accounted for much of this change, as it was undetectable in 2004.0 The other SW outer lobe-jet emission regions did not fade significantly, and some may have moved outward compared to their location in 2000.7, but two images in 3 years are inadequate to properly track these possible motions.
Figures 2, 3 and 4 are based on our analysis of the energy spectrum of the outer lobe-jets, which are best modeled by a thermal emission process.the figures show X-rays in three energy ranges corresponding to expected dominant peaks in line emission from a thermal plasma, the Si XI complex just below the C absorption edge at 0.284, N VI, at0.43 and O VII, at 0.57 keV (Zombeck, 1990). The contour levels in figures 2, 3 and 4 are 0.01, 0.025, 0.05, 0.065, 0.1, 0.6 counts pixel-1.
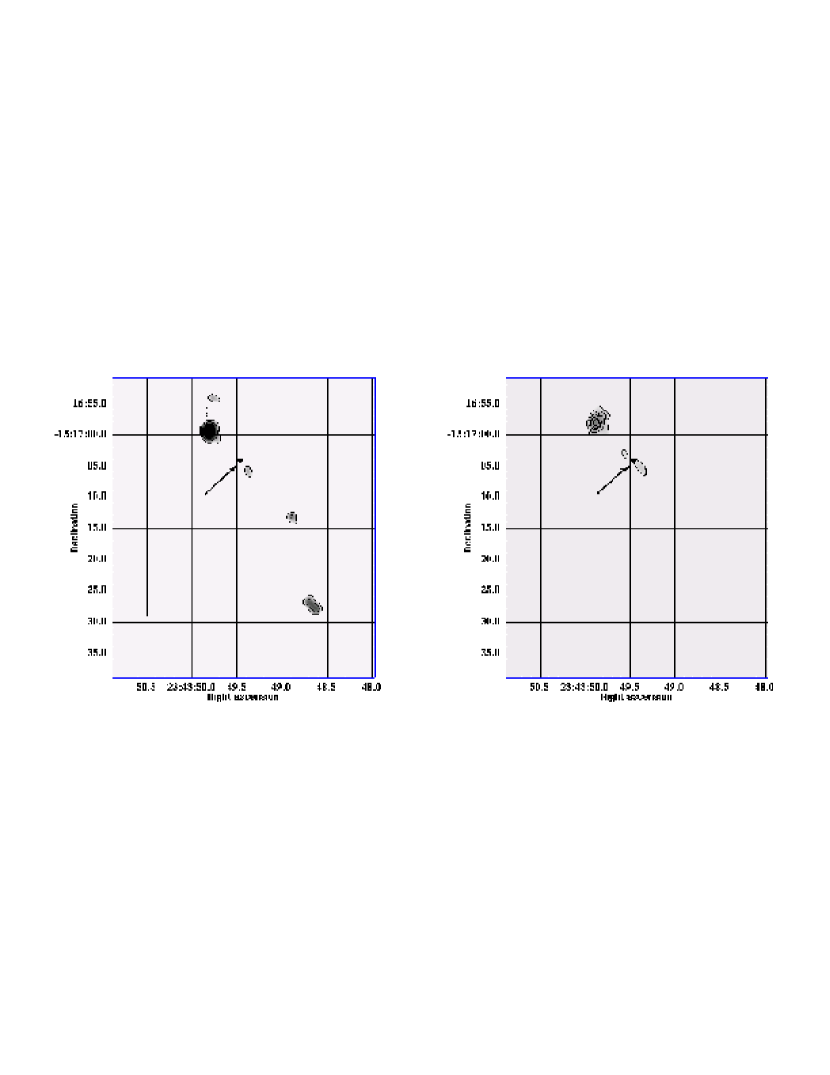
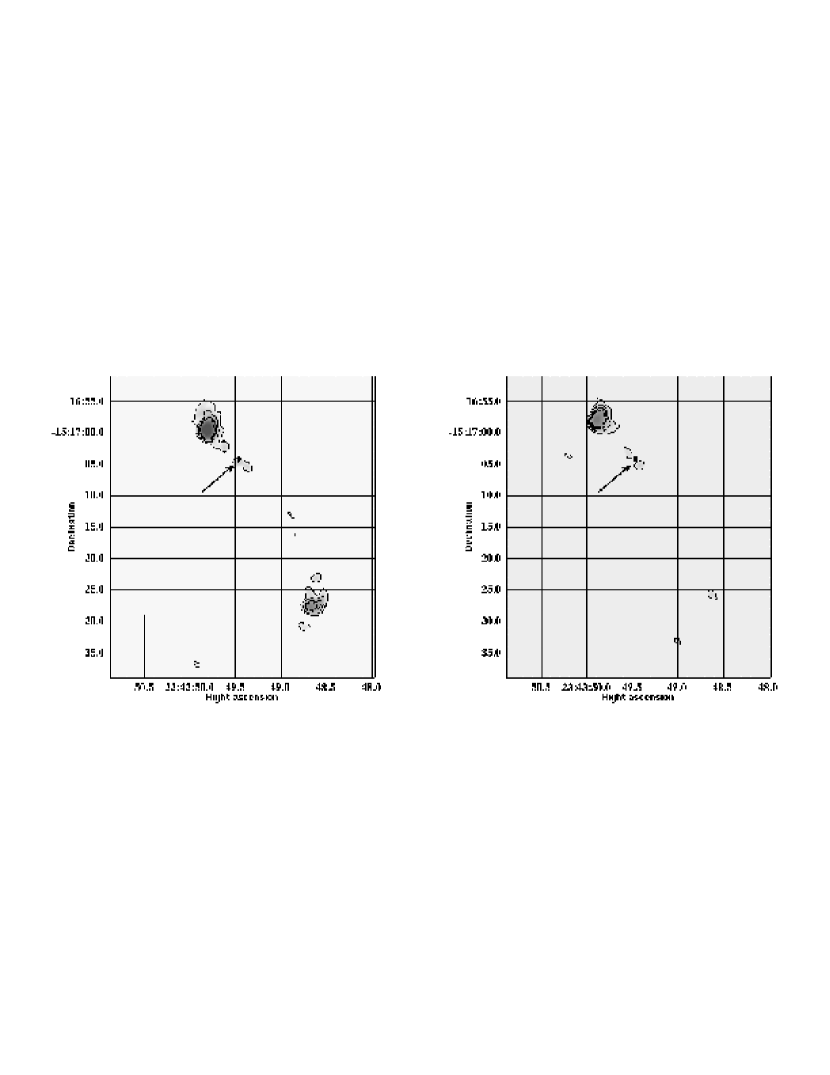
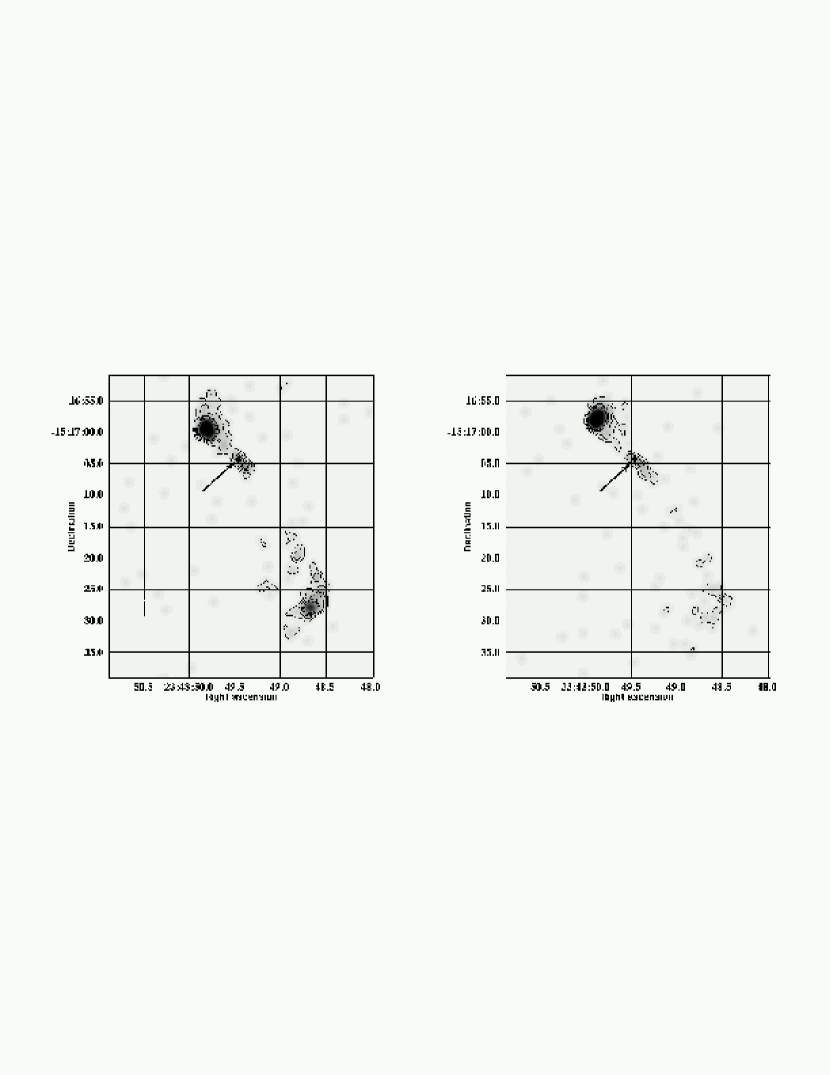
Several interesting features are apparent. In Figure 2 the 0.3 keV emission in the SW lobe-jet seems to come only from the center of that region. It may be cooler than the outer part. Of note in Figure 3 is the region to the north of the brightest part of the lobe-jet NE of the visible star in the 2000.7 epoch. This suggests it is emitting strongly in this part of the spectrum. In the 2004.0 epoch, the brightest part of the NE lobe-jet has moved into that region. The 0.3 keV part of the SW outer lobe-jet has faded considerably in 2004.0 but not entirely. Figure 4, the 0.57 keV range, shows the bulk of the emission from the outer lobe-jets. It also shows the north spur in the earlier observation where the later emission has moved. There is a noticeably larger region of emission in this energy range in the outer SW lobe-jet, and the center of the SW lobe-jet disappears in the later observation.
2.1.2 X-ray spectra
The spectral data were extracted from data we processed to give the most up to date results, yielding level 2 event files We extracted pulse height files using the CIAO specextract tool, with 10 counts per bin to allow using the technique. The spectra were fit with XSPEC 12.3.0e (Arnaud, 1996); also see http://heasarc.gsfc.nasa.gov/docs/xanadu/xspec. The Anders & Grevesse (1989) abundances were used.
Given the noticeable peaks in the spectrum suggesting line emission, we had to decide whether to use an equilibrium thermal model in xspec or a non-equilibrium collisional model (e.g. the nei model in xspec). With the relatively small number of counts from the outer lobe-jets in these spectra, we found we could not constrain the parameters of complex models such as nei effectively, whereas the equilibrium model gives an acceptable fit to the data. Given the limited number of counts, we had to be careful to fit the data with as few parameters as possible to obtain significant results. With the apparent thermal shape of the spectrum, we chose the most up to date thermal model, APEC (Smith et al, 2001). We also tried substituting other spectral forms instead of APEC. Black body and power law models did not give an acceptable fit. In all the fits we included interstellar absorption fixed at the 21-cm value of NH = 1.85 1020 (Stark et al, 1992). The entries in Table 1 entitled ”Source 0.25-2.0 keV flux” were computed with the interstellar absorption set to zero.
In KPL we had applied the more complex non-equilibrium model to the data; in this work we found the simpler model gave just as acceptable a fit to the data without the model complexity. We believe this difference is related to the improvements in the low energy calibration of the Chandra ACIS S3 detector in the interim.
NE Outer Lobe-Jet
No spatial variations were detectable in the 2004.0 NE outer lobe-jet spectrum. We compared spectra drawn from the half of the outer lobe-jet closest to the central star and the half farthest away. We also compared spectra from an elliptical region centered on the NE outer lobe-jet bright spot and a surrounding concentric elliptical annulus. We found no significant differences in spectral parameters in the pairs of regions. Therefore, we fitted spectrum models to the entire NE lobe-jet for the two epochs. Figure 5 shows the spectra of the NE thermal lobe-jet. In addition to the APEC model with standard abundances, we had to add a continuum to obtain an acceptable fit. The simplest continuum is a power law. Adding this component gave an acceptable fit to the data for both epochs. (Table 1).
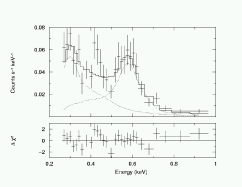
There is a hint of a peak in the 2000.7 data at about 0.4 keV, which we earlier interpreted as N VI emission. However, using the latest calibrations we can obtain an acceptable fit to the data without modeling that line.
SW Outer Lobe-Jet
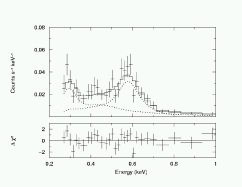
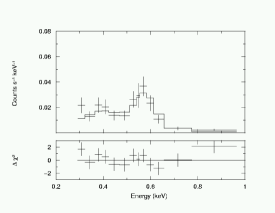
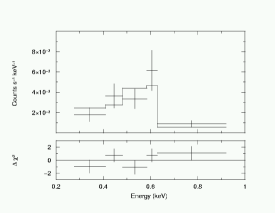
Figure 6 shows the SW outer lobe-jet Chandra pulse height spectra in the two epochs, with the model fits. There is a prominent peak at the energy of the O VII line in epoch 2000.7, suggesting again the APEC models as appropriate. In epoch 2004.0, the SW lobe-jet has faded to about 1/4 the overall intensity. Unlike for the NE lobe-jet, a power law was not required for the SW lobe-jet. The APEC model gives an acceptable fit. We tested other model fits, including blackbody and power law instead of APEC, but they gave unacceptable fits.See Table 2.
2.2 VLA Observations
To compare the radio structure of the jets in 2004.0 to the radio structure in 1999.8 (KPL), we performed VLA observations on 2004 January 6 with the NRAO Very Large Array in the B configuration. The receivers were tuned to the U (2cm), X (3.5cm), and L (20cm) frequencies with 100 MHz bandpasses. Two scans were made at X band (18 minutes each) and one scan each at U and L bands (11 minutes each). We used AlPS software for standard calibration, self-calibration, and imaging.
Figure 7 shows the VLA 3.5 cm (X band) observations of R Aqr in the two epochs. The beam is PA for both epochs. For the 1999.8 observation, the total flux was 29 mJy. For 2004.0 it was 21 mJy. The faint extended radio emission in the outer NE jet region that was present in 1999.8 has largely disappeared in 2004.0. The brighter wisp in the southern portion of the NE jet is still present. Its peak has moved east by 0.30.2 between 1999.8 and 2004.0. In 2004.0, the peak of the NE jet 3.5 cm emission is about 6.3 away from the position of the central binary. This apparent velocity is several times smaller than the apparent bulk velocity of the X-ray emitting plasma. There is no detectable emission at the position of the SW X-ray lobe-jet in either epoch. This motion gives an apparent bulk velocity of km s-1, close to or perhaps consistent with no motion at all.

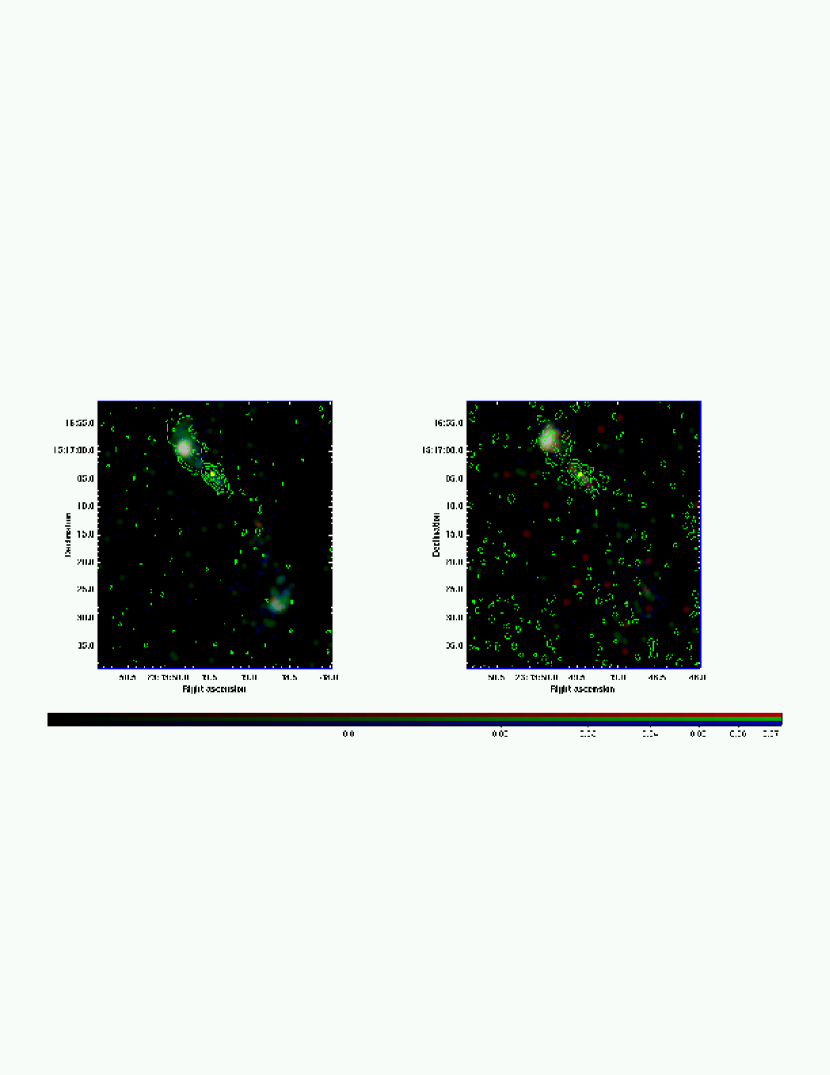
Figure 8 shows composite images of the Chandra and VLA observations from the two epochs, with the VLA 3.5 cm contours overlaid on a three color Chandra X-ray image. The NE X-ray bright spot lies farther away from the central binary than the NE radio bright spot at both epochs. The difference in distances from the central binary is even larger in 2004.0 than in 2000.7.
3 Interpretation
3.1 Northeast Outer Lobe-Jet
We find in §2.1.1 that the peak X-ray emission from the NE outer lobe-jet has moved in 3.3 years. This motion corresponds to a velocity of at least km s-1 (at an inclination angle of as believed for these lobe-jets (Hollis et al., 1991) it becomes ).
What are the possibilities for the origin of the X-ray emission in the NE outer lobe-jet? Evidence that could be used to suggest an origin:
-
•
The thermal or quasi-thermal X-ray spectrum of the NE lobe-jet
-
•
The radio spectrum of the NE lobe-jet
-
•
The appearance of new nonthermal jets in the inner region close to the star
-
•
Motion of the X-ray bright spot over 3.7 years
-
•
Changes and constancies in the X-ray and radio bright spots over 3.7 years
-
•
UV and optical observations from past years
Completely nonthermal emission mechanisms in this NE lobe-jet are unlikely because of the shape of the X-ray spectrum. If the spatial position of the peak of X-ray emission in the NE lobe-jet had not moved between our two observations, we might think the origin of the thermal component is just a cloud of hot gas. However, the motion of the X-ray bright spot implies a high enough velocity to cause a shock, if conditions in the medium it encounters are appropriate. If we can show that such a shock can produce the observed emission, then other explanations are unnecessary. Therefore, we will explore that possibility.
In order to compare our observations with a shock model, we consider the conditions for the model’s validity. First, are we dealing with a fluid? Is the mean free path for particles in the environment the size of the emitting region? This can be determined from the density of the environment. We don’t know the density directly, and it is likely to be nonuniform as a result of the complex history of wind emission from the Mira and its interaction with the compact companion. We can use evidence from previous optical and UV observations of the region to get an estimate of the possible range of densities. Using Kafatos et al. (1986); Meier & Kafatos (1995); Hollis et al. (1991), we obtain n. From standard gas kinetic theory, the Maxwell’s mean free path is then cm. Taking the X-ray emitting region to be approximately 3, AU, it is mean free paths in size. Therefore, the fluid approximation is reasonably valid. However, it is easy to imagine that electromagnetic phenomena may also play a role even if mechanical collissions are insufficient.
Most of the work on interpreting astrophysical observations as shocks has been done for supernova remnants, and most of that has the objective of predicting the optical and UV line emission for comparison with the preponderance of optical and UV observations. Here, we are dealing not with a “spherical” blast wave, but with a directed beam of material, i.e. a jet, and we are interested in comparing the predictions with X-ray observations. Work on interpreting jets has concentrated mostly on relativistic jets in QSOs and NS or BH binaries, or nonrelativistic jets in protostars. We are dealing with a binary system with a compact star that is apparently not a NS nor BH, more likely a WD.
However, outflows in HH objects are analoguous to those seen in R Aqr. The HH jets can be interpreted as a bow shock around an outflow moving into a medium that itself is moving outward into the ISM at a different speed (Pravdo et al., 2001). Similar movements in R Aqr can be derived from the X-ray spectrum and the apparent velocity. The fitted plasma temperature is 106 K, corresponding to a shock velocity of km s-1 (Draine & McKee, 1993, eqn. 2.24).
At these temperatures, we can consider the plasma as essentially nonradiative, because the emissivity is very low at such temperatures, compared with the emissivity at K. This means that we can treat the problem as adiabatic, and use the Rankine-Hugoniot equations. Assuming that the preshock medium is no hotter than K, its sound speed is no greater than 17 km s-1. At a shock speed of 355 km s-1 its Mach number is . This is the regime of strong shocks, so the relation between the upstream and downstream densities and and corresponding velocities and is . Since for high Mach number, . These relations apply in the frame where the shock is at rest, with the preshock material moving inward toward the front of the shock and the postshock material emitting the X-rays and moving outward away from the back of the shock. In this frame, adopting the convention that positive velocity means motion outward from the central star, and . If we now transform to a frame in which the preshock medium is at rest by adding 355 km s-1 to and , we have , shock velocity and post-shock velocity , the velocity we would expect to observe for the X-ray emitting region, 3/4 of the unobserved . However, the velocity we actually observe for the X-ray emitting region, km s-1 (derived in §2.1.1) implies a shock velocity in the Rankine-Hugoniot frame of 4/3 that, or km s-1. This corresponds to a higher post-shock plasma temperature of K, which is incompatible with our observed spectrum.
The X-ray emission from the outer lobe-jets is thus not consistent with the temperature we derive from its apparent motion. Using the shock scheme of Pravdo et al. (2001), this can be resolved if the shock is encountering a medium that is already moving in the observer’s rest frame outward ahead of the jet at km s-1 so that the relative motion of the post shock region and the ambient medium is (3/4 km s-1, with as obtained from the X-ray spectrum. Incidentally, this implies the unobserved shock is moving in the observer’s rest frame at 670 km s-1.
Of course, the temperature of K derived from the motion of the X-ray emitting region assumes thermal equilibrium, which is not always the case at a shock front. For example, in bow shock models there are ways material can cool by escaping perpendicular to the direction of motion (Hartigan et al, 1987). This leaves the alternate possibility that the ambient material is not moving outward.
In order to characterize the density of the lobe-jets’ X-ray emitting material we use the unabsorbed 0.25 - 2.0 keV flux from the NE outer lobe-jet (see Table 1) with a resulting luminosity of Lx = 7.0 ergs s-1. Taking the X-ray emitting region to be approximately 3, or AU, and assuming the X-ray radiation is optically thin bremsstrahlung emission from a plasma with solar abundances, the post-shock number density in the NE outer X-ray lobe-jet is
| (1) |
where is the 2000.7 number density, is the 2000.7 X-ray source flux and is the value of the radiative cooling function from R. J. Edgar, in Binney & Tremaine (1987) at T K.
The X-ray radiative cooling time can be found using the density and the plasma temperature of 1.74 K. This cooling time, which takes into account bound-bound, free-free, bound-free, free-bound and electron scattering radiation (R. J. Edgar, in Binney & Tremaine, 1987) is
| (2) |
This estimated radiative cooling time of the NE lobe-jet is yrs. The values of source intensity quoted for the two epochs in Table 1 are not different at 90 per cent confidence, so we cannot show any compelling evidence that the NE lobe-jet has changed its X-ray luminosity between the two observations.
The power law component of the NE lobe-jet as seen in the fit to the energy spectrum could be related in some way to the power law emission seen in the inner jets (Nichols et al, 2007). Perhaps we are even seeing nonthermal emission from the very jet that is heating the lobe gas to million degree temperatures.
3.2 Southwest Outer Lobe-Jet
In the SW, the X-ray emission largely disappeared between 2000.7 and 2004.0, presumably because the hot gas cooled to below K. The roughly 3 X-ray bright spot corresponds to an emission region with AU diameter, as in the NE lobe-jet. The X-ray luminosity in 2000.7, using the unabsorbed 0.25 - 2.0 keV flux listed in Table 2, was L erg s-1. From equation (1), the SW outer lobe-jet density is 71 cm-3. Using this density and Equation (2), the radiative cooling time is 1288 years. Of course, it is always possible that the emitting region is clumped so that its average density is much higher and its cooling time much shorter. However, we see no evidence for that in the Chandra image at a size scale of 100 AU. It could also be that X-ray radiation is not the only source of cooling for the SW lobe-jet. The timescale for cooling by adiabatic expansion could produce an observable effect in just a few years. Assuming the X-ray emitting region is expanding adiabatically at the sound speed, in 3.3 years the radius of the emitting region increases to . The temperature change can be calculated via the adiabatic relation:
| (3) |
Using =5/3 for a monatomic gas, with cs==123 km s-1 (Osterbrock & Ferland, 2006, pg. 163) the final temperature after adiabatic expansion for 3.3 y is expected to be lower by 40%. If we thus assume the lobe-jet is expanding adiabatically the plasma temperature is expected to drop from 1.39K to K (for small changes in d) between 2000.7 and 2004.0. This temperature drop would shift the X-ray emission to lower energies, difficult for Chandra to detect.
3.3 Mass, Kinetic Energy and Mass Loss in the Lobe-Jets
Using the density derived above, the images for size scale and the assumption of a uniform spherical emitter, the mass of the lobe-jets emitting X-rays in 2000.7 is estimated for the sum of the NE and SW lobe-jets to be 8.3 10 M☉. The mass loss from the giant was estimated to be 10-8 M☉ yr-1 (Seaquist & Taylor, 1990) (but see Kafatos & Michalitsianos (1982), a much higher estimate based on assumption of a high orbital eccentricity), so the X-ray lobe-jet mass is roughly equal to the total mass loss from the giant in a few years. In the NE lobe-jet we can estimate the mass loss by combining the estimated mass of the x-ray emitting material, its measured outflow velocity and its size to be . We cannot make a similar estimate for the SW lobe-jet since it faded so much.
The kinetic energy in the lobe-jet is of interest in order to determine if it can provide the energy in the lobe-jet to power the X-ray emission. Using the velocity of 580 d km s-1 derived above, the kinetic energy in the NE lobe-jet is 1.8 10 J. The thermal energy needed for the X-rays at the temperature of T=1.74106 K, is 1.910 J. The lobe-jet kinetic energy is about ten times its thermal energy and could power its x-ray emission for 2000-6000 yr.
4 Conclusions
The NE lobe-jet X-ray emission is interpreted as due primarily to a hot plasma witha faint power law component, indicating an energetic collmiated outflow interactin with circumstellar gas at a distance of 1600-2000d AU from the central binary. Its characteristics appear similar to those of HH objects.
Our calculated value of the NE lobe-jet’s density can be compared to previous determinations (Kafatos et al., 1986; Meier & Kafatos, 1995; Hollis et al., 1991). These previous reports of density are derived from UV and optical emission line strength measurements and modeling. They range from n in the HII region surrounding the central star to n in the brighter optical/UV knots, to n in a region near our SW lobe-jet. It appears the density of the X-ray emitting region is quite different from that in most of the regions emitting UV and optical. However, we have examined the locations of the regions emitting UV and optical in these reports and found none to be coincident in position, and of course none in time with the X-ray density determinations reported here. The whole of the observations and modeling to date suggest a region surrounding R Aqr with density and temperature varying considerably in time and space. The higher density of UV emitting material may have accumulated over a longer time, perhaps being hot enough originally to emit X-rays, then cooling to UV temperature.
The mass of the X-ray emitting material is found to be of order the mass loss per year of the red giant. If the material emitting X-rays in these lobe-jets is coming from the giant wind, it’s unlikely that more than of order one percent of the wind ends up in the lobe-jets, because of the large separation between the giant and the compact companion, and the inefficiency of capture and ejection by the compact companion. Therefore, this material would have accumulated over perhaps a few hundred years, unless it was ejected in an episode of much greater mass loss, such as occurred in 1925 and perhaps again in the 1964-1974 time frame (Willson, Garnavich and Mattei, 1981) Other symbiotics such as CH Cyg and Z And have had outbursts of (Hack et al, 1986; Skopal et al, 2002). Another scenario to account for the mass around the NE lobe-jet is that the X-ray emitting material is not all jet material but surrounding nebula heated by the jet. The compact object could eject a small amount of energetic material in a tightly collimated jet. The jet then impacts the dense wall (Solf & Ulrich, 1985), ablating material at temperatures high enough to emit X-rays.
In the NE lobe-jet region the product of density and temperature, i.e. the pressure, is about the same for the UV emitting regions ( cm K) and the X-ray lobe-jets ( cm K) . However, in the SW the pressure of the UV emitting material ( cm K) is much lower than of the X-ray material ( cm K). This permits expansion of the X-ray emitting material in the SW, whereas in the NE it would be confined by the UV emitting material.
Radio observations of the outer lobe-jets reveal plasma moving at 90 km s-1, or even slower, considering the error estimates on that velocity. This adds to the complex structure of the jet as the radio emission is lagging behind the X-ray plasma. It suggests that the radio source is not closely associated with these lobe-jets, but may be a relic of past activity emitting thermal radiation at a lower temperature.
The conditions in R Aqr can be compared with those in another nearby symbiotic binary, Mira itself (o Ceti). They both have roughly the same orbital separation, 70 AU for Mira (see Wood & Karovska (2004)) and 20 AU for R Aqr assuming an orbital period of 44 yr (Willson, Garnavich and Mattei, 1981) and a system mass of 2 M☉, but Mira has no extensive jets. Its accretion rate onto Mira B is estimated to be 8-30 with a total mass loss from Mira A of 0.4-4 (Wood & Karovska, 2004). Perhaps R Aqr has jets because more of the giant’s lost mass finds its way to the compact companion.
The properties of the outer lobe-jets in R Aqr can be compared with parameters of other symbiotic jets. Fifteen out of about 200 symbiotics are known to have optical or radio jets roughly similar to the R Aqr inner jets. The only other system known to have an x-ray jet is CH Cyg. The CHCyg Jet is more similar to the inner jets seen in R Aqr than the outer lobe/jsets discussed in this paper. There is no obvious thermal 106 K extended emission. Since CH Cyg is essentially unresolved, and at the same distance from us as R Aqr, we conclude that there’s no counterpart to the jets discovered here. Therefore, at the present state of observational knowledge, R Aqr is not a typical symbiotic star jet. In fact it is the only symbiotic observed to have extended lobe-jets. Future high angular resolution x-ray observations may discover others, however, since there has been no systematic survey of that type.
Mass outflow rates in symbiotics have been estimated using radio observations and models. A comprehensive study was done Seaquist & Taylor (1990) resulting in mass loss estimates for 26 symbiotics. They range from to . Their estimate for R Aqr is . Therefore, one could say that R Aqr’s mass loss appears to be in the mid range of mass losses in symbiotics, so it does not appear that the extended lobe-jets of R Aqr are caused by greater mass loss than in other symbiotics.
The Chandra X-ray data presented here complement previous UV, optical, and radio investigations in that they are consistent with an episodic collimated flow originating in an accretion disk system. The Chandra data map similar jet structures to those seen at longer wavelengths. However, they have revealed new characteristics of the physics of the jet. The lobe-jets are moving much faster than previously thought by at least a factor of five. However, the temperature we observe in the NE lobe-jet is lower than expected for a shock generated by jet material colliding with stationary material, and suggests that the jet is moving into material that is itself already moving outward. It appears the cooling time for the SW lobe-jet is much shorter than expected from radiative cooling, so it may have cooled by adiabatic expansion into a less dense surrounding medium in the 3.3 years between the two observations.
References
- Anders & Grevesse (1989) Anders, E. & Grevesse, N. 1989 in “Cosmic Abundances of Matter” ed. C. Jake Waddington AIP Conf. Proc. 183 p.1
- Arnaud (1996) Arnaud, K. A., 1996 in ASP Conf. Ser. 101 Astronomical Data Analysis Software and Systems V. ed. G. H. Jacoby & J. Barnes (San Francisco: ASP), p. 17
- Bodo et al (1998) Bodo, G., Errico, L., Massaglia, S. Rossi, P., Trussoni, E., & Vittone, A. 1998, Astronomy & Astrophysics Transactions 17 321
- Brocksopp et al (2004) Brocksopp, C., Sokoloski, J., Kaiser, C., Richards, A., Muxlow, T., & Seymour, N. 2004 MNRAS, 347 430
- Cowley et al (1998) Cowley, A., Schmidtke, P., Crampton, D. & Hutchings J. 1998, ApJ, 505, 854
- Chandra X-ray Center (2003) Chandra X-ray Center. 2003, The Chandra Proposers’ Observatory Guide, TD 403.00.006, (Cambridge, MA: CXC) http://asc.harvard.edu/proposer/POG/index.html.
- Draine & McKee (1993) Draine, B. & McKee, C. “Theory of Interstellar Shocks” 1993 ARA&A, 31, 373
- R. J. Edgar, in Binney & Tremaine (1987) Binney, J. and Tremaine, S., “Galactic dynamics”, Princeton, NJ, Princeton University Press, 1987
- Favata et al. (2002) Favata, F., Fridlund C., Micela G., Sciortino S., Kaas A. 2002, A&A, 386, 204
- Favata et al (2006) Favata, F., Bonito, R., Micela, G., Fridlund, M., Orlando, S., Sciortino, S., & Peres, G. 2006, A&A, 450, L17
- Galloway & Sokoloski (2004) Galloway, D. & Sokoloski, J. 2004, ApJ, 613, L61
- Güdel et al (2005) Güdel, M., Skinner, S., Briggs, K., Audard, M., Arzner, K., and Telleschi, A. 2005, ApJ, 626, L53
- Hack et al (1986) Hack, M., Rusconi, L., Sedmak, G., Aydin, C., Engin, S., Yilmaz, N. 1986 A&A, 159, 117.
- Hartigan et al (1987) Hartigan, P., Raymond, J. & Hartmann, L. 1987, ApJ, 316, 323
- Herbig (1980) Herbig, G. 1980 IAU Circ.3535
- Hollis et al. (1991) Hollis, J., Oliversen, R.J., Kafatos, M., Michalitsianos, A.G., & Wagner, R.M. 1991, ApJ, 377, 227
- Hollis, Pedelty & Kafatos (1997) Hollis, J., Pedelty, J. & Kafatos, M. 1997, ApJ, 490, 302
- Hollis, Pedelty & Lyon (1997) Hollis, J., Pedelty, J. & Lyon, R. 1997, ApJ, 482, L85
- Hünsch et al (1998) Hünsch, M., Schmitt, J., Schröder, K., & Zickgraf, F. 1998, A&A, 330, 225
- Jura & Helfand (1984) Jura, M., & Helfand, D. 1984, ApJ, 287, 785
- Kafatos & Michalitsianos (1982) Kafatos, M. & Michalitsianos, M. 1982 Nature, 298 540
- Kafatos et al. (1986) Kafatos, M., Michalitsianos, M.& Hollis, J. M. 1986 ApJ, 62 853
- Kafatos et al. (1989) Kafatos, M., Hollis, J. M., Yusef-Zadeh, F., Michalitsianos, A. G., & Elitzur, M. 1989, ApJ, 346, 991
- Kahabka and van den Heuvel (2006) Kahabka, P. & van den Heuvel, E. 2006 in “Compact Stellar X-ray Sources” Lewin, W. & van der Klis, M. eds., Cambridge University Press, Cambridge, England, p. 468
- Kellogg, Pedelty & Lyon (2001) Kellogg, E., Pedelty, J. & Lyon, R. 2001, ApJ, 563, L151
- Kenyon et al. (1988) Kenyon, S., Fernandez-Castro, T. and Stencel, R. 1988 AJ, 95, 1817
- Li & Kastner (2004) Li, J., Kastner, J. H., Prigozhin, G. Y., Schulz, N. S., Feigelson, E. D. and Getman, K. V. 2004, ApJ, 610, 1204
- Meier & Kafatos (1995) Meier, S. & Kafatos, M. 1995 ApJ451 359
- Nichols et al (2007) Nichols, J., Anderson, C., DePasquale, J., Kellogg, E., Sokoloski, J., Pedelty, J. 2007, ApJ, (submitted)
- Osterbrock & Ferland (2006) Osterbrock, D. & Ferland, G. 2006 “Astrophysics of Gaseous Nebulae and Active Galactic Nuclei” 2 ed. Univ. Sci. Books, Sausalito, California.
- Paresce & Hack (1994) Paresce, F. & Hack, W. 1994 A&A, 287, 154
- Pravdo et al. (2001) Pravdo, S., Feigelson, E., Garmire, G., Maeda, Y., Tsuboi, Y., Bally, J. 2001, Nature, 413, 708
- Seaquist & Taylor (1990) Seaquist, E. and Taylor,A. 1990 ApJ, 349 313
- Shu (1991) Shu, Frank H. 1991 “The physics of astrophysics”, v.2 “Gas Dynamics”, p. 215 Univ. Sci. Books, Mill Valley CA
- Skopal et al (2002) Skopal, A., Bode, M. F., Crocker, M. M., Drechsel, H., Eyres, S. P. S., Komz̆ík, R. 2002 MNRAS, 335, 1109
- Smith et al (2001) Smith, R., Brickhouse, N., Liedahl, D., Raymond, J. 2001, ApJ, 556, L91
- Soker & Kastner (2003) Soker, N. & Kastner, J. 2003, ApJ, 583, 368
- Solf (1992) Solf, J. 1992, A&A, 257, 228
- Solf & Ulrich (1985) Solf, J. & Ulrich, H. 1985, A&A, 148, 274
- Stark et al (1992) Stark, A. A., Gammie, C. F., Wilson, R. W., Bally, J., Linke, R. A., Heiles, C., & Hurwitz, M. 1992 ApJS, 79, 77
- Swartz et al (2005) Swartz, D., Drake, J., Elsner, R., Ghosh, K., Grady, C., Wassell, E., Woodgate, B., & Kimble, R. 2005 ApJ, 628, 811.
- Tomov, Munari & Marrese (2000) Tomov, T., Munari, U. & Marrese, P. 2000 A&A, 354, L25
- Viotti et al. (1987) Viotti, R., Piro, L., Friedjung, M., & Cassatella, A. 1987, ApJ, 319, L7
- Wallerstein & Greenstein (1980) Wallerstein, G., Greenstein, J. L. 1980 ApJ, 258, L35
- Willson, Garnavich and Mattei (1981) Willson, L. A., Garnavich, P. and Mattei, J. A. 1981 Inf. Bull. Variable Stars No. 1961
- Wood & Karovska (2004) Wood, B. & Karovska, M. 2004 ApJ, 601, 502
- Zombeck (1990) Zombeck, M. 1990 Handbook of Space Astronomy & Astrophysics, 2 ed.Cambridge U. Press.
| Parameter | 2000.7 | 2004.0 |
|---|---|---|
| Counts, E0.2 keV | 509 | 500 |
| Exposure, s | 22717 | 36523 |
| APEC kT (keV) | 0.15[0.13,0.17] | 0.14 [0.12,0.16] |
| APEC normalization (10-6ph cm-2 s-1 keV-1) | 32[22,46] | 38[27,47] |
| Power law photon index, | 5.6[5.3,5.8] | 5.1[4.7,5.6] |
| Power law normalization (10-6ph cm-2 s-1 keV-1) | 1.6[0.25,1.8] | 1.8[1.0,2.7] |
| Observed 0.25-2.0 keV flux (10-14 ergs cm-2 s-1) | 9.7[6.7,13.9] | 8.1[5.8,10.0] |
| Source 0.25-2.0 keV flux (10-14 ergs cm-2 s-1) | 14.6[10.0,21.0] | 11.7[8.3,14.5] |
| Reduced | 0.98 | 0.96 |
| Confidence (%) | 49 | 52 |
Note. — Values are quoted as best_fit[lower 90% limit,upper 90% limit].
| Epoch | ||
|---|---|---|
| Parameter | 2000.7 | 2004.0 |
| Counts, E0.2 keV | 226 | 65 |
| Exposure, s | 22717 | 36523 |
| APEC kT (keV) | 0.12[0.10,0.13] | 0.12 [0.10,0.16] |
| APEC normalization (10-5ph cm-2 s-1 keV-1) | 4.6[3.5,7.0] | 1.2 [0.5, 1.8] |
| Observed 0.25-2.0 keV flux (10-14 ergs cm-2 s-1) | 3.0[2.3,4.6] | 0.83[0.33,1.76] |
| Source 0.25-2.0 keV flux (10-14 ergs cm-2 s-1) | 4.0[3.0,6.1] | 1.1[0.5,1.7] |
| Reduced | 1.07 | 1.12 |
| Confidence (%) | 38 | 34 |
Note. — Values are quoted as best_fit[lower 90% limit,upper 90% limit]