Fully permanent magnet atom chip for Bose-Einstein condensation
Abstract
We describe a proof-of-principle experiment on a fully permanent magnet atom chip. We study ultracold atoms and produce a Bose-Einstein condensate (BEC). The magnetic trap is loaded efficiently by adiabatic transport of a magnetic trap via the application of uniform external fields. Radio frequency spectroscopy is used for in-trap analysis and to determine the temperature of the atomic cloud. The formation of a Bose-Einstein condensate is observed in time-of-flight images and as a narrow peak appearing in the radio frequency spectrum.
pacs:
33.20.Bx, 37.10.Gh, 81.16.TaI Introduction
Miniature patterns of magnetic field sources integrated on planar substrates, ‘atom chips’, are used to manipulate magnetically trapped clouds of ultracold neutral atoms FolKruHen02 ; Rei02 ; DekLeeLor00 ; ForZim07 . Atom chips based on current-carrying wires are relatively simple and versatile tools, readily used to produce Bose-Einstein condensates (BEC) HanHomHan01 ; OttForSch01 . Subsequently a wide range of experiments have been performed; for example, BECs can be precisely positioned with atomic conveyer-belt potentials HanHomHan01 ; GunKemFor05 and phase-coherent splitting and interference of condensates has been achieved using double-well potentials SchHofKru05 ; JoShiPre06 .
Atom chips can also incorporate permanent magnetic materials SinCurHin05 ; HalWhiSid06 ; BarGerSpr05 ; BoyStrPri06 ; SheHeiPfa06 , with significant additional advantages over current-carrying wires alone. Specifically, permanent magnet atom chips do not suffer from current noise which is partly responsible for trap loss and heating of atoms near conducting surfaces SinCurHin05 . They are also well suited for tightly confining trapping potentials without the technical problems associated with high current densities. Furthermore, patterned permanent magnetic materials provide greater design freedom, allowing complex magnetic potentials to be realized such as ring-shaped waveguides or large two-dimensional arrays of microtraps FerGerSpr05 ; GhaKieHan06 ; GerWhiSpr07 .
One obvious drawback of permanent magnets however is the relatively limited degree of dynamic control available over the associated trapping potentials. The permanent magnetic field is a particular source of difficulty when loading the atom chip. As such, most permanent magnetic structures rely on current carrying wires to load and to complete the permanent magnetic trapping potential. Analysis is another complication, because standard techniques such as free ballistic expansion are impossible in the permanent magnetic field. These basic challenges need to be addressed before more sophisticated atom chip designs incorporating permanent magnets can be realized.
In this paper we describe the loading of ultracold atoms and evaporative cooling used to produce a BEC in a fully permanent magnetic microtrap, without additional external control fields. Although the permanent magnetic chip is in principle ”self-biasing” we use a small field derived from an externally installed permanent magnet to tune the Ioffe field of the trap. To load the permanent magnet trap we adiabatically transfer the atoms to the chip surface from a quadrupole magnetic trap by applying a combination of bias magnetic fields. During loading we apply a radio frequency field to evaporatively cool the cloud. Analysis of the cloud temperature and spectral distribution is then performed using radio frequency spectroscopy MarHelPri88 ; HelMarPri92 ; BloHanEss99 ; GupHadKet03 ; ChiBarGri04 ; WhiHalSid07 . This technique is also used to observe the BEC transition in-situ without expansion from the trap. It is also possible to eject the cloud from the self-biased trap by rapidly switching on uniform magnetic fields to observe the BEC transition using conventional absorption imaging.
II Setup
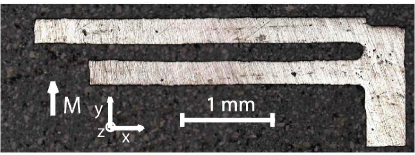
Our atom chip consists of a F-shaped permanent magnet structure (Fig. 1), designed to produce a self-biased Ioffe-Pritchard microtrap 180 m from the chip surface BarGerSpr05 ; XinBarGerPP . It is cut from 40 m thick FePt foil by computer numerical controlled (CNC) spark erosion and is glued to an aluminium-coated glass substrate. The magnetization is oriented in-plane along the -direction and was measured using superconducting interference devices (SQUID) magnetometry as 430 kA/m. Assuming a uniform magnetization, we calculate an anisotropic, harmonic trapping potential with trapping frequencies of 11 kHz and 30 Hz in the radial and axial directions respectively. The calculated magnetic field at the trap minimum (Ioffe field) is 1 G, in the -direction.
It was found experimentally that uncompensated stray fields, such as the earth magnetic field in combination with field corrugation caused by the coarseness of the magnetic structure, added field components in the x-direction on the order of 2 Gauss. The design aimed at a rather low Ioffe-field to achieve tight radial confinement, making it necessary to tune the Ioffe-field to a higher value to avoid field zeros in the trap. This was done with an externally installed permanent magnet, thus preserving the permanent magnetic nature of the trap. The permanent magnet was placed on the optical table ( cm below the chip), adding a homogeneous field of G in the x-direction. The trap frequencies in the lowest minimum were then measured to be 5.2 kHz radial and 128 Hz axial with a field minimum around 2.7 G. Due to the field corrugation, the axial confinement is significantly larger than expected. We attribute the field corrugation mainly to the rather unsophisticated production of the chip and feel that a more advanced atom chip (for instance, produced with patterning techniques based on optical lithography) could be fully self-biased. We note that in fact it was possible to load a secondary axial minimum of the trap and perform evaporative cooling without the permanent magnet installed, but less efficiently.
The atom chip is mounted upside down in a quartz-cell vacuum chamber ( cm3), which is surrounded by three orthogonal coil pairs that can produce magnetic fields G with any desired polarity. The coils are used to load the atoms into the permanent magnet trap as described below. The loading procedure ends by ramping the currents to zero and short-circuiting the coils with relays. The latter significantly reduces the residual magnetic field noise. Additional sources of magnetic field noise, such as the current supplies themselves, were identified and placed m from the experiment. Residual background field noise at 50 Hz was further reduced by feeding a phase and amplitude adjusted 50 Hz signal derived from the mains to a large coil pair placed around the experiment. Our efforts reduced the root-mean-square magnetic field noise in the direction from more than 20 mG to below 0.5 mG. Radio frequency (rf) fields used for forced evaporative cooling and for rf spectroscopy of the atom cloud are produced by a computer controlled 10-bit direct digital synthesis rf generator MorBelPer07 (AD9959) with four independent outputs. We use two outputs connected to separate antennas for evaporative cooling and rf spectroscopy.
III Loading procedure
In this section we describe the loading process of the permanent magnetic trap using external uniform bias fields. The possibilities and restrictions for moving magnetic traps by this method have been described in detail in GerSpr06 . Efficiently loading atoms into the trap proves to be nontrivial since at the end of the loading procedure all external fields should be turned off. The main difficulty arises from the already present field minimum, located close to the chip, containing no atoms at the start of the loading process. This minimum can act as a leak when the trap containing the atoms is brought too close to it. We have optimized a particular loading trajectory that avoids this secondary minimum as much as possible. Another important feature is that the magnetic field minimum is kept above zero during the last part of the loading process, making it possible to evaporatively cool during the transfer without significant loss due to Majorana spin-flip transitions.
We collect approximately 87Rb atoms in a mirror magneto-optical trap (MOT). The MOT is made with the help of external field coils, at a distance of 8 mm from the surface where the field of the chip is negligible. The atomic cloud is then compressed (CMOT) and optically pumped to the magnetically trappable state. After switching all laser beams off, the cloud is trapped 8 mm below the chip surface using the quadrupole magnetic field produced by one pair of coils operated in anti-Helmholtz configuration. Additional uniform fields can bring this trap closer to the chip. In close proximity to the chip surface the field gradient produced by the F-shaped magnet is large enough to hold the atoms against gravity and the anti-Helmholtz coils can be turned off. At this point two magnetic field minima exist. A weak trap containing the atoms is produced by the magnet in combination with a uniform bias field and is located far from the chip surface. A tighter trap close to the chip surface also originates from the magnet and is at this point still vacant.
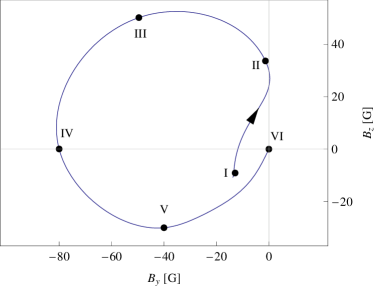
An efficient method to transfer atoms to the permanent magnetic trap is to move the atoms to the location of the final trap while avoiding the secondary trap. We use a time ordered sequence of uniform magnetic fields in the - and -directions as shown in Fig. 2. The merging of the two minima is prevented through an additional component of the applied field. The component is then inverted, as shown in Fig. 2, moving the trap containing the atoms towards the chip, while the empty trap retreats. Finally, after ramping the fields off, the atom cloud is left in the permanent magnetic trap.
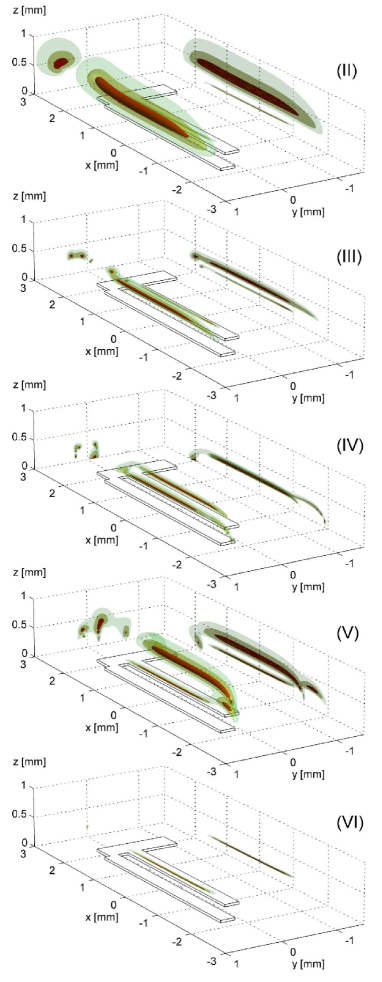
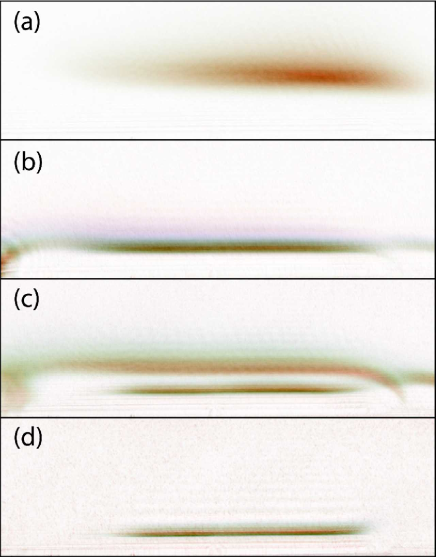
Three-dimensional calculations of the magnetic field iso-surfaces during the loading are shown in Fig. 3(II-VI). During this transfer the magnetic field gradient of the filled trap increases from 60 G/cm to 6800 G/cm which leads to significant heating of the atom cloud. Although the two field minima do not merge, they pass each other separated by a finite potential barrier of G which allows energetic atoms to spill over to the decompressing trap. This loss mechanism can take away up to of the magnetically trapped atoms. However, it has been possible to load atoms into the permanent magnet trap. A series of absorption images at various detunings are taken during the loading in order to create a series of optical spectra of the trapped cloud and are shown in Fig. 4. The observed atom distributions compare very well with the calculated field distributions in Fig. 3. The cloud temperature inferred from the optical spectrum in the self-biased trap is approximately mK, yielding a peak phase space density of . Here, is the atom number, is Planck’s constant, is the geometrical mean trap frequency, and is the Boltzmann factor.
To improve the starting conditions for the final evaporation stage and to avoid loss due to the finite barrier height we apply forced radio frequency evaporative cooling already during the compression of the trap. Evaporative cooling however requires a trap with non-zero minimum to prevent spin-flip loss. We choose a trajectory that always maintains a non-zero minimum during the final approach of the atomic cloud. It is non trivial that such a trajectory exists GerSpr06 . We have found that the trap turns into a Ioffe trap after the turn off of the anti-Helmholtz coils and remains a Ioffe trap during the rest of the loading process (steps II-VI in Fig. 3). The preliminary evaporative cooling stage during the transfer consists of a 6 s linear rf ramp from 35 MHz to 8 MHz. At the end of the ramp all externally controlled fields are turned to zero and the cloud is trapped in the potential produced by the magnetic structures alone. After loading, the cloud contains approximately atoms at a temperature of K yielding a peak phase space density of . Although the number of atoms is relatively small, the high trap frequencies result in a mean collision rate of s-1. A final rf evaporative cooling stage is performed with a linear rf sweep over 2.3 s from 8 MHz down to 1.9 MHz which lowers the trap depth from 600 K to K.
IV Radio frequency spectroscopy

The most commonly used diagnostic technique for ultracold atoms is free ballistic expansion followed by absorption imaging. In our case this is not possible due to the permanent character of the magnetization of our chip. Instead, we employ radio frequency spectroscopy to characterize the ultracold atom cloud in the permanent magnetic trap. This allows us to directly probe the energy distribution of the confined cloud and to extract the cloud temperature without ballistic expansion.
The cloud is probed by applying a radio frequency pulse of frequency for a duration of 0.5 ms. Trapped atoms satisfying the resonant condition may be coupled to untrapped magnetic states and are then immediately lost from the trap. Here, is the atomic Landé factor, is the Bohr magneton, and is the local magnetic field modulus. We measure the number of lost atoms by applying a magnetic field of 25 G in the direction to push the atoms away from the chip surface and to weaken the trapping potential for detection. Resonant absorption imaging can then provide an accurate measure of the number of remaining atoms.
In Fig. 5 radio frequency spectra are shown for various final evaporation frequencies. Above the BEC transition temperature , we can fit a theoretical model to the radio frequency spectra to obtain the temperature of the cloud, whereas below radio frequency spectroscopy can be used to observe the BEC transition without free expansion and to measure the chemical potential . The following sections describe both techniques.
IV.1 Thermometry
If we assume that the atoms move through the resonant surface at a constant speed perpendicular to the surface, we can describe the spin-flip transition probability by the Landau-Zener expression VitSuo97 ; Wit05 . To obtain a model for the loss rate spectrum we integrate the spin-flip probability over the velocity distribution and over the resonant surface. We introduce the radio frequency above the trap bottom and the thermal frequency . In the case of a gas well above the condensation temperature we find that the loss rate in an isotropic trap is well described by
| (1) |
where we introduced the resonant atomic spectral distribution , using Boltzmann statistics:
| (2) |
As it can be seen from Eq. (1), the loss rate becomes independent of the trapping parameters and reflects the potential energy distribution [Eq. (2)] for sufficiently small Rabi frequencies . This arises from the fact that the out-coupling rate becomes independent of the momentum distribution under the above assumptions.
For temperatures approaching , Eq. (2) is no longer valid since it is based on Boltzmann statistics. For Bose-Einstein statistics we cannot evaluate the integrals to obtain an expression for similar to Eq. (1). Instead we integrate the Landau-Zener probability numerically, including the trap anisotropy. To obtain the cloud temperature from our data, we fix using the measured atom number by setting . The results of this calculation are shown as solid lines in Fig. 5.
We can alternatively assume that Eq. (1) also holds for Bose-Einstein statistics with the correct potential energy distribution (dashed lines in Fig. 5). For a non-interacting cloud with the resonant spectral distribution is given by
| (3) |
Here is the polylogarithm function with base 3/2, and is the chemical potential. The inferred temperatures deviate by less than 15% from the numerically obtained results.
As an alternative temperature measurement we also observe the axial density distribution of the cloud in the trap. To avoid problems in the absorption imaging due to the high optical density of the cloud we lift the magnetic field at the trap bottom by 50 G to weaken the radial confinement, and detune the probe laser by 18 MHz to the blue of the transition. By fitting the axial density distribution we obtain the temperature of the cloud.
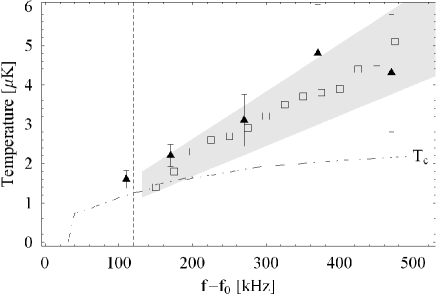
In Fig. 6 we compare the temperatures found from spectra and the inferred temperature from the axial density distribution of the cloud for different final evaporation radio frequencies. Also shown is the confidence interval of the temperature based on the axial size. This interval is estimated for systematic errors such as lensing of the probe light by the dense cloud, pixel size calibration errors, and finite imaging resolution. The plot shows excellent agreement between the two temperature measurements.
IV.2 Bose-Einstein condensation
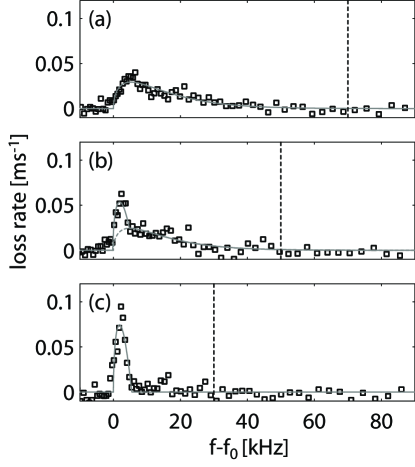
To observe the onset of Bose-Einstein condensation we increased the probing time to 10 ms and decreased the radio frequency amplitude by a factor of 3 to minimize power broadening. It took considerable effort in magnetic field noise reduction to obtain the resolution needed to observe the narrow condensation peak. In addition, it was necessary to maintain the same cycle for the applied magnetic fields throughout the experiment to minimize hysteresis effects in the magnetic material and surrounding structures, which otherwise could lead to variations in the trap bottom of several kHz. The observed spectra below are shown in Fig. 7. Lowering the final radio frequency results in a bimodal spectrum and eventually in a spectrum of a nearly pure condensate with a width of 5 kHz. This agrees well with the chemical potential derived from atom number and trap frequencies of = 4.3 kHz. Each spectrum is averaged 6 times and consists of about 70 data points, spread nonlinearly over the spectral range to emphasize the bimodal nature and condensate peak.
V Expansion
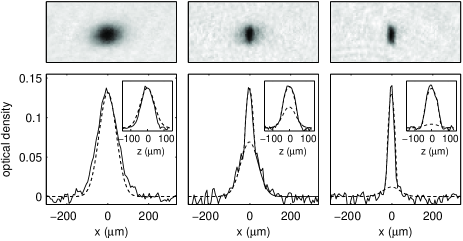
As an alternative way to identify the BEC transition, we ramp on, over 2 ms, a magnetic field of 50 G, which rapidly transfers the atom cloud 1 mm away from the chip surface. At this position all magnetic fields are suddenly switched off and the acquired kinetic energy of the atoms is sufficient to overcome the remaining potential barrier. The cloud is accelerated further by gravity and the rapidly decaying field of the chip. After 3.5 ms an absorption image is taken to reveal a partially expanded atom cloud (Fig. 8). As the final trap depth is reduced, the atom distribution becomes bimodal with a narrow central peak and a change in aspect ratio. Combining these absorption images with the radio frequency spectra we find the BEC transition at a trap depth of about K, with 7000 atoms at a temperature of K, which is close to the expected value of K. Continued evaporation results in a nearly pure BEC consisting of atoms.
Although this ejection method is useful for observing the phase transition to BEC it cannot be reliably used to obtain temperatures because of the non adiabatic nature of the expansion and the large magnetic field gradients during the expansion. It can however be used to obtain condensate fractions.
We observe strong heating of the ultracold cloud ( 6 K/s) during the final stage of evaporation. This is likely caused by three-body collisions as the estimated density at the trap center near is quite high, cm-3. As a result, the lifetime of the condensate is 15 ms without a rf shield and 150 ms with a rf shield MewAndDru96 ; BurGhrMya97 . The quoted density corresponds to a three-body decay rate of 3 s-1 BurGhrMya97 ; SodGueDal99 . It is thus likely that three-body decay limits the final number of condensate atoms during the last evaporation stage.
It is interesting to note that condensation is observed in the expanded cloud at higher evaporation frequencies than in the rf spectra. We suspect this is because of the long rf probing time necessary to obtain the desired resolution and signal-to-noise ratio, causing considerable heating during the radio frequency pulse. It is also possible that the signal-to-noise ratio does not allow the observation of small condensate fractions, because it requires the removal of a substantial fraction of atoms.
VI Conclusions
In conclusion, we have presented solutions to the problems of loading and analysis of an atomic cloud on a fully permanent magnetic chip. We have demonstrated an efficient loading procedure relying on the adiabatic movement of Ioffe traps using uniform external fields, allowing the application of forced evaporative cooling during loading. After loading, radio frequency spectroscopy is used to characterize the cloud. A model is derived for fitting rf spectra to obtain cloud temperatures. The fitted temperatures compare well to temperatures derived from fitting the in-trap axial density distribution. Noise reduction and radio frequency power reduction give the resolution needed to observe the onset of Bose-Einstein condensation in radio frequency spectra. This results in bimodal spectra and eventually in a spectrum of a nearly pure condensate. Alternatively, condensation is observed by ejecting the atomic cloud by switching external magnetic fields. Together, these techniques have allowed us to analyze our atomic cloud in the permanent magnetic field.
Acknowledgements.
We gratefully acknowledge Y. T. Xing and J. B. Goedkoop for the production of the magnetic structure. This work is part of the research program of the Stichting voor Fundamenteel Onderzoek van de Materie (Foundation for the Fundamental Research on Matter) and was made possible by financial support from the Nederlandse Organisatie voor Wetenschappelijk Onderzoek (Netherlands Organization for the Advancement of Research). This work was also supported by the EU under contract MRTN-CT-2003-505032.References
- (1) R. Folman et al., Adv. At. Mol. Opt. Phys. 48, 263 (2002).
- (2) J. Reichel, Appl. Phys. B 75, 469 (2002).
- (3) N. Dekker et al., Phys. Rev. Lett. 84, 1124 (2000).
- (4) J. Fortagh and C. Zimmermann, Rev. Mod. Phys. 79, 235 (2007).
- (5) W. Hänsel, P. Hommelhoff, T. W. Hänsch, and J. Reichel, Nature 413, 498 (2001).
- (6) H. Ott et al., Phys. Rev. Lett. 87, 230401 (2001).
- (7) A. Günther et al., Phys. Rev. A 71, 063619 (2005).
- (8) T. Schumm et al., Nature Physics 1, 57 (2005).
- (9) G.-B. Jo et al., Phys. Rev. Lett. 98, 030407 (2007).
- (10) C. D. J. Sinclair et al., Phys. Rev. A 72, 031603(R) (2005).
- (11) B. V. Hall et al., J. Phys. B: At. Mol. Opt. Phys. 39, 27 (2006).
- (12) I. Barb et al., Eur. Phys. J. D 35, 75 (2005).
- (13) M. Boyd et al., Phys. Rev. A 76, 043624 (2007).
- (14) A. Shevchenko et al., Phys. Rev. A 73, 051401(R) (2006).
- (15) T. Fernholz, R. Gerritsma, P. Krüger, and R. J. C. Spreeuw, Phys. Rev. A 75, 063406 (2007).
- (16) S. Ghanbari, T. D. Kieu, A. Sidorov, and P. Hannaford, J. Phys. B: At. Mol. Opt. Phys. 39, 847 (2006).
- (17) R. Gerritsma et al., Phys. Rev. A 76, 033408 (2007).
- (18) A. G. Martin et al., Phys. Rev. Lett. 61, 2431 (1988).
- (19) K. Helmerson, A. G. Martin, and D. E. Pritchard, J. Opt. Soc. Am. B 9, 483 (1992).
- (20) I. Bloch, T. W. Hänsch, and T. Esslinger, Phys. Rev. Lett. 82, 3008 (1999).
- (21) S. Gupta et al., Science 300, 1723 (2003).
- (22) C. Chin et al., Science 305, 1128 (2004).
- (23) S. Whitlock et al., Phys. Rev. A 75, 043602 (2007).
- (24) Y. T. Xing et al., J. Magn. Magn. Mater. 313, 192 (2007).
- (25) O. Morizot et al., arXiv:0704.1974 (2007).
- (26) R. Gerritsma and R. J. C. Spreeuw, Phys. Rev. A 74, 043405 (2006).
- (27) N. V. Vitanov and K.-A. Suominen, Phys. Rev. A 56, R4377 (1997).
- (28) C. Wittig, J. Phys. Chem. B 109, 8428 (2005).
- (29) W. Ketterle and N. van Druten, Phys. Rev. A 54, 656 (1996).
- (30) M. Mewes et al., Phys. Rev. Lett. 77, 416 (1996).
- (31) E. A. Burt et al., Phys. Rev. Lett. 79, 337 (1997).
- (32) Söding et al., Appl. Phys. B 69, 257, (1999).