A SOFT X-RAY STUDY OF TYPE I AGN OBSERVED WITH Chandra HETGS
Abstract
We present the results of a uniform analysis of the soft X-ray spectra of fifteen type I AGN observed with the high resolution X-ray gratings on board Chandra. We found that ten of the fifteen AGN exhibit signatures of an intrinsic ionized absorber. The absorbers are photoionized and outflowing, with velocities in the range km . The column density of the warm absorbing gas is . Nine of the ten AGN exhibiting warm absorption are best–fit by multiple ionization components and three of the ten AGN require multiple kinematic components. The warm absorbing gas in our AGN sample has a wide range of ionization parameter, spanning roughly four orders of magnitude ( ergs cm ) in total, and often spanning three orders of magnitude in the same gas. Warm absorber components with ionization parameter generate an unresolved transition array due to Fe in seven of the ten AGN exhibiting warm absorption. These low ionization state absorbers may also carry away the largest mass outflows from the AGN. The mass outflow rate depends critically on the volume filling factor of the gas, which cannot yet be directly measured. However, upper limits on the mass outflow rates for filling factors of unity can be much greater than the expected accretion rate onto the central supermassive black hole and filling factors as small as 1% can give outflow rates comparable to the accretion rate. There appears to be a gap in the outflow velocities in our sample between km , the origin of which is not clear. The outflow components with velocities below this gap tend to be associated with lower column densities than those with with velocities above the gap.
keywords:
galaxies: active – galaxies: individual – galaxies: Seyfert – techniques: spectroscopic – X-rays: line – emission: accretion – disks :galaxies1 Introduction
X-ray emission from active galactic nuclei (AGN) is believed to be powered by an accretion flow onto a supermassive black hole (SBH). In the unified AGN paradigm, type I AGN have accretion disks at a small angle of inclination to the observers’ line–of–sight. Hard X-ray (2 keV) spectra from type I AGN typically reveal a continuum that is well described by a simple cut–off power–law model, with a fluorescent Fe K line complex (and sometimes a reflection continuum) superimposed (see eg. Reynolds & Nowak (2003) and references therein). The soft X-ray (2 keV) spectra of type I AGN are typically complex and can yield a great deal of information about the distribution and state of matter in the AGN central engine.
| Source | RA | Decl. | Redshift | Galactic | Observation | MEG count | Exposurec |
|---|---|---|---|---|---|---|---|
| (J2000.0) | (J2000.0) | (z) | () a | Start b | rate(ct/s) | (ks) | |
| Fairall 9 | 01 23 45.7 | -58 48 21 | 0.04600 | 3.0 | 2001 Sep 11 | 80 | |
| 3C 120d | 04 33 11.0 | 05 21 15 | 0.03301 | 12.30 | 2001 Dec 21 | 58 | |
| NGC 3227 | 10 23 30.6 | +19 51 54 | 0.00386 | 2.15 | 1999 Dec 30 | 47 | |
| NGC 3516 | 11 06 47.5 | +72 34 07 | 0.00884 | 3.05 | 2001 April 9 | 36 | |
| 2001 April 10 | f | 75 | |||||
| 2001 Nov 11 | 89 | ||||||
| NGC 3783 | 11 39 01.7 | -37 44 18 | 0.00973 | 8.50 | 2001 Feb 24 | 850 | |
| NGC 4051 | 12 03 09.5 | 44 31 52 | 0.00242 | 1.31 | 2000 Mar 24 | 80 | |
| Mkn 766 | 12 18 26.5 | 29 48 46 | 0.01293 | 1.80 | 2001 May 7 | 90 | |
| NGC 4593e | 12 39 39.3 | -05 20 39 | 0.00831 | 1.97 | 2001 Jun 29 | 79 | |
| MCG-6-30-15e | 13 35 53.3 | -34 17 48 | 0.00775 | 4.06 | 2000 Apr 5 | 126 | |
| IC 4329Ae | 13 49 19.2 | -30 18 34 | 0.01605 | 4.55 | 2001 Aug 26 | 60 | |
| Mkn 279 | 13 53 03.5 | +69 18 30 | 0.03045 | 1.64 | 2002 May 18 | 116 | |
| NGC 5548e | 14 17 59.5 | 25 08 12 | 0.01717 | 1.70 | 2000 Feb 5 | 82 | |
| Mkn 509e | 20 44 09.6 | -10 43 23 | 0.03440 | 4.44 | 2001 Apr 13 | 60 | |
| NGC 7314 | 22 35 46.2 | -26 03 01 | 0.00474 | 1.46 | 2002 Jul 19 | 97 | |
| Akn 564 | 22 42 39.3 | 29 43 31 | 0.02467 | 6.40 | 2000 Jun 17 | 50 |
Spectral complexity beyond a simple power law model in the soft X–ray spectrum of an AGN was first observed in MR 2251–178 Halpern (1984). The spectral complexity was due to absorption by partially ionized, optically thin, circumnuclear material. This material, termed the ‘warm absorber’ was proposed as a common constituent of many AGN. ROSAT observations of nearby type I AGN showed that warm absorption was not uncommon, see e.g. (Nandra & Pounds, 1992; Turner et al., 1993). Subsequent observations with ASCA detected O vii and O viii absorption edges due to warm absorption in of type I AGN (Reynolds (1997), George et al. 1998). Observations in the UV band reveal warm absorption with multiple velocity components and ionization states, although the relationship between the UV absorbers and the X–ray absorbers is still not clear (Crenshaw & Kraemer, 1999; Arav et al., 2002). The unprecedented spectral resolution of the gratings on board Chandra and XMM-Newton has permitted the detection of discrete soft X–ray absorption features and emission lines for the first time. The resulting picture of the X–ray warm absorber in many type I AGN is of an outflow exhibiting multiple narrow absorption lines corresponding to different ionization states e.g. (Collinge et al., 2001; Lee et al., 2001; Sako et al., 2001; Kaastra et al., 2002; Netzer et al., 2003; Yaqoob et al., 2003; McKernan et al., 2003a). The present generation of X-ray detectors also have the spectral resolution to detect unresolved transition arrays in moderately ionized Iron (Fe0-15) in several AGN spectra (Sako et al., 2001; Behar et al., 2001; Blustin et al., 2002; Pounds et al., 2003).
Our picture of the X–ray warm absorber is now more complicated, and many fundamental questions remain. Does the warm absorber ‘know’ about the SBH mass, e.g. Morales & Fabian (2002), the accretion rate, or the AGN luminosity? Does radiation pressure dominate the warm absorber outflow? Is there a link between the warm absorber and the Fe K band emission, e.g. Matt et al. (1994)? Only via the analysis of the soft X–ray spectra of a sample of type I AGN can we answer such questions. Here we present the results of a uniform analysis of the soft X–ray data from a sample of fifteen type I AGN observed with the high energy transmission grating spectrometer (HETGS ) on board Chandra (Markert et al., 1995). Our aim is to study the soft X–ray spectra of these AGN so that we may begin to answer some of the outstanding questions about warm absorption in AGN. Of course our study is limited by both our choice of sample and X-ray instrument. The Chandra HETGS bandpass is less sensitive to low ionization state absorbers than the Chandra LETGS bandpass for example. Both the LETGS and the RGS (aboard XMM-Newton) have a higher effective area than the MEG at low energies but the HETGS spectral resolution is superior to both the LETGS and RGS. Utilizing the best spectral resolution currently available is the prinicipal driving factor for using the HETGS in the present study. There are many more HETGS observations than LETGS observations and the RGS bandpass does not extend to the Fe K region of AGN spectra. We note that in a uniform analysis, individual source pecularities (e.g. in the continuum modelling) may be missed. An additional complication is that the absorbers in some AGN are known to vary, so drawing general conclusions based on a snapshot of a variable absorber may not be warranted in some cases. Nevertheless, a uniform analysis is useful since variations between analysis software and/or methodologies can account for considerable differences in interpretation, often over the same data.
2 The Sample and Data Analysis
Our study is based on the sample of fifteen type I AGN selected by Yaqoob & Padmanabhan (2004). The AGN are listed in Table 1 were originally assembled for a study of the Fe K band emission and had , a total, first–order, high energy grating count–rate of ct/s and the observations were in the Chandra public data archive 111http://cda.harvard.edu/chaser/mainEntry.do as of July 1, 2003. This constitutes a rather heterogeneous sample that is not based on a scientifically motivated selection criterion. Therefore, certain results and conclusions pertaining to sample properties (such as the fraction of AGN exhibiting signatures of photoionized outflows) must be interpreted with the appropriate caution. However, members of the sample do satisfy one very important criterion relevant for this study, namely that these sources are some of the brightest members of their class and therefore lend themselves to performing detailed X-ray spectroscopy with the Chandra HETGS. This is not a coincidence because generally speaking, the highest signal-to-noise members of a class tend to get accepted first by selection panels for observations in the early years of a new mission.
We note that several of the AGN listed in Table 1 have been observed with Chandra again (for which that data became public after July 1, 2003). Furthermore, an additional thirteen AGN have been observed with the Chandra gratings that would fulfill the selection criteria of Yaqoob & Padmanabhan (2004). In the future we intend to extend our sample study to include these AGN & more recent observations of the AGN in our sample. Also listed in Table 1 are the AGN redshifts (from NED222http://nedwww.ipac.caltech.edu using 21cm H i radiation measurements where possible), the RA and DEC (also from NED), the Galactic column density (Elvis et al., 1989; Murphy et al., 1996) and the total exposure times of the spectra.
The Chandra data were reprocessed using ciao 2.1.3 and CALDB version 2.7, according to recipes described in ciao 2.1.3 threads333http://cxc.harvard.edu/ciao/threads. The instrument in the focal plane of Chandra during the observations was the HETGS, which consists of two grating assemblies, a high–energy grating (HEG) and a medium–energy grating (MEG). Only the summed, negative and positive, first–order Chandra grating spectra were used in our analysis. The HEG bandpass is 0.8–10 keV and the MEG bandpass is 0.5–10 keV but the effective area of both instruments falls off rapidly at either end of the bandpass. Since the MEG soft X-ray response is much better than the HEG we used the MEG as the primary instrument.
We made effective area files (ARFs or ancillary response files), photon spectra and counts spectra following the method of Yaqoob et al. (2003). We did not subtract detector or X-ray background since it is such a small fraction of the observed counts. For spectra with zero or few counts per bin anywhere in the bandpass, attempting to subtract background whilst retaining the best spectral resolution possible can result in worse systematic errors compared to the case when no background subtraction is attempted. This is especially true when the background itself is weak, having zero counts for most spectral bins. However, background could be a source of contamination at the lowest energies of the MEG spectra (where the effective area is smallest), for weak and/or heavily absorbed sources. We examined spectra taken from two strips, either side of the on-source data, to check the level of background for each data set. We found that contamination could be a problem in NGC 3516, NGC 3227 and NGC 7314, where the background level becomes comparable to the source intensity below keV. We will bear this in mind when interpreting the data. We note that five of the fifteen AGN in our sample were observed with the Chandra low energy transmission grating spectrometer (LETGS ). The high resolution camera (HRC) was used in four of these five LETGS observations (as opposed to ACIS). However, order separation is not possible with the HRC and the properties of the LETGS are considerably different to those of the HETGS (e.g. LETGS has a lower spectral resolution of only 0.05Å FWHM ) and so inclusion of the LETGS data would have complicated efforts to perform a uniform analysis and comparison amongst the sources. Note that the observations of three of the AGN (NGC 3516, NGC 3783 and MCG 6-30-15) were not made in a single observing period. NGC 3516 was observed in three parts, as detailed in Table 1. However, two of the observations found NGC 3516 in a low flux state. So, in our analysis of the warm absorber in this AGN, we summed two of the observations into a single ‘low state’ spectrum and compared this with the ‘high state’ spectrum in the third observation. NGC 3783 was observed in five snapshots over a period of days. However, we analyze only the summed data in the present paper, since the spectral variability, which has been studied in detail by Netzer et al. (2003) is not great. The observation of MCG 6-30-15 has a single sequence number and observation ID, but was made in three parts, spanning a period of days. The S/N in the individual parts was not sufficient to warrant analyzing the three parts separately so here we analyze only the summed data.
For comparison with some of the results from the Chandra observations, we studied XMM-Newton spectra from some of the AGN in our sample. We used observations made with the XMM-Newton EPIC PN instrument. The data used were obtained from the reduced data products from the Xassist database 444http://xassist.pha.jhu.edu. AGN in our HETGS sample with corresponding XMM-Newton observations are listed in Table 1.
We treated the statistical errors on both the photon and counts spectra with particular care since the lowest and highest energies of interest can be in the Poisson regime, with spectral bins often containing a few, or even zero counts. When plotting data, we assign statistical upper and lower errors of and respectively (Gehrels, 1986) on the number of photons, , in a given spectral bin. When fitting the Chandra data, we used the –statistic (Cash, 1976) for finding the best-fitting model parameters, and quote 90 confidence, one-parameter statistical errors unless otherwise stated. The –statistic minimization algorithm is inherently Poissonian and so makes no use of the errors on the counts in the spectral bins described above. All model parameters will be referred to the source frame, unless otherwise noted. Note that since all models were fitted by first folding through the instrument response before comparing to the data, the derived model parameters do not need to be corrected for instrumental response.
We used XSPEC v.11.3.1 for spectral fitting to the HETGS spectra. All spectral fitting was done in the 0.5–5 keV energy band, excluding the 2.0–2.5 keV region, which suffers from systematics as large as in the effective area due to limitations in the calibration of the X-ray telescope 555http://cxc.harvard.edu/cal/cal_present_status.html. We performed spectral fits using data binned at Å(which is close to the MEG FWHM spectral resolution of Å), unless otherwise stated. There has been a continuous degradation of the quantum efficiency of Chandra ACIS with time, due to molecular contamination 666http://cxc.harvard.edu/cal/Acis/Cal_prods/qeDeg/index.html. In analyses of individual sources (Yaqoob et al., 2003; McKernan et al., 2003a, b) we found that a pure ACIS correction (the worst–case effect) affects only the inferred intrinsic continuum (at less than keV) and does not affect the important physical parameters of warm absorber models. A detailed comparison of spectral results with and without the ACIS degradation correction was given in (McKernan et al., 2003a) for the case of NGC 4593. We also note that the data in our sample are from early in the Chandra mission when the ACIS degradation was not so severe and the effects of the degradation are mitigated by the limited signal-to-noise ratio of the data at the lowest energies.
3 The overall soft X–ray spectra
The soft X-ray continuua of Type I AGN can be quite complex. An excess over a simple power–law continuum model, as well as possible absorption features, are common. In our sample, nine of the fifteen AGN in Table 1 show features characteristic of a soft excess and/or absorption edges. NGC 3227, NGC 3516, IC 4329A and NGC 7314 are heavily absorbed in the soft X–ray band. F9, 3C 120 and Mkn 279 have relatively simple continuua, since their spectra show little or no evidence for a soft excess. Since the soft excess typically appears only in the 0.5–0.7 keV band of our data, we do not have enough information to constrain its origin and so sophisticated modelling of the continuum (such as with a power-law plus a blackbody model component) is not warranted. We found that a broken power-law (although likely to be non-physical) is adequate to describe the intrinsic continuum including any soft excess in the HETGS energy band. When partially covering cold absorption is added to the model a useful empirical description of the overall spectra is obtained, leaving residuals mostly due to complex, ionized absorption, and in some cases some emission lines. Table 2 shows the best-fitting parameters obtained with this model for each source, as well as observed 0.5–2 keV fluxes.
4 Photoionization modeling of the AGN warm absorbers
We used the publicly available photoionization code XSTAR 2.1.kn3 777http:heasarc.gsfc.nasa.gov/docs/software/xstar/xstar.html to generate several grids of models of emission and absorption from photoionized gas in order to directly compare with the data. Version 2.1.kn3 includes unresolved transition arrays (UTAs) of inner-shell transitions of Fe for the first time in XSTAR. It is important to include UTAs in our photoionized model grids since they provide the key to studying low ionization state absorbers in AGN and UTAs of moderately ionized Fe0-15+ have been observed in the spectra of several type I AGN (see e.g. (Sako et al., 2001; Pounds et al., 2003; Behar et al., 2001; Blustin et al., 2002)).We used the default solar abundances in XSTAR (e.g. see Table 2 in Yaqoob et al. (2003)). Note that the XSTAR line database has been constructed from lines with published wavelengths, such as the Chianti line compilation 888http://wwwsolar.nrl.navy.mil/chianti.html. This almost completely excludes the lines listed in Behar & Neztzer (2002) for example, which are based on HULLAC calculations and which are only reliable at about the 1 level. These lines, due to L-shell transitions in Ne, Mg, Al, Si, S, Ar, Ca and Fe, are present in many Chandra grating spectra (see e.g. Netzer et al. (2003)), but so far they have mostly been omitted from the XSTAR database rather than compromise the accuracy of the database Kallman (2003).
There may be additional absorption in most of these AGN, beyond the simple photoionized warm absorber models that we consider in this uniform analysis. Candidates for the extra absorption include neutral dust (e.g. possibly in the form of FeO2 in MCG–6–30–15, see Lee et al. (2001)) or deeper O vii or O viii edges due to Oxygen overabundance. Alternatively, a more complex model of the continuum may be more appropriate, incorporating relativistically broadened emission lines in the soft X-ray band (see e.g. (Branduardi-Raymont et al., 2001; Mason et al., 2003; Sako et al., 2003)). However, investigation of these issues is beyond the scope of the present uniform analysis and we shall return to these important points in future work.
The best spectral resolution of the MEG cannot directly constrain turbulent velocities with a “b-value” of less than km . Furthermore, the XSTAR model spectra are calculated by XSTAR on a grid that does not always preserve accuracy in the line widths and line equivalent widths (Kallman, private communication). Therefore, direct fits to the data using the XSTAR spectra are approximate in the regions containing absorption lines. However, the ionic column densities output by the XSTAR are more accurate than the XSTAR spectra and can be used for more detailed modeling of individual absorption lines. This level of detail is beyond the scope of the present uniform analysis. We used a velocity turbulence (-value) of km , which corresponds approximately to the limiting MEG spectral resolution ( km FWHM at 0.5 keV), given that the data cannot directly constrain smaller line widths. It is possible to constrain using a curve-of-growth analysis if one has several absorption line measurements, and this has been done for some of the sources in our sample in more detailed studies. For example, in Mkn 509 is consistent with km (Yaqoob et al. (2003)), with similar results obtained for other sources. Since is generally comparable to or less than the spectral resolution, our adopted value of is justified for the purpose of spectral fitting.

4.1 XSTAR modelling procedure
First, we constructed a spectral energy distribution (SED) for each AGN in our sample, according to the method described in Yaqoob et al. (2003). In principle, derivation of the SED should be an iterative process since the intrinsic X-ray spectrum is obtained from fitting the data using an SED that must already contain information about the X-ray spectrum. In practice, the method employed (described in Yaqoob et al. (2003)) is a two-step process in which the first step is an initial estimate of the intrinsic X-ray spectrum is obtained by fitting the X-ray data with a power-law or broken power-law only and no photoionized absorber. The resulting estimated SED is used to generate grids of photoionization models that are used to obtain better fits to the data and to derive a new intrinsic X-ray spectrum. This is then used to generate another SED which is in turn used to generate a new set of photoionzation model grids and the latter are the ones used for the final model fits. Average radio, infrared (IR), optical and ultraviolet (UV) fluxes were obtained from Ward et al. (1987) and NED. Note that flux measurements, at different wavelengths, obtained from historical data (Ward et al. (1987), NED) are not in general contemporaneous. For each source, the 0.5 keV intrinsic model flux from the intrinsic X-ray continuum model was then simply joined onto the last point of the UV part of the SED by a straight line in log-log space. The hard X-ray power law was extended out to 500 keV. Generally, the high-energy cut-off in the observed X-ray spectra of Seyfert galaxies lies in the range 100-500 keV; only blazars and BL Lacs are observed to have significant flux beyond 500 keV. The ionization balance is is not sensitive to the exact position of the cut-off between 100-500 keV. At the low-energy end, it has been shown (for example, by Ferland et al. (2002)) that if the observed IR continuum carries a significant thermal component from reprocessing of the instrinsic continuum, using the observed SED as an input to photoionization models can potentially affect the resulting ionization balance of the plasma. However, our model fits are driven by X-ray features and we showed in a detailed study of NGC 4593 (McKernan et al. (2003a)) that removing the prominent IR-optical continuum bump from the SED yielded warm absorber parameters that were within the 90% confidence intervals obtained when the bump was not removed. Figure 1 shows the SEDs that we used for the ten AGN in our sample that exhibited warm absorption (see §4.2 below).
The photoionization model grids used here are two-dimensional, corresponding to a range in values of total neutral Hydrogen column density, , and the ionization parameter, . Here is the ionizing luminosity in the range 1–1000 Rydbergs, is the electron density and is the distance of the illuminated gas from the ionizing source. The ionizing luminosities were calculated from the SEDs by normalizing the absorption-corrected 0.5–2 keV fluxes. The grids were computed for equi-spaced intervals in the logarithms of and , in the ranges to and to erg cm respectively. We computed grids with in the range . For XSTAR models of the absorber, we confirmed that results from fitting the photoionization models to the X-ray data were indistinguishable for densities in the range to for all of the AGN. Hereafter we will use unless otherwise stated.
Our aim was to fit the MEG spectra with a simple power-law or a broken power law continuum (whichever was the better fit), modified by absorption from photoionized gas (derived from the AGN SED), neutral gas intrinsic to the AGN and Galactic absorption. All model fitting to the data was carried out using XSPEC v11.3.1. In order to fit XSTAR photoionization model grids to the data, we required an offset velocity for the warm absorber for each of the AGN. Therefore, first we tested for the following He-like and H-like absorption lines in each spectrum within km of the line rest–energy in the AGN frame: N vii Ly ( Å), O vii (r) ( Å), O viii Ly ( Å), Ne ix (r) ( Å), Ne x Ly ( Å), Mg xi (r) ( Å), Mg xii Ly ( Å), Si xiii (r) ( Å), Si xiv Ly ( Å). Note that for individual absorption features, the statistical errors on the line energies are typically very small and so the systematic uncertainty likely dominates these errors. The relative wavelength accuracy of the MEG is Å and the absolute wavelength accuracy of the MEG is Å999http://asc.harvard.edu/proposer/POG/html/HETG.html.
Next, we established an offset velocity for a particular AGN by finding the weighted–mean offset velocity (and the 90 confidence limits) of the centroids of all the absorption lines detected at significance in the spectrum. Some AGN exhibited groups of two or more absorption features separated from another such group by more than the 90 errors on their respective centroid velocities. In these cases, we established more than one weighted–mean offset velocity. Finally, we fitted XSTAR models only to those AGN where two or more prominent absorption signatures had similar offset velocities (within 90 confidence limits). This approach has the merit of being uniform, but it runs the risk of being too conservative and we may be biasing our study in favour of more prominent warm absorption signatures. On the other hand, our method does have the merit of ignoring statistically spurious features. We tested for the presence of multiple ionization components in the absorbers by investigating the statistical significance of additional model components within the 90 confidence limits of the weighted-mean offset velocity.
| Source | cold | CF | Flux (0.5-2.0keV) | |||
|---|---|---|---|---|---|---|
| () | (keV) | ( erg ) | ||||
| F9 | 11.9 | |||||
| 3C 120 | 16.8 | |||||
| NGC 3227 | 1.6 | |||||
| NGC 3516 (low) | 2.0 | |||||
| NGC 3516 (high) | 3.7 | |||||
| NGC 3783 | 11.8 | |||||
| NGC 4051 | 12.6 | |||||
| Mkn 766 | 15.0 | |||||
| NGC 4593 | 20.9 | |||||
| MCG-6-30-15 | 9.7 | |||||
| IC 4329A | 77.9 | |||||
| Mkn 279 | 5.6 | |||||
| NGC 5548 | 10.0 | |||||
| Mkn 509 | 23.1 | |||||
| NGC 7314 | 4.9 | |||||
| Akn 564 | 44.9 |
4.2 XSTAR model results
Table 3 lists the best–fit warm absorber models that we established for our AGN spectra. Figures 2,3 and 4 show the best–fit models overlaid on the HETGS spectra. We note that in Table 3 the derived column densities of each warm absorber component do not depend on the “b-value” assumed in the XSTAR models because the absorption lines are unresolved. Also, these column densities are not soley driven by the absorption lines. In particular, in the case of NGC 3783, altough our simplistic model gives a poor fit in some regions of the spectrum, missing some absorption lines altogether, the column densities of the four warm absorber components are not sensitive to this since the four numbers are determined by a fit to tens of absorption lines as well as to the overall spectral shape.
Only ten of the fifteen AGN in our sample satisfied our criteria for selection and spectral fitting with XSTAR grids. The AGN F9, 3C 120, Mkn 279, NGC 3227 and NGC 7314 are not included in Table 3. In the case of F9, we found weak O viii Ly and O vii (r) absorption signatures ( confidence). 3C 120 exhibited strong O viii Ly absorption but no other absorption signatures at confidence. In Mkn 279, Ne x Ly was the only absorption feature present at confidence. In NGC 3227 and NGC 7314, the soft X–ray band was very strongly absorbed, so we could not distinguish between a cold absorber and a mildly warm absorber. In NGC 3227 we only detected a single statistically significant absorption feature (Si xiv Ly at km relative to systemtic velocity). Note that previous, higher S/N data of the heavily absorbed AGN in our sample (NGC 3227 & NGC 7314) have in some cases detected evidence for photoionized absorption (see e.g.Reynolds (1997); Ptak et al. (1994); George et al. (1998)). Spectral plots of the data for the five AGN that are not shown in Figure 3 can be found in the HETG public database, HotGAS101010http://hotgas.pha.jhu.edu.
| Source | C-stat | C | |||||
|---|---|---|---|---|---|---|---|
| () | () | ergs cm | km | /yr | |||
| NGC 3516 (low) | 1.1 | 1363 | 60 | ||||
| high flux | 2.2 | 1414 | 131 | ||||
| 210 | 18 | ||||||
| NGC 3783 | 2.3 | 9091 | 689 | ||||
| 14 | 5070 | ||||||
| 720 | 1039 | ||||||
| 3.5 | 696 | ||||||
| NGC 4051 | 2.5 | 1296 | 29 | ||||
| 0.1 | 76 | ||||||
| 41 | |||||||
| Mkn 766 | 310 | 1289 | 8 | ||||
| 6 | |||||||
| 0.4 | 41 | ||||||
| NGC 4593 | 0.3 | 1393 | 25 | ||||
| 43 | |||||||
| MCG-6-30-15 | 9.1 | 1673 | 226 | ||||
| 240 | |||||||
| 0.2 | 62 | ||||||
| IC 4329a | 750 | 1448 | 162 | ||||
| 7.8 | 175 | ||||||
| NGC 5548 | 89 | 1065 | 126 | ||||
| 3.3 | 105 | ||||||
| Mkn 509 | 14 | 1137 | 36 | ||||
| 1100 | 27 | ||||||
| Akn 564 | 930 | 1354 | 18 | ||||
| 5.4 | 131 |
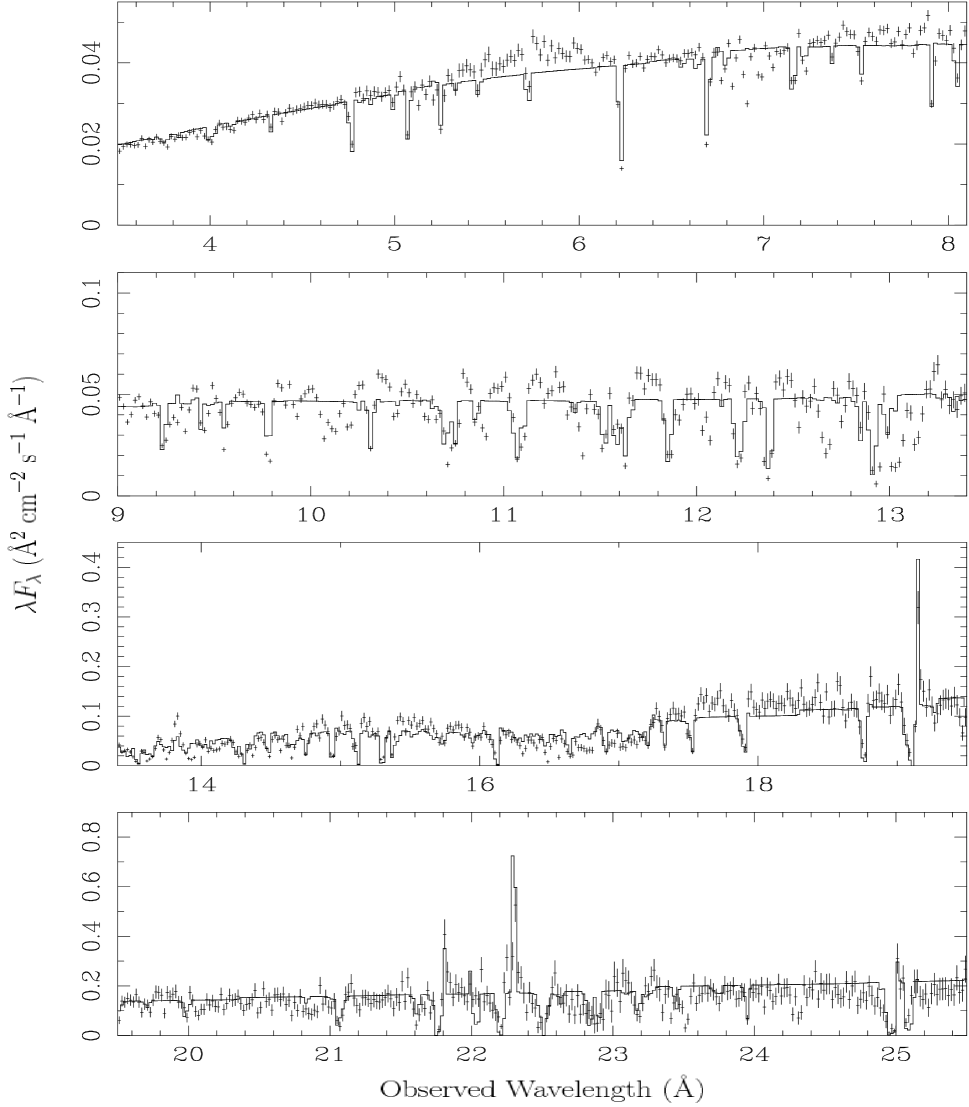
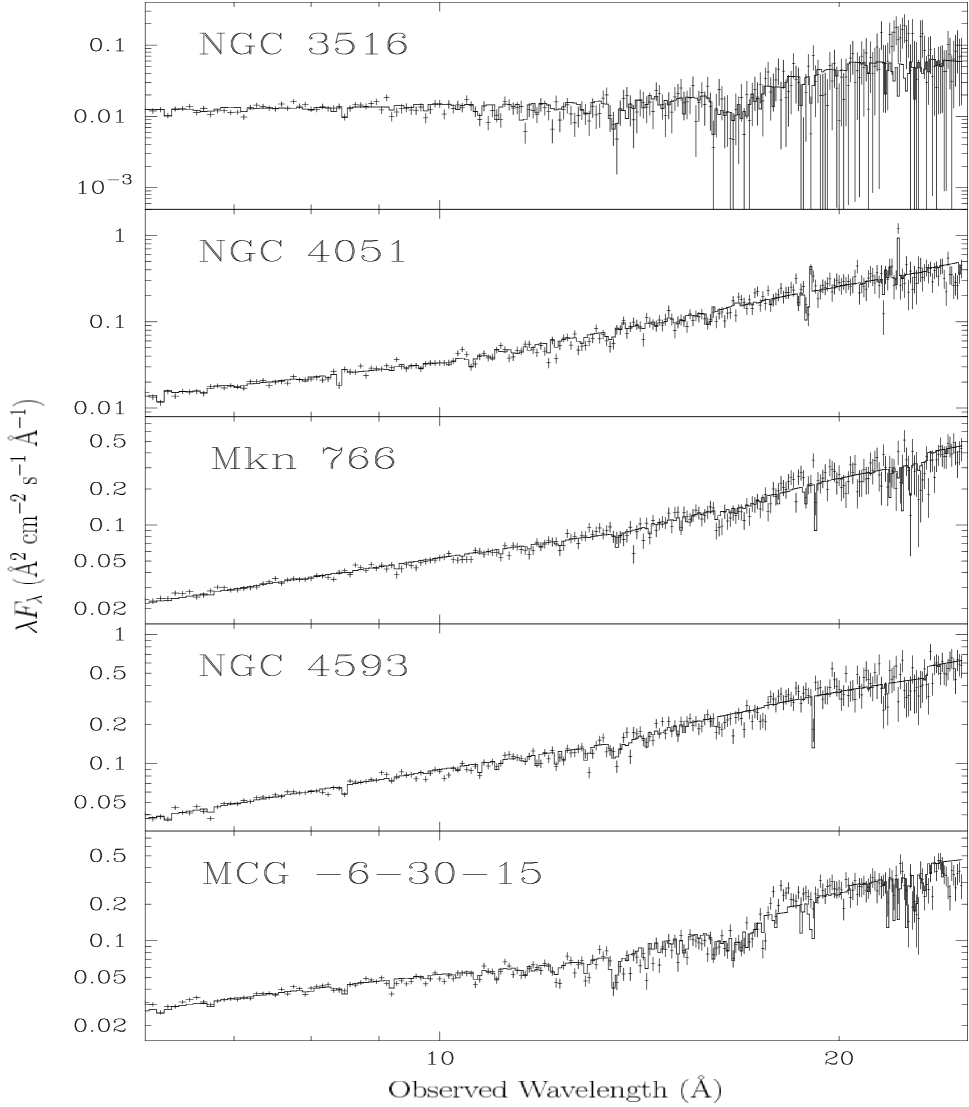
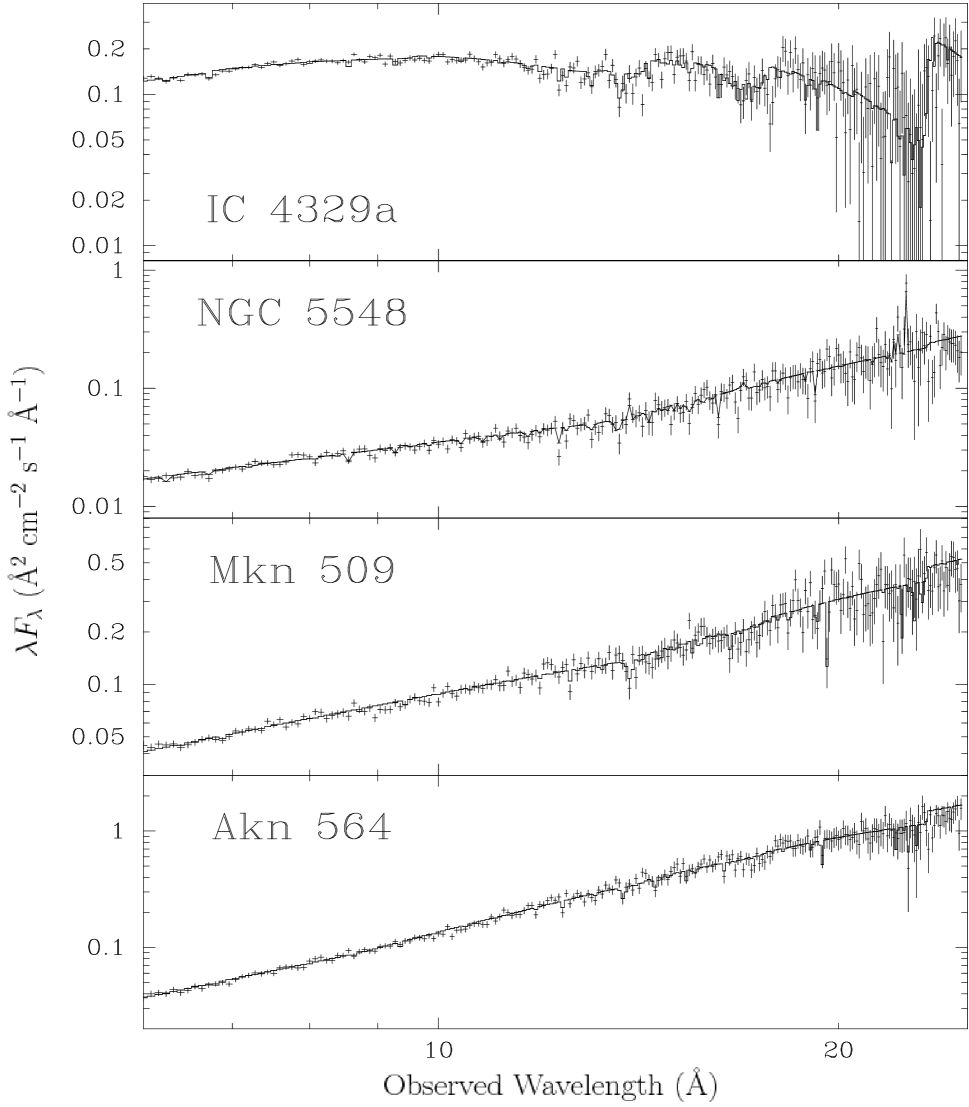
Table 4 shows results from the literature for model fits to X-ray spectra from the AGN in our sample. In general, given the limitations of our methodology, the agreement is actually quite good. Our uniform analysis ignores individual continuum peculiarities in individual AGN and our selection criteria for absorbers are more conservative than many in the literature. In spite of this, our method seems to pick up the same significant absorber components in the literature. Perhaps the best example of this can be seen by comparing our results from NGC 3783 in Table 3 with those from a detailed analysis by Netzer et al. (2003) of the best S/N X-ray spectrum yet. Table 4 shows that Netzer et al. (2003) find two velocity components of the warm absorber with three ionization states. Our simple, uniform method picks out the same velocity components at , and reveals the three ionization states, although we do not establish high velocity components for the middle and low ionization states. The total column density of the absorbers agrees very well with the value of found by Netzer et al. (2003). Our simple, uniform analysis means that our continuum fit is not as good as that found by Netzer et al. (2003), but it is encouraging that we reproduce most of their model parameters, given that their analysis of this spectrum was far more detailed than ours.
Of course, there are AGN for which individual source peculiarities mean that our results agree less well with those in the literature. In the case of MCG 63015 , Lee et al. (2001) and Sako et al. (2003) come to very different conclusions concerning both the origin of the continuum in this AGN and the parameters associated with the warm absorber.
| Source | Instrument | velocity | Reference | ||
| () | (erg cm ) | km | |||
| NGC 3516 | XR | Turner et al. (2003) | |||
| CL | Netzer et al. (2002) | ||||
| XE,CL,BX | Turner et al. (2005) | ||||
| NGC 3783 | CH | [-400,-600],[-1000,-1300] | Netzer et al. (2003) | ||
| [-400,-600],[-1000,-1300] | |||||
| [-400,-600],[-1000,-1300] | |||||
| NGC 4051 | CH | Collinge et al. (2001) | |||
| XE | Pounds et al. (2004) | ||||
| XE | [0.03,1] | [0,2.8] | Ogle et al. (2004) | ||
| Mkn 766 | CH | Sako et al. (2003)a | |||
| NGC 4593 | CH,RX | McKernan et al. (2003a) | |||
| XR,CL | Steenbrugge et al. (2003b) | ||||
| MCG-6-30-15 | CH | Lee et al. (2001)b | |||
| XR | Sako et al. (2003)a | ||||
| IC 4329a | XR | Steenbrugge et al. (2005a)c | |||
| [-100,-300] | |||||
| [-200,0] | |||||
| [-140,+180] | |||||
| NGC 5548 | CL,CH | -530 | Steenbrugge et al. (2005b)d | ||
| -530 | |||||
| -530 | |||||
| Mkn 509 | CH | Yaqoob et al. (2003) | |||
| Akn 564 | CH | Matsumoto et al. (2004) | |||
Unresolved transition arrays (UTAs) of Fe are a key diagnostic of material in a low-ionization state, which could account for the bulk of the mass outflow from AGN (depending on the absorber density and geometry). The present generation of X-ray telescopes have the spectral resolution to detect blends of Fe inner-shell absorption transitions in the ionized outflows from AGN for the first time. Unresolved arrays of inner–shell (2p-3d) transitions in moderately ionized Fe0-15+ have been observed in the spectra of several type I AGN (see e.g. Behar et al. (2001) and references therein). Behar et al. (2001) calculate Fe UTAs for an ionization parameter in the range . The UTA appears as a jagged, broad trough between Å. As increases, the centroid of the UTA trough shifts towards shorter wavelengths, the dominant contributions come from more highly ionized states of Fe and the Fe UTA broadens.
Of the ten AGN in our sample that exhibit signatures of absorption due to photoionized material, only two AGN (NGC 4593 and NGC 5548) did not exhibit statistically significant evidence for a low ionization (Fe UTA) absorber component. Note that in the case of NGC 3516, we only found a low ionization component at statistical significance in the high flux state of this AGN. Figure 5 shows the best-fit model of the UTA in each of the seven AGN with a warm absorber component where (see Table 3). The wavelength scale in Figure 5 corresponds to the outflowing warm absorber rest-frame in each case.
| Source | ||||
|---|---|---|---|---|
| () | (ergs cm/) | () | (km /) | |
| NGC 3783 | ||||
| NGC 4051 | ||||
| NGC 5548 |

4.3 Soft X–ray emission in AGN
As can be seen from Figs 2, 3 and 4, narrow emission lines were apparent in several of the AGN in our sample. The spectra of NGC 3783, NGC 4051 and NGC 5548 displayed the most prominent narrow lines. Narrow emission lines were less prominent in the spectra of Mkn 279, NGC 4593, Mkn 509 and MCG–6–30–15. The spectra of NGC 3227, NGC 3516 and NGC 7314 showed broad emission features around keV. However the broad emission features in the soft X–ray spectra of these three heavily absorbed AGN were present in the respective background spectra and are therefore not intrinsic to the AGN. We tested for O vii and Ne ix triplet line emission and O viii Ly and Ne x Ly narrow lines in the spectra of the ten AGN listed above. We followed the fit procedure in §4.1 except that the Gaussian model component was not inverted. In a given AGN, we established the weighted–mean offset velocity of the centroids of emission lines detected at significance in the spectrum. We then fitted XSTAR emission line model grids at the mean offset velocity to those AGN spectra displaying multiple () emission signatures at significance.
From the definition of , the emitting material lies at a distance pc from the radiation source, where is the 1–1000 Ryd ionizing radiation from the AGN (in units of erg ), ergs ) and is the electron density. For a volume filling factor of unity, the emitting material has a thickness where and is the density of Hydrogen nuclei (assuming He/H and He contributes two electrons). Therefore, if we assume that , then where . The best–fit values of and from the XSTAR emission model fits then allow us to establish a lower limit on the electron density in the emitting material. It is important to note however, that the emitting material is not necessarily the same as the absorbing material and therefore may not have the same physical parameters or location as the outflow responsible for absorption.
The three AGN spectra with the most prominent narrow emission lines were NGC 4051, NGC 5548 and NGC 3783. In the spectrum of NGC 4051, the [O vii] and [Ne ix] forbidden lines were the most prominent, with additional emission due to O viii Ly and Ne x Ly and weak O vii (i) emission. There was no apparent O vii (r) emission, indicating that the emitting material in this source is photoionized rather than collisionally ionized. Of course it is also possible that O vii (r) emission may have been re-absorbed by O vii (r) line absorption, which depends on the relative velocity shifts of the emitting and absorbing gases as well as the blending effects of the instrument resolution and the spectral binning. The forbidden lines were marginally blueshifted from systemic velocity and the other (less prominent) emission lines were consistent with emission at systemic velocity. The weighted mean velocity offset of the emission lines in this source ( km ) was apparently blueshifted.
NGC 5548 also exhibited strong [O vii] and [Ne ix] forbidden emission lines, with relatively strong O viii Ly and O vii (i) emission. O vii (r) line emission was weak in this source, indicating that the emitter is predominantly photoionized rather than collisionally ionized. The He-like Ne and O triplet emission lines in NGC 5448 were marginally blueshifted ([O vii] lay at an offset velocity of km ), but the O viii Ly emission was marginally redshifted. The weighted mean offset velocity of the emitting material ( km ) was consistent with emission at systemic velocity. NGC 3783 exhibited very strong O viii Ly , [Ne ix] and O vii (r) emission, the latter indicating that collisional ionization may be important in the emitting material Porquet et al. (2001), although photoexcitation due to high levels of UV flux could also account for O vii (r) emission Kinkhabwala et al. (2002). Also present were emission features due to [O vii] and O vii (i) . The He-like forbidden emission lines in NGC 3783 were marginally blueshifted, but the other emission lines were marginally redshifted. The weighted mean offset velocity of the emitting material was consistent with emission at systemic velocity.
The spectra of Mkn 279, NGC4593, Mkn 509 and Mkn 766 each exhibited several emission features, most prominently O viii Ly and/or [O vii] , but they did not exhibit emission features at significance. Of the ten AGN, we therefore only fit the spectra of NGC 3783, NGC 4051 and NGC 5548 with XSTAR models of emission. The best–fit results are given in Table 5. The requirement that yields lower limits of for NGC 4051, NGC 5548 and NGC 3783 respectively.
5 Properties of the Warm Absorbers in Type I AGN
The results of the photoionization modelling of the AGN spectra are summarized in Table 3. Figures 2, 3 and 4 show the best–fit photoionization models (from Table 3) superimposed on the AGN spectra. Our uniform analysis of the AGN sample has yielded warm absorber parameters (, log , velocity) that agree reasonably well with those in the literature (often from much more detailed analyses).
Our results provide the first overview of high resolution soft X–ray grating data from Chandra observations of type I AGN. In summary, we found that nine of the fifteen AGN in the sample have intrinsic continua that are more complex than a simple power law in the 0.5–5.0 keV band (modelled here as a broken power law). Of the remaining six AGN spectra, the continua of three (F9, 3C 120 and Mkn 279) are well described by simple power law models and the continua of the three remaining AGN (NGC 3227, NGC 3516 and NGC 7314) are well described by heavily absorbed power law models. Note that previous, higher S/N data of the heavily absorbed AGN (NGC 3227 & NGC 7314), evidence for photoionized absorption has in some cases been detected (see e.g. Ptak et al. (1994);George et al. (1998)). The nine AGN spectra with complex intrinsic continua exhibit signatures of an ionized absorber as does the spectrum of NGC 3516, in spite of being heavily absorbed. The absorbers appear to be photoionized and outflowing, with velocities in the range km (similar to the speed of the Solar wind). The column density of the warm absorbing gas is . Nine of the ten AGN exhibiting warm absorption are best–fit by multiple ionization components and three of the ten AGN require multiple kinematic components. The warm absorbing gas in our AGN sample has a wide range of ionization states, spanning roughly four orders of magnitude () and up to three orders of magnitude in the same source. Of the ten AGN spectra that exhibit warm absorption, a simple fit to the 0.5-0.7 keV and 2.5-5.0 keV energy regions reveals that the intrinsic continuum of two AGN (NGC 4051 and NCG 5548) exhibits a statistically significant upturn in the intrinsic soft X–ray continuum relative to a hard X–ray power law. Our simple test shows that MCG 63015 does not require a soft excess. The remaining AGN that exhibit warm absorption are either heavily absorbed in soft X-rays or exhibit spectral complexity that cannot be accounted for by such a naive test of the data. Nine of the ten AGN that exhibit warm absorption also exhibit Fe UTAs, indicative of an absorber component that could (depending on absorber density and geometry) carry most of the mass in outflow, as we show below.

Fig. 6 compares the warm absorber component parameters from the different AGN (see Tables 3 & 5). Fig. 6(a) shows the relationship between warm absorber outflow velocity and the corresponding warm absorber column density. Clearly the warm absorber components in all ten AGN are outflowing and with velocities that span around two orders of magnitude. There appears to be a gap in the outflow velocities in our sample between km , the origin of which is not clear. The outflow components with velocities below this gap tend to be associated with lower column densities than those with with velocities above the gap. Fig. 6(b) shows that the ionization parameter of the warm absorber is independent of velocity and can vary by up to three orders of magnitude in the same source, suggesting that the outflowing absorber components consist of gas lying at different points on the heating/cooling curve (e.g. Krolik & Kriss (2001)). Furthermore Fig. 6(b) also indicates that there is a separate population of low ionization state absorber components at . These low ionization parameter absorber components are responsible for the Fe UTAs in the AGN spectra. One caveat is that there is no bias in principle in the X-ray band for absorbers with ionization states , however Chandra HETGS is less sensitive than other instruments to this band.
The warm absorber outflow apparent in ten of the fifteen AGN in our sample must clearly carry mass away from the central SBH. The rate of mass loss from an AGN outflow is given by
| (1) |
where is the solid angle subtended by the absorber at the ionizing source, is the volume filling factor, is the mean atomic mass per Hydrogen atom ( for solar abundances), is the proton mass, is the electron density of the absorber, is the distance of the absorber from the radiation source, and is the outflow velocity. We believe that the filling factor, , cannot be reliably constrained by current observations of AGN (see e.g. discussion in §5.1). Blustin et al. (2005) estimated for a sample of sources based on various assumptions, but those same assumptions led Blustin et al. (2005) to derive a maximum distances between the absorber and radiation source that was less than the minimum distance for no less than five sources. On the other hand, it is possible to argue that the covering factor () is approximately equal to the fraction of type I AGN in which a warm absorber is detected, or . However, this argument breaks down if AGN winds are accelerating and/or “bend”, rather than constant velocity, non-accelerating outflows. Even so, this still leaves (and therefore the mass outflow rate) unconstrained. From the definition of the ionization parameter, , therefore
| (2) |
where , and where is the outflow velocity, and is the number of Hydrogen atoms per free electron. With and , the product is approximately unity, or . Equation 2 suggests that all else being equal, warm absorbing gas with a low value of ionization parameter should account for the largest mass outflows from AGN. From Table 3 we find mass outflow rates in the range . Therefore, even for small filling factors, the outflow rate can be comparable to the expected accretion rate onto the central supermassive black hole. The accretion rate onto the black hole can is , where is the bolometric luminosity of the AGN and is the accretion efficiency of the black hole. If , where is a parameter of order unity, and , then and
| (3) |
| Source | 0.5-2.0 keV | Reference | |||
|---|---|---|---|---|---|
| luminosity | |||||
| (erg/s) | (erg/s) | () | |||
| NGC 3516 (low) | 0.16 | 0.15 | 43 | 0.003 | 1 |
| NGC 3516 (high) | 0.38 | 0.36 | … | 0.007 | 1 |
| NGC 3783 | 1.25 | 1.00 | 30 | 0.003 | 1 |
| NGC 4051 | 0.02 | 0.02 | 2.0 | 0.006 | 1 |
| Mkn 766 | 0.66 | 0.47 | 0.6 | 0.572 | 2 |
| NGC 4593 | 0.50 | 0.29 | 5.4 | 0.042 | 1 |
| MCG-6-30-15 | 0.32 | 0.16 | 4.5 | 0.027 | 3 |
| IC 4329A | 0.76 | 3.40 | 7.5 | 0.349 | 1 |
| NGC 5548 | 6.98 | 8.33 | 96 | 0.067 | 1 |
| Mkn 509 | 6.55 | 5.23 | 100 | 0.040 | 1 |
| Akn 564 | 6.54 | 4.69 | 1.2 | 3.000 | 4 |
The value of and the covering factor of the absorber is critical to understanding the processes underpinning the warm absorption phenomenon. If and if typically, then the filling factor must be very small () for the mass outflow rate to be comparable to or less than the accretion rate (a point also made by Steenbrugge et al. (2005b)).
The warm absorber components found in Seyfert 1 galaxies have column densities that are too small to account for the EWs of the narrow, core, Fe K line emission. However, for our sample, we investigated whether the core Fe K line emission EW correlate with the column densities of the warm absorber components in case of a secondary effect. For example, if the warm absorber material is an outflow of material from the putative obscuring torus, and if the core Fe K line emission originates in the torus itself, one might expect a correlation between the Fe K line EW and the warm absorber column density if thicker torii produce thicker winds. We also investigated whether the Fe K line in Type I AGN ‘knows’ about the warm absorber by compared the total column density of the warm absorber in an AGN with the EW of the corresponding core Fe K line (Yaqoob & Padmanabhan, 2004) (Figure 7).
For our sample, Figure 7 shows the EW measurements (from Yaqoob & Padmanabhan 2004) versus warm absorber column density. A weak correlation is permitted based on Figure 7, so the Fe K line might ‘know’ about a large warm absorber column density. In this case we calculate the Pearson correlation coefficient to be (for N=9), which is significant at the confidence level. However, we caution that the EWs of individual Fe K lines can vary by a factor of 2-3 as the continuum varies whilst the line intensity does not, and this would destroy any hint of correlation in Figure 7, which may therefore be spurious. In particular, we note that no warm absorber is detected in F9, yet it has a prominent, strong Fe K line core (Yaqoob & Padmanabhan, 2004).

5.1 Comparison with other AGN sample studies
Blustin et al. (2005) collated from the literature the results of some of the X-ray spectral observations of 23 AGN using Chandra and XMM-Newton and attempt to infer the general properties of Seyfert warm absorbers from these results. The methodology of the Blustin et al. (2005) study is quite different from the present work, However, the strengths of our study (uniform analysis and a single instrument) may also be weaknesses. Our selection criteria for warm absorption signatures may be too conservative, our uniform modelling of the continuum may ignore individual source peculiarities and our band-pass may miss e.g. very low ionization absorber components. A study such as the one carried out by Blustin et al. (2005) is a useful comparison for these reasons. Blustin et al. (2005) conclude that most warm absorbers are most likely to originate in outflows from the dusty torus, since they estimate that the minimum distance of the warm absorbers from the central radiation source mostly cluster around the distance of the torus. Blustin et al. (2005) conclude that the kinetic luminosity of these outflows is of the AGN bolometric luminosity and the observed soft X-ray absorbing ionization phases fill of the available volume.
Some of the conclusions reached by Blustin et al. (2005) are quite different from ours. We make no claim for the filling factors of the outflows or indeed, their origin. First, we believe there are currently insufficient data and constraints to reliably estimate the filling factor, preventing the derivation of absolute mass outflow rates. Second, we note that Blustin et al. (2005) calculate a minimum distance between the central radiation source and the warm absorber based only on the assumption that the outflow velocity exceeds the escape velocity. However, very recently Miller et al. (2006) observed an X-ray absorbing outflow from the stellar-mass black hole binary GRO J1655-40 with a radial velocity far less than the escape velocity at its location. Moreover, the assumptions of Blustin et al. (2005) lead to a maximum distance of the warm absorber from the radiation source that is less than the minimum distance for no less than five AGN. Robust information on the distance between the warm absorber and the central source can only come from variability studies of the absorber. Third, Blustin et al. (2005) conclude that Seyfert warm absorbers are probably not telling us anything fundamental about the energetics or structure of the central engine. However, if for example, warm absorbers originate in a disk wind, the properties of the disk wind are likely to correlate with those of the disk (magnetic flux strength, disk temperature gradient, velocity of disk etc). Finally, some parts of the warm absorbing outflows from AGN discussed here and by Blustin et al. (2005) may not actually be observable because they are fully ionized. Such fully ionized outflows may be the fastest component of the outflow since it may be closest to the source of ionizing radiation.
6 Discussion
At present there are two distinct theories of the origin of the warm absorber. On the one hand, Elvis (2000) proposes a unified scheme for quasars that includes a wind that rises vertically from a narrow range of radii on the inner accretion disk and is then bent outwards by a radial radiation force to produce a funnel–shaped thin shell outflow. This model specifically excludes the dusty molecular torus as a characteristic of AGN and proposes that the Fe K emission line is produced in the funnel. Elvis (2000) predicts that the range of line widths will be similar to the broad absorption line ‘detatchment velocities’ ( km vertically, so one might expect a narrower line width than this when looking down the funnel). Of the forty-eight absorption features used to constrain the warm absorber components in this study, thirty-seven have FWHM 2000 km and only four allow for FHWM km . Statistically, a weak correlation is allowed between the EW of the FeK line and the total column density of the warm absorber. However, we note that in our sample, the source with the least evidence for any warm absorption (F9) exhibits the largest FeK EW, which is not consistent with expectations from the Elvis model.
On the other hand, Krolik & Kriss (2001) propose that the warm absorber originates in a photoionized evaporation from the inner edge of the putative obscuring torus believed to surround the AGN central engine. In this model, the warm absorber is a multi-temperature wind, with the different outflow components having values of (pressure form of ionization parameter) that cover a relatively narrow range, as a result of the different phases of gas co-existing in pressure equilibrium. From our photoionization model fits, we find that the temperatures of the warm absorber components lie in the range for the sample, yet lies in the range , with the highest ionization components generally having the largest values of and . Thus, our general constraints seem to agree quite well with the model predictions of Krolik & Kriss (2001). An additional attraction of this model is that the interaction of the disk wind with the dusty molecular torus in this model can also naturally explain dusty warm absorption, which may be the cause of additional spectral complexity of some of the AGN in this sample (see §3).
One important point to note is that some of the warm absorber components discussed above may actually be due in part to hot local gas at cz0. For example the low velocity warm absorber component in NGC 4051 at ( km ) is kinematically very close to an absorption signature at cz0 since NGC 4051 is cosmologically redshifted by km from z0. Other AGN in this sample yield tantalizing hints of absorption due to hot local gas (see McKernan et al. (2004, 2005) and references therein for further details). Of course, the absorption signatures of some of the warm absorbing outflows could be mimicked by hot gas at intermediate redshift. However, the expected column density of most filaments of warm/hot intergalactic medium (Cen & Ostriker, 1999) is far lower than that observed by us.
The soft X-ray spectra of type I AGN observed with the high resolution Chandra and XMM-Newton observatories prompt many intruiging questions. We believe that these questions can be answered only by the careful uniform analysis of a sample of AGN. Our uniform analysis has its limitations since we use spectra from only one instrument with a limited bandpass, and our methodology is sufficiently conservative that we may miss less signficant absorber signatures. Nevertheless, we have carried out a first uniform analysis on a small sample of AGN observed with Chandra HETGS and we have established reasonably well constrained parameter ranges for the warm absorbing outflows in type I AGN. Interestingly, we found that mass loss resulting from the warm absorber outflow can be high, comparable to or greater than the expected accretion rate onto the central supermassive black hole. Most of the outflowing mass could be carried by low ionization state outflows (depending on absorber density and geometry), which are best studied in the X-ray band via their Fe UTA spectral imprint. Low rates of mass outflow from AGN and higher velocity outflows may be associated with lower values of the AGN Eddington ratio, but the rate of mass outflow does not correlate with the mass of the central black hole. A weak contribution to the core of the narrow Fe K line from high column density warm absorbers seems unlikely. There is gap in the outflow velocities of the warm absorber components in the range km that is puzzling. All these results so far provide tantalizing hints at global patterns of type I AGN behaviour and merit further investigation using a larger sample of high spectral resolution AGN spectra.
Acknowledgments
BM gratefully acknowledge support from NSF grant AST0205990. TY acknowledges support from NASA through grant AR4-5009X issued by Chandra X–ray Observatory Center, operated by the SAO for and on behalf of NASA under contract NAS8-39073. We made use of the HEASARC on-line data archive services, supported by NASA/GSFC and also of the NASA/IPAC Extragalactic Database (NED), operated by the Jet Propulsion Laboratory, CalTech, under contract with NASA. Thanks to the Chandra instrument and operations teams for making the observations possible. Thanks to Tim Kallman for numerous useful discussions on XSTAR. Thanks to the anonymous referee for very detailed and useful comments that helped improve and shorten this paper. Thanks to Fabrizio Nicastro for discussing his results from an unpublished XMM-Newton RGS observation of NGC 4051.
References
- Arav et al. (2002) Arav, N., Korista, K. T. & de Kool, M. 2002, ApJ, 566, 699
- Behar et al. (2001) Behar, E., Sako, M., & Kahn, S. M. 2001, ApJ, 563, 497
- Behar & Neztzer (2002) Behar, E. & Netzer, H., 2002, ApJ, 570, 165
- Bian & Zhao (2003) Bian, W. & Zhao, Y. 2003, MNRAS, 343, 164
- Blustin et al. (2002) Blustin, A. J., Branduari-Raymont, G., Behar, E., Kaastra, J. S., Kahn, S. M., Page, M. J., Sako, M., Steenbrugge, K. C., 2002, A&AS, 392, 453
- Blustin et al. (2005) Blustin, A. J., Page, M. J., Fuerst, S. V., Branduardi-Raymont, G. & Ashton, C. E., 2005, A&AS, 431, 111
- Botte et al. (2005) Botte, V., Ciroi, S., diMille, F., Rafanelli, P. & Romano, A., 2005, MNRAS, 356, 789
- Branduardi-Raymont et al. (2001) Branduardi-Raymont, G., Sako, M., Kahn, S. M., Brinkman, A. C., Kaastra, J. S., & Page, M. J. 2001, A&AS, 365, 140
- Cash (1976) Cash, W., 1976, A&AS, 52, 307
- Cen & Ostriker (1999) Cen, R & Ostriker, J. P., 1999, ApJ, 514, 1
- Collinge et al. (2001) Collinge, M. J., Brandt, W. N., Kaspi, S., Crenshaw, D. M., Elvis, M., Kraemer, S. B., Reynolds, C. S., Sambruna, R. M., Wills, B. J. 2001, ApJ, 557, 2
- Crenshaw & Kraemer (1999) Crenshaw, D. M., & Kraemer, S. B., 1999, ApJ, 521, 572
- Elvis et al. (1989) Elvis, M., Wilkes, B. J., Lockman, F. J. 1989, AJ, 97, 777
- Elvis (2000) Elvis, M., 2000, ApJ, 545, 63
- Ferland et al. (2002) Ferland, G. J., Martin, P. G., van Hoof, P. A., & Weingarter, J. C. 2002, Workshop on X-ray Spectroscopy of AGN with Chandra and XMM-Newton, held at MPE Garching, December 3-6, 2001, Report 279, p. 103
- Gehrels (1986) Gehrels, N. 1986, ApJ, 303, 336
- George et al. (1998) George, I. M., Turner, T. J., Netzer, H., Nandra, K., Mushotzky, R. F., Yaqoob, T. 1998, ApJS, 114, 73
- Halpern (1984) Halpern, J. P., 1984, ApJ, 281, 90
- Kaastra et al. (2002) Kaastra, J. S., Steenbrugge, K. C., Raassen, A. J. J., van der Meer R. L. J., Brinkman, A. C., Liedahl, D. A., Behar, E., & de Rosa, A. 2002, A&AS, 386, 427
- Kallman (2003) Kallman, T. 2003, private communication
- Kinkhabwala et al. (2002) Kinkhabwala, A. et al. 2002, ApJ, 575, 732
- Krolik & Kriss (2001) Krolik, J. H., & Kriss, G. A. 2001, ApJ, 561, 684
- Lee et al. (2001) Lee, J. C., Ogle, P. M., Canizares, C. R., Marshall, H. L., Schulz, N. S., Morales, R., Fabian, A. C., & Iwasawa, K. 2001, ApJ, 554, L13
- Markert et al. (1995) Markert, T. H., Canizares, C. R., Dewey, D., McGuirk, M., Pak, C., & Shattenburg, M. L. 1995, Proc. SPIE, 2280, 168
- Mason et al. (2003) Mason, K. O. et al. 2003, ApJ, 582, 95
- Matsumoto et al. (2004) Matsumoto, C., Leighley, K. M. & Marshall, H. L. 2004, ApJ, 603, 456
- McHardy et al. (2005) McHardy, I. M., Gunn, K. F., Uttley, P., Goad, M. R., 2005, MNRAS, 359, 1469
- McKernan et al. (2003a) McKernan, B., Yaqoob, T., George, I.M., Turner, T. J. 2003a, ApJ, 593, 142
- McKernan et al. (2003b) McKernan, B., Yaqoob, T., Mushotzky, R., George, I.M., Turner, T. J. 2003b, ApJ, 598, L83
- McKernan et al. (2004) McKernan, B., Yaqoob, T., Reynolds, C. S. 2004, ApJ, 617, 232
- McKernan et al. (2005) McKernan, B., Yaqoob, T., Reynolds, C. S. 2005, MNRAS, 361, 1337
- Miller et al. (2006) Miller, J. M. et al. 2006, Nature (accepted), astro-ph/0605390
- Morales & Fabian (2002) Morales, R. M. & Fabian, A. C., 2002, MNRAS, 329, 209
- Murphy et al. (1996) Murphy, E. M., Lockman, F. J., Laor, A., Elvis, M. 1996, ApJS, 105, 369
- Nandra & Pounds (1992) Nandra, K. & Pounds, K. A. 1992, Nature, 359, 215
- Netzer et al. (2002) Netzer, H., Chelouche, D., George, I. M., Turner, T. J., Crenshaw, D. M., Kraemer, S. B. & Nandra K. 2002, ApJ, 571, 256
- Netzer et al. (2003) Netzer, H., et al. 2003, ApJ, 599, 933
- Ogle et al. (2004) Ogle, P. M. et al. 2004, ApJ, 606, 151
- Peterson et al. (2004) Peterson, B. M. et al. 2004, ApJ, 613, 682
- Porquet et al. (2001) Porquet, D., Mewe, R., Dubau, J., Raassen, A. J. J. & Kaastra, J. S. 2001, A&AS, 376, 1113
- Pounds et al. (2003) Pounds, K. A., Reeves, J. N., Page, K. L., Edelson, R., Matt, G. & Perola, G. C. 2003, MNRAS, 341, 953
- Pounds et al. (2004) Pounds, K. A., King, A. R., Reeves, J. N., Page, K. L. 2004, MNRAS, 350, 10
- Ptak et al. (1994) Ptak, A. F., Yaqoob, T., Serlemitsos, P. J., Mushotzky, R., Otani, C. 1994, ApJ, 436, L31
- Reynolds (1997) Reynolds, C. S. 1997, MNRAS, 286, 513
- Reynolds & Nowak (2003) Reynolds, C. S. & Nowak, M. A., 2003, Phys. Rep., 377, 389
- Sako et al. (2001) Sako, M., et al. 2001a, A&AS, 365, L168
- Sako et al. (2003) Sako, M., et al. 2003, ApJ, 596, 114
- Steenbrugge et al. (2003b) Steenbrugge, K. C., Kaastra, J. S., Blustin, A. J., Branduardi-Raymont, G., Sako, M., Behar, E., Kahn, S. M., Paerels, F. B. S., Walter, R. 2003b, A&AS, 408, 921
- Steenbrugge et al. (2005a) Steenbrugge, K. C., Kaastra, J. S., Sako, M., Branduardi-Raymont, G., Behar, E., Paerels, F. B. S., Blustin, A. J. and Kahn, S. 2005, A&A, 432, 453
- Steenbrugge et al. (2005b) Steenbrugge, K. C. et al. 2005, A&A, 434, 569
- Turner et al. (1993) Turner, T. J., Nandra, K., George, I. M., Fabian, A. C., Pounds, K. A. 1993, ApJ, 419, 127
- Turner et al. (2003) Turner, T. J., Kraemer, S. B., Mushotzky, R. F., George, I. M. & Gabel, J. R. 2003, ApJ, 594, 128
- Turner et al. (2005) Turner, T. J., Kraemer, S. B., George, I. M., Reeves, J. N., & Bottorff, M. C. 2005, ApJ, 618, 155
- Ward et al. (1987) Ward, M., Elvis, M., Fabbiano, N., Carleton, P., Willner, S. P., & Lawrence, A. 1987, ApJ, 315, 74
- Yaqoob et al. (2003) Yaqoob, T., McKernan, B., Kraemer, S. B., Crenshaw, D. M., Gabel, J. R., George, I. M. & Turner, T. J., 2003, ApJ, 582, 105
- Yaqoob & Padmanabhan (2004) Yaqoob, T. & Padmanabhan, U., 2004, ApJ, 604, 63