The luminous X-ray hotspot in 4C 74.26: synchrotron or inverse-Compton emission?
Abstract
We report the discovery of an X-ray counterpart to the southern
radio hotspot of the largest-known radio quasar 4C 74.26 (whose
redshift is ). Both XMM-Newton and Chandra images reveal the
same significant (, i.e. ) offset between the X-ray
hotspot and the radio hotspot imaged with MERLIN. The peak of the
X-ray emission may be due to synchrotron or inverse-Compton
emission. If synchrotron emission, the hotspot represents the site
of particle acceleration and the offset arises from either the jet
exhibiting Scheuer’s ‘dentist’s drill’ effect or a fast spine having
less momentum than the sheath surrounding it, which creates the
radio hotspot. If the emission arises from the inverse-Compton
process, it must be inverse-Compton scattering of the CMB in a
decelerating relativistic flow, implying that the jet is
relativistic () out to a distance of at least 800 kpc.
Our analysis, including optical data from the Liverpool Telescope,
rules out a background AGN for the X-ray emission and confirms its
nature as a hotspot making it the most-X-ray-luminous hotspot
detected at low redshift.
1 Introduction
4C 74.26, at redshift , has the morphology of a typical FR II radio source (Fanaroff & Riley, 1974), but is on the borderline between FR I and FR II in terms of its radio luminosity (Riley & Warner, 1990). It has a one-sided jet, which lies at an angle to the line-of-sight (Pearson et al., 1992) and may be indicative of beaming (, Riley & Warner 1990). The southern radio hotspot on the jet side is much brighter and more compact than the hotspot complex on the non-jet side, which is typical of such sources (e.g. Laing 1989; Bridle et al. 1994). Optical observations show its host to be a typical giant elliptical galaxy (Riley et al., 1989).
Our analysis of X-ray observations of 4C 74.26 show that the southern hotspot of 4C 74.26 is more X-ray luminous than the western hotspot of Pictor A (Wilson et al., 2001) and hotspot D in Cygnus A (Wilson et al., 2000) (see Table 4). It is at a far greater distance from the nucleus than either of these two sources making it one of the largest sources in the local Universe with a projected linear size of (assuming ) (Pearson et al., 1992). If the jet is inclined at 45 degrees to the plane of the sky, the maximum likely angle implied by unification models of quasars and radio galaxies (e.g. Barthel 1989; Antonucci 1993), then the south hotspot is from the nucleus. A smaller angle than this canonical maximum would make the deprojected (true) physical size of this giant radio quasar even more extreme.
The southern hotspot in 4C 74.26 is also possibly the most spatially extended radio hotspot yet detected, with the major axis of each component on the sky. Both the northern and the southern hotspot complexes are each resolved by the VLA in A configuration into two components with each member of a pair being of nearly equal brightness to its neighbour.
Hotspots are thought to occur when particles in a jet pass through a final shock, in which their bulk kinetic energy is converted to random energy of the constituent particles (Brunetti et al., 2003). Evidence for such re-acceleration comes in the form of hotspot Spectral Energy Distributions (SEDs), morphologies and polarisation (Brunetti et al., 2003). Shock acceleration and radiative loss models also give good fits to radio–to–optical spectra (Meisenheimer et al., 1989). The low energy cut-off directly detected in 6C 0905+3955 (; Blundell et al. 2006), assuming it is common, also constrains the particle acceleration process taking place at the shock.
X-ray emission from hotspots can in principle be produced by a number of different processes, including synchrotron radiation and inverse-Compton scattering of a seed photon field, for example the synchrotron emission produced in the jet itself (known as Synchrotron Self-Compton, SSC, emission). The Cosmic Microwave Background (CMB) also provides a seed photon field, this is likely to be important in relativistic jets (e.g. Tavecchio et al. 2000; Celotti et al. 2001). In a relativistic but gradually decelerating flow, the upstream electrons can up-scatter the synchrotron emission from the slower moving downstream regions (Georganopoulos & Kazanas, 2003).
Broad band observations of hotspots have shown that many cannot be explained by a single synchrotron power law (e.g. Tavecchio et al. 2005). One-zone synchrotron–inverse-Compton models, where beaming is ignored, imply that hotspots are far from equipartition or are composed of extremely small condensations. That a hotspot is detected on only one side of a source at high energies in some sources (i.e. quasars) may be explained by relativistic beaming. Multi-zone models such as the possibility of having a fast (highly relativistic) spine surrounded by a slower layer (e.g. Chiaberge et al. 2000) and differential relativistic beaming due to decelerating bulk motions in the hotspots on the synchrotron and inverse-Compton spectra, in particular the fast moving flow sees the slow moving downstream flow which is Doppler boosted (Georganopoulos & Kazanas, 2004), can produce a gradual increase in the ratio of radio–to–X-ray flux away from the central source. Both models have been used to explain observations (Tavecchio et al., 2005).
Here we present Chandra and XMM-Newton observations of the southern hotspot of the powerful, giant, broad-line radio-loud quasar 4C 74.26 (Riley & Warner, 1990). The data used here have already been used in work on the nucleus by Ballantyne & Fabian (2005) and Ballantyne (2005), using the XMM-Newton data, and by Kaspi (2004) for the Chandra data. Throughout this paper, all errors are quoted at unless otherwise stated and the cosmology is , and . One arcsecond represents on the plane of the sky at the redshift of 4C 74.26 and the Galactic absorption along the line-of-sight is (Dickey & Lockman, 1990).
2 Data Reduction
| Telescope | Date | Obs ID | ksec |
|---|---|---|---|
| XMM-Newton | 2004 Feb. 2 | ||
| Chandra with HETG | 2003 Oct. 6 | ||
| Chandra with HETG | 2003 Oct. 8 |
Table 1 contains a summary of the X-ray observations analysed. The XMM-Newton data was reduced using the Standard Analysis System (SAS). Only EPIC-pn data is of interest here as the southern hotspot is not visible on the MOS chips due to the window used. The EPIC-pn observation was taken in Pointing mode (the data mode was Imaging) with submode PrimeLargeWindow. The analysis chain EPCHAIN was run and the data were filtered for periods of heavy flaring. The astrometry was corrected by aligning the centroid of X-ray nucleus to the VLA radio core (A-array data), a shift of . RMFGEN and ARFGEN (both SAS tasks) produced the response matrix and ancillary response files used. Photons were grouped 20 per bin, using GRPPHA, for spectral analysis.
The Chandra data were processed using the CIAO data processing software package (CIAO v3.2.2 and CALDB v3.1.0). Unfortunately, both Chandra observations were taken using the HETG which has the effect of greatly reducing the source counts detected in the zero-order image, but not the noise. The astrometry was corrected using the Astrometry Correction Thread111http://cxc.harvard.edu/cal/ASPECT/fix_offset/fix_offset.cgi which corrected Chandra’s positioning by . Pixel randomisation was turned off for all observations using the ACIS_PROCESS_EVENTS tool. Then the Sub-pixel Resolution Algorithm (Tsunemi et al. 2001 and Mori et al. 2001) was used to make use of photons that arrive near the edges and corners of the pixels, as their arrival point can be determined with sub-pixel resolution. The centroid of the Chandra nucleus agrees with the VLA A-array radio core to , so there is no need to re-align to the Chandra X-ray core with the VLA radio core. The southern hotspot is from the central source and so it was imaged using ACIS-S2 chip (CCD 6). Its Chandra and XMM-Newton fluxes are consistent within the errors.
| Instrument | date | frequency | beam | RMS |
|---|---|---|---|---|
| VLA A | 1988 Nov. 16 | |||
| VLA B | 1989 Apr. 22 | |||
| MERLIN | 2006 Jun. 6 |
The radio observations were made with the VLA222The National Radio Astronomy Observatory is operated by Associated Universities, Inc., under cooperative agreement with the National Science Foundation. and MERLIN. A summary of the observations can be found in Table 2. The VLA data were processed using standard techniques within the AIPS package, including self-calibration for phase only. The MERLIN data were initially reduced using the MERLIN pipeline, further processing was done using standard procedures within AIPS.
Optical data, obtained from the 2 m Liverpool Telescope using the CCD camera RATCam with an SDSS-r filter (5560 – 6890 Å), were taken in photometric conditions in three consecutive exposures each of 240 on 2006 November 9. Zero-point calibration was provided by observations of Landolt standard star fields (Landolt, 1992) which bracketed observations of 4C 74.26 both in time and airmass. The uncertainty in the measured zero-point, , is principally due to the error associated with transformation to Johnson R magnitudes for observations in a single waveband.
3 Results
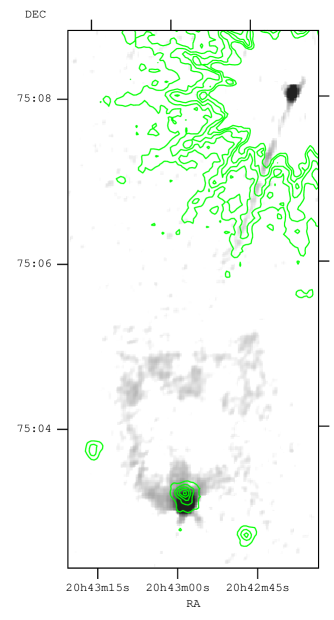
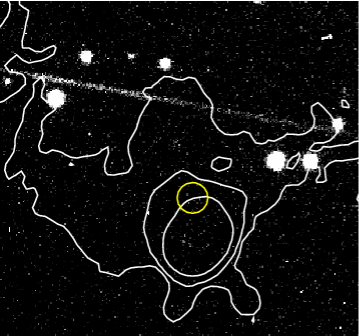
An X-ray source is seen in the XMM-Newton image close to the peak of the southern radio hotspot (Fig. 1). Its XMM-Newton spectrum (Fig. 2) comprises (of which are due to background) in the band. The source is detected in the Chandra observations along with some diffuse emission to the south which is not resolved by XMM-Newton. Unfortunately, there are not enough photons to constrain even a crude spectrum because both observations were taken with the HETG grating in place (summing the two observations which have roughly equal numbers of counts, there are a total of counts, of which are from the background, in the point source and a further counts, with background counts, in the diffuse emission).
Fitting a Galactic absorbed power-law to the XMM-Newton data gives a photon index of with a reduced chi-squared of for 18 degrees of freedom and an absorption corrected X-ray flux of in the band and in the band. The absorption corrected X-ray luminosity in the is , assuming it is at the redshift of 4C 74.26. Table 3 shows the results of the spectral fitting.
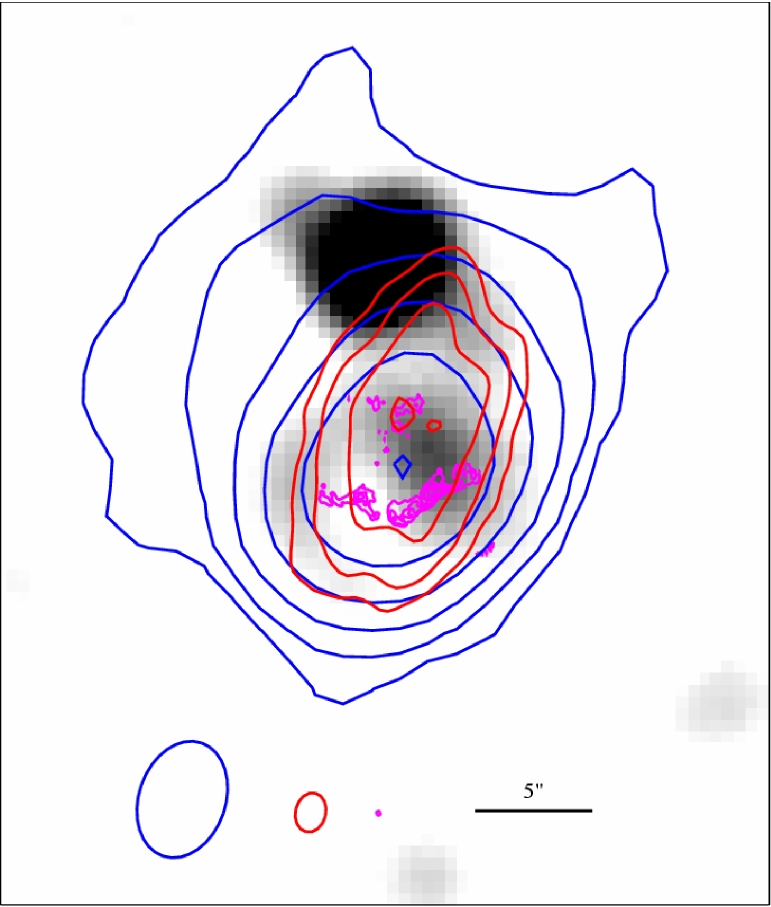
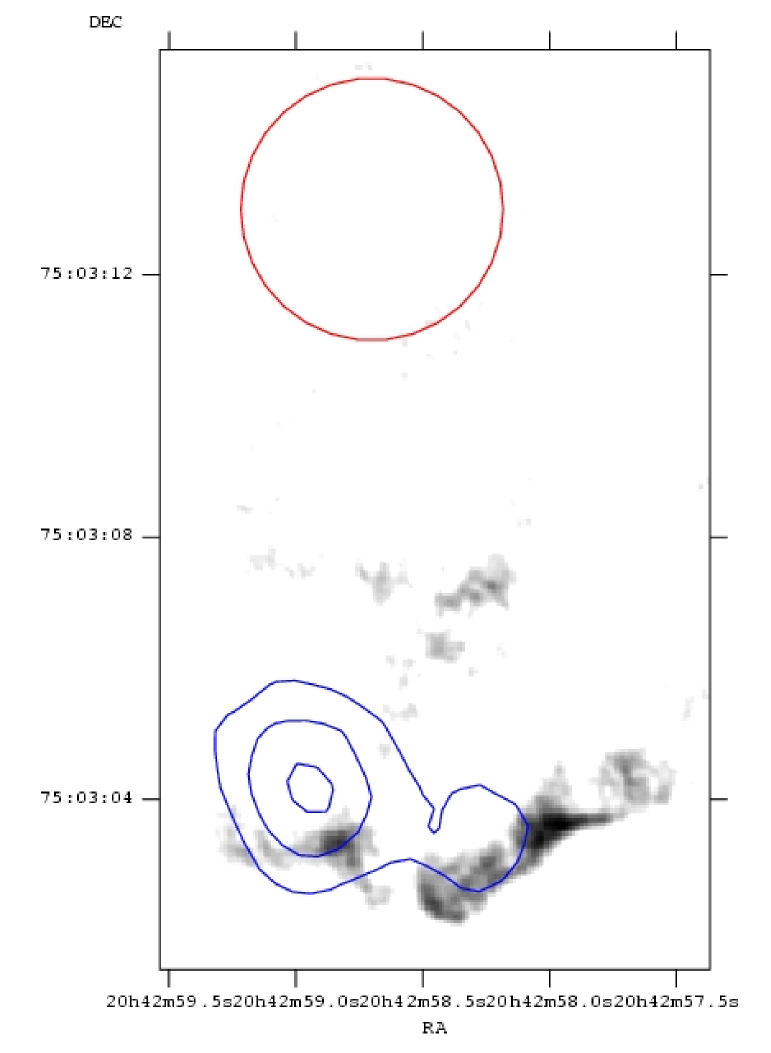
The brightest parts of the southern radio hotspot are resolved, with MERLIN’s resolution, into a complicated hotspot complex (see Fig. 4). The MERLIN hotspot consists of two peaks, both of which are resolved, with wings of radio emission attached. The east and west peaks seem to be linked by a bridge of diffuse emission, where the wings of the two peaks almost meet. The westernmost peak and wings are the brightest component, the easternmost wing of this hotspot component ends with a bright arc.
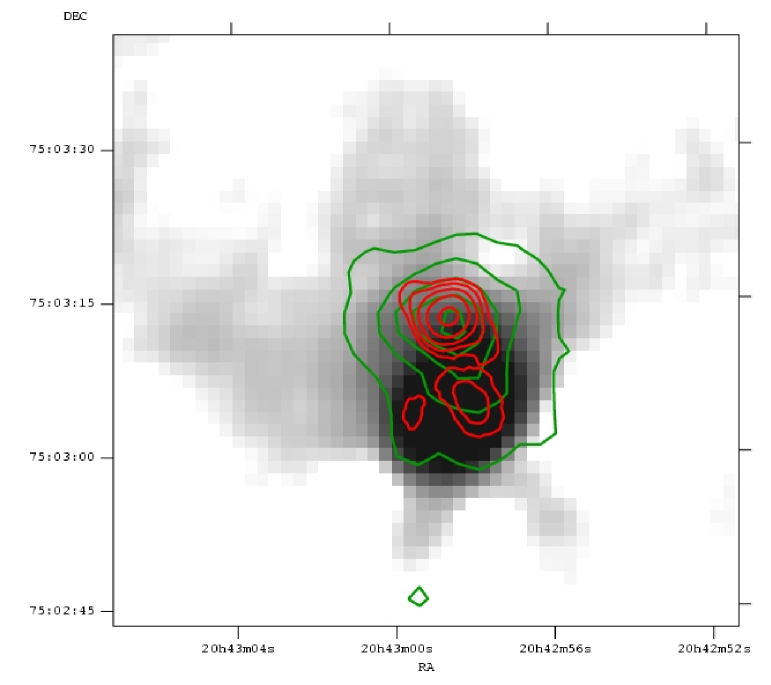
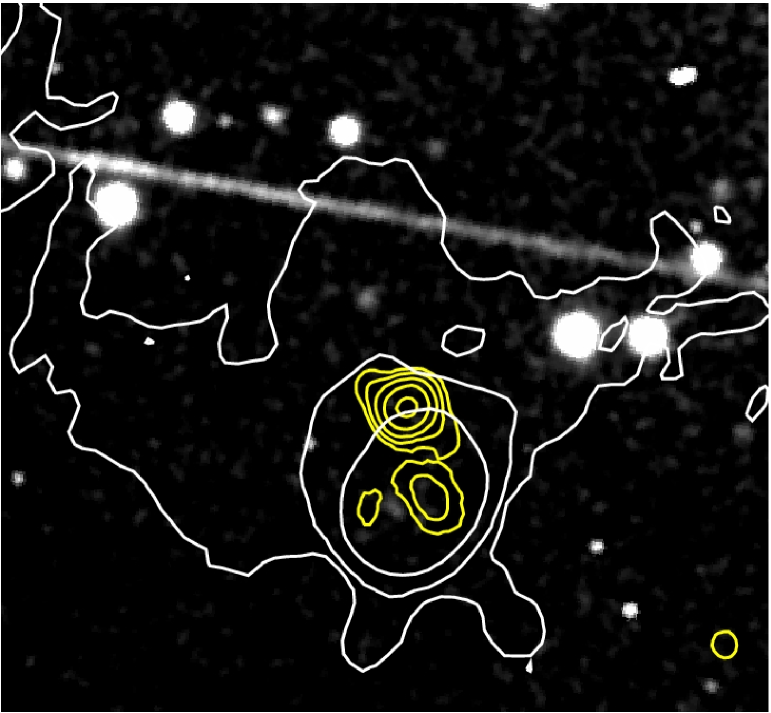
The peak of the X-ray emission is offset from the brightest radio emission in the southern hotspot complex (the westernmost, brightest peak in the MERLIN data) by . (It is offset from the brightest peak in the VLA-array data by .) This offset is clearly illustrated in Fig. 5, as well as in Fig. 1, Fig. 3, and Fig. 4. The position of the X-ray source detected with both XMM-Newton and Chandra coincides to (see Fig. 3) making it unlikely that the offset is due to instrumental effects which would be telescope dependent. The positional uncertainty is in the XMM-Newton data (Cappelluti et al. 2007 report that the rms absolute astrometric accuracy333see XMM-Newton calibration document Kirsh et al. XMM-SOC-CAL-TN-0018 at http://xmm.vilspa.esa.es. is about 2, we note that this relates to raw XMM-Newton data and so our radio-aligned XMM-Newton observation will have more accurate astrometry consistent with the relative astrometry for the EPIC-pn, which is , and the accuracy of the position of the VLA radio core). The positional uncertainty in the Chandra data is at off-axis (Lehmer et al., 2005), for the radio A-array data, for the B-array data, and for the MERLIN data. This offset is therefore real.
The peak of the MERLIN emission is not consistent with the peak of the VLA A-array emission. They are offset by (Fig. 5). Measuring the flux density in the MERLIN hotspot complex (see Fig. 7) and comparing it to the flux density in the VLA A-array hotspot, we note that they differ by a factor of ( for MERLIN at and for VLA A-array at ). The difference between the MERLIN and the VLA flux densities tells us that there is significant extended structure associated with the hotspot complex which the shorter baseline of the VLA is sensitive to but which MERLIN does not detect; MERLIN only detects the compact structure.
The northern hotspot complex, which is much weaker in the radio, is north of the core and is not detected either in the Chandra data (it would lie on the edge of ACIS-S3 chip) or the XMM-Newton data. The upper limit of its X-ray flux, calculated from the XMM-Newton data, is in the band. So the ratio of hotspot north–to–south X-ray fluxes is , assuming that the X-ray source is the hotspot.
The radio energy flux (in – i.e. the flux density multiplied by the frequency of the observation) of the southern and northern radio hotspot complexes, using B-array data and considering the whole hotspot region not just the area coincident with the X-rays, is and respectively. The X-ray energy flux at (calculated by converting the X-ray power-law normalisation which is in at to , using and the normalisation given in Table 3) is for the southern hotspot and for the upper-limit on the northern hotspot. The southern hotspot emits roughly twice as much energy in X-rays as in radio emission. The northern hotspot X-ray–to–radio flux ratio is .
No counterpart to the X-ray source was found in the DSS images444http://www-gsss.stsci.edu/SkySurveys/Surveys.htm or those from 2MASS and XMM-Newton Optical Monitor (there are no available HST images). Our Liverpool Telescope observations go much deeper ( at for a point source); however, no optical source at the position of the X-ray source is detected, but there is some faint diffuse emission consistent with being coincident with the westernmost peak of the radio hotspot as resolved by MERLIN (see Fig. 7) which has a magnitude of (using a aperture), and is detected at the level (see Fig. 6). Deep high-resolution multi-band optical observations are required to confirm the presence of this optical hotspot, to measure its flux with much more certainty, and especially to resolve and characterise it.
The optical R band energy flux, which is calculated by multiplying the flux density555Calculated using http://www.astro.soton.ac.uk/~rih/applets/MagCalc.html by the observation frequency (i.e. at a wavelength of 7000), is for the diffuse emission coincident with the radio hotspot and for the X-ray hotspot. The energy radiated in X-rays, from the X-ray hotspot, and in optical R band emission, coincident with the radio hotspot, is consistent within the errors; although it should be remembered that the optical detection is only at so there is considerable uncertainty in this measurement.
The jet is not detected by Chandra and a scattering spike on the XMM-Newton image exactly coincides with the radio jet direction, making any quantitative constraint on X-ray emission from the jet impossible. We note that the second lowest contour in Fig. 1 extends further in the jet direction than on the other spikes so jet emission at that level is likely.
3.1 X-ray hotspot or coincidental source?

To check whether the X-ray source is consistent with being a background AGN, we calculate the X-ray–to–optical flux ratio, , which is , using (Miniutti et al., 2006), where is the X-ray flux in the band and is the R band magnitude limit.
The cores of typical AGN have ratios of and most AGN with are heavily obscured, Type II AGN (Mignoli et al., 2004). Sources with are very rare and are known as Extreme X-ray / Optical sources (EXO) (Koekemoer et al., 2004). If this source were an EXO then it would be the most X-ray bright example detected to date, which makes estimating the probability of finding such an EXO in the field of 4C 74.26 very difficult (see Fig. 2 in Barger et al. 2003, Table 1 in Mignoli et al. 2004, as well as Koekemoer et al. 2004, Georgakakis et al. 2006 and Giacconi et al. 2002). The X-ray spectra do not require excess absorption, so we conclude that the source cannot be an obscured AGN.
The Chandra observations show diffuse emission to the south of the X-ray hotspot peak. At off-axis the Chandra PSF is such that it is currently impossible to say whether this peak is a point source or an extended one. XMM-Newton’s PSF is so broad that the diffuse emission clearly visible in the Chandra data is only marginally detected with XMM-Newton.
| Normalisation | (dof) | |||
|---|---|---|---|---|
| at | ||||
| () | ||||
| () |
| source | ||
|---|---|---|
| Pictor A | ||
| Cygnus A | ||
| 4C 74.26 |
Typical values for hotspot photon indices found in the literature range from for hotspot A2 in 3C 303 (Kataoka et al., 2003) and for northern hotspot J in 3C 351 (Hardcastle et al., 2002) to for southern hotspot K in 3C 263 (Hardcastle et al., 2002). The southern hotspot, for which the photon index is , is therefore consistent with the reported range of X-ray hotspot photon indices.
The preceding analysis shows that it is most likely that the X-ray source is an X-ray hotspot offset from the radio peak but still lying just within the region covered by the extended radio hotspot (see VLA A- and B-array contours in Fig. 4), to the north of its peak (Fig. 7) and along the axis of the radio jet as it enters the radio hotspot (Fig. 1 and Fig. 3). In Fig. 4, it can be clearly seen that the X-ray peak is offset from the westernmost peak and brightest part of the complicated radio hotspot. There is some faint X-ray emission associated with the radio hotspots themselves. A Chandra observation (without the gratings in place) of the X-ray hotspot complex would enable us to characterise the peak and diffuse emission both spatially and spectrally, which is essential for understanding the processes taking place in this source.
4 discussion
The southern X-ray hotspot in 4C 74.26 is unusual, not only because it is the most luminous X-ray hotspot to be detected at low redshift (see Table 4) and probably furthest from its central nucleus, but also because of the significant offset between its X-ray and radio hotspots (Fig. 5, using MERLIN data, which is on the plane of the sky at the redshift of 4C 74.26).
4C 74.26 is not the first nearby source to be detected with an offset between its X-ray and radio hotspot components. 4C 19.44 () has a () offset between its X-ray and radio hotspots which is in the same sense as the offset in 4C 74.26—it is also a large ( jet), one-sided source (Sambruna et al., 2002).
Offsets have been detected between an increasing number of radio, optical and X-ray jet-knots in large-scale jets. The offset is usually in the same sense as for 4C 74.26 with the peak of the X-ray emission lying closer to the nucleus than the peak of the radio emission (e.g. PKS 1127-145, Siemiginowska et al. 2002; M87, Marshall et al. 2002; 3C 273, Jester et al. 2006).
4.1 What is the X-ray emission mechanism?
In both the northern and southern radio hotspot complexes, the multiple components are close together, arguing against either component being a splatter spot in the manner suggested by the simulations of Cox et al. (1991). Multi-frequency radio imaging will show whether the hotspots have different spectra and hence indicate whether one is consistent with being the “primary” hotspot.
X-rays from a bow shock ahead of the radio hotspot can be ruled out as the X-ray emission is behind, not in front, of the radio hotspot. X-ray emission associated with hotspots is only likely to be synchrotron, inverse-Compton or synchrotron self-Compton (SSC). The latter can be ruled out for the X-ray peak precisely because the X-ray and radio emission are not co-spatial. Inverse-Compton, SSC or synchrotron emission may be responsible for the diffuse X-ray emission associated with the radio hotspots.
4.1.1 Inverse-Compton
X-ray emission from inverse-Compton scattering of CMB photons requires electrons with Lorentz factors, , of only , much lower than the likely Lorentz factors of synchrotron radio-emitting electrons. This can lead to a separation in X-ray and radio peaks if there is a low-energy cutoff to the electron spectrum at about so that X-rays only arise when the population has cooled sufficiently, and so trail behind the radio emission region (Blundell et al., 2006). The compact nature of the X-ray hotspot makes this explanation unlikely in this case.
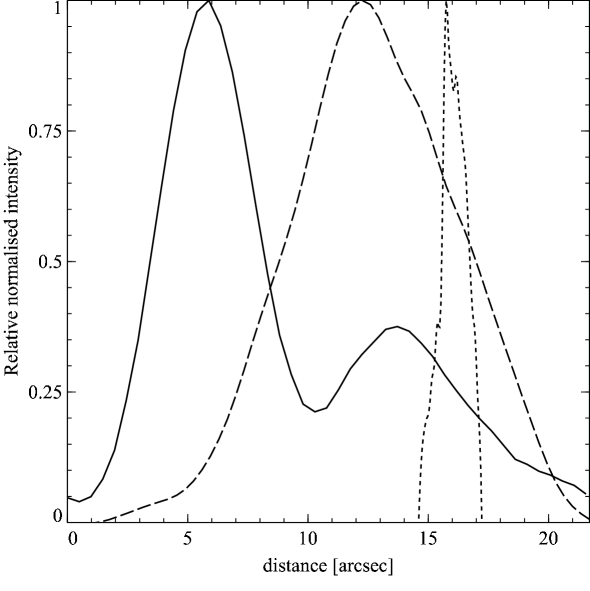
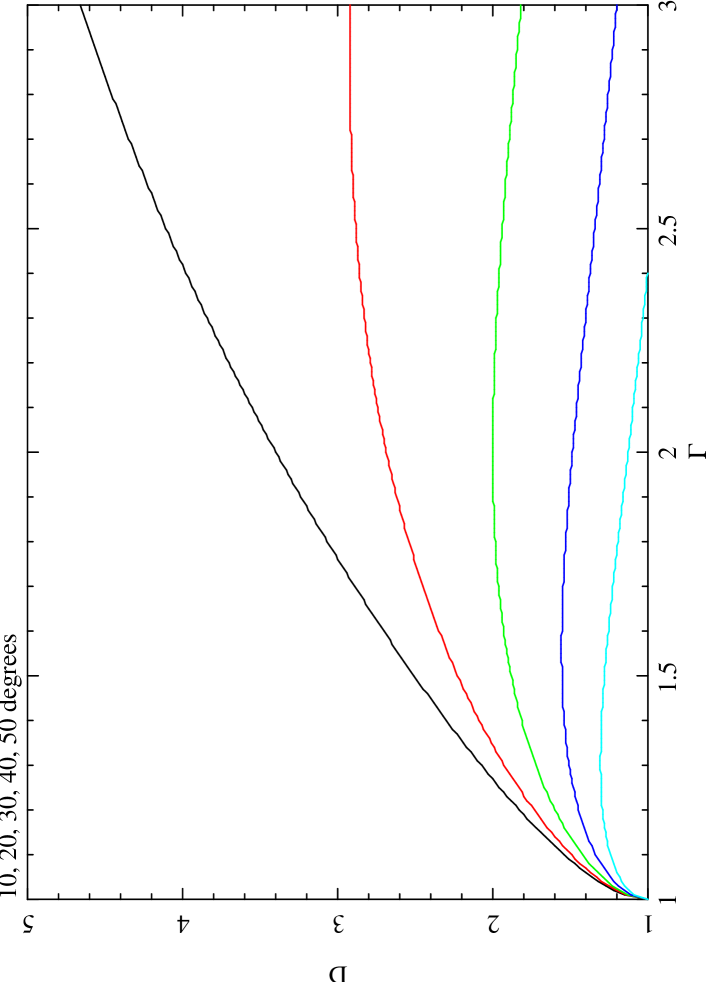
Georganopoulos & Kazanas (2004) showed that gradual deceleration of a jet after a relativistic shock can produce a separation of X-ray and radio peaks. The X-ray emission is presumed due to inverse-Compton scattering of relativistic electrons on the CMB. In order for the X-ray peak to be significantly displaced from the end of the hotspot (where the radio peaks), the angle of the jet to the line-of-sight must be less than , and preferably less than , and the bulk Lorentz factor of the jet at the X-ray spot (see Fig. 8). The sheer size of 4C 74.26 means that if it were to be aligned closer to the line-of-sight than , it would have a deprojected size larger than that of the largest known radio galaxy 3C 236 which spans (Mack et al., 1997). The beamed emission varies as a function of the Doppler beaming parameter, (see Fig. 8), to a high power (), which means the X-ray emission can drop sharply from the peak to where the jet stops, which is where the radio emission peaks due to compression of the magnetic field as the jet slows down. The synchrotron (radio) emission also has an intrinsically lower beaming dependence. It should be noted that this model relies heavily on beaming, so if the jet was aligned closer to our line-of-sight the X-ray hotspot would be very much brighter. The X-ray hotspot in 4C 74.26 is already the most X-ray luminous in the local Universe ().
4.1.2 Synchrotron
We now discuss the feasibility of the X-ray hotspot being synchrotron in origin. If this is the case, then the X-ray emission represents the main site of the particle acceleration, since the synchrotron radiative lifetime at X-ray energies is very short. The synchrotron cooling time of X-ray emitting electrons in the fields typical of hotspots is to whereas for radio emitting ones it is to .
The observed X-ray photon index, (i.e. ) is consistent with theoretical predictions for shock acceleration models (Heavens & Drury 1988, Achterberg et al. 2001). The X-ray hotspot is more luminous than the radio hotspot, consistent with the idea that it is the location at which most of the jet’s bulk energy is converted into the random motion of its particles.
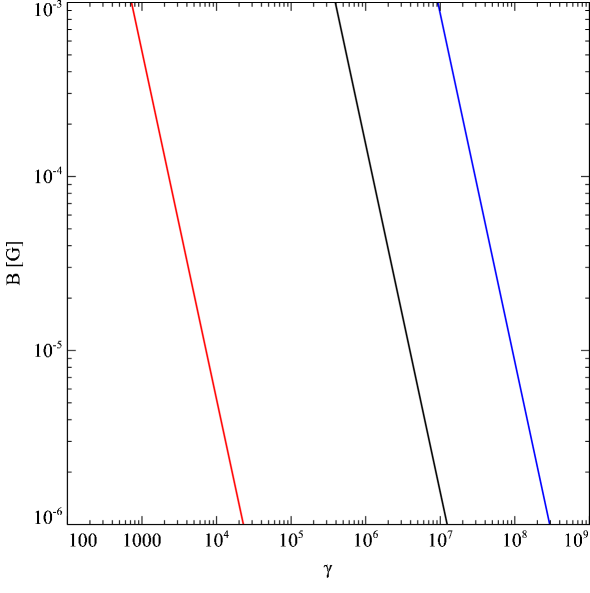
The location of the shock where particles are accelerated is where the highest Lorentz factors occur, the magnetic field is compressed and synchrotron emission is expected to be strongest. Both high Lorentz factors and a strong magnetic field contribute to synchrotron emission being observed at X-ray frequencies, since
| (1) |
where is the frequency of the synchrotron emission, is the magnetic field strength, is the charge on an electron, is the rest mass of an electron and is the Lorentz factor of the electron. Figure 9 shows this relationship between and , for radio synchrotron (red line), for optical synchrotron (black line) and for X-ray synchrotron (blue line), illustrating that in a typical hotspot environment the production of shorter wavelength radiation will be easier.
The synchrotron cooling model of Bai & Lee (2003) predicts an X-ray / radio offset in the sense that we observe in 4C 74.26’s hotspots for knots along jets. However, this synchrotron cooling picture alone is insufficient to explain the nature of the X-ray / radio hotspot offset because the radio luminosity, while significantly lower than the X-ray luminosity, is several orders of magnitude higher than predicted by their model.
A second toy synchrotron model requiring some fine-tuning is one where the jet possesses a fast spine with lower momentum than the surrounding slower sheath (e.g. Chiaberge et al. 2000). This would mean that the spine would be stopped by the surrounding medium more easily. As the spine is moving faster, the shock is more efficient at accelerating the particles, producing X-ray synchrotron emission, whereas downstream the sheath, which is moving slower, is less effective from this point of view, so we see much less X-ray emission (assuming higher bulk Lorentz factors lead to higher electrons being produced).
The most likely synchrotron model for the X-ray–radio hotspot offset is the ‘dentist’s drill’ model (Scheuer, 1982) where the X-ray hotspot is the current active end of the jet and the radio hotspot marks where it was previously. Presumably the direction of the jet has moved, either as a result of precession or a perturbation in the nucleus, or of buoyancy effects or instabilities along the jet. Note that the jet must curve, because it clearly does not lie on a straight line from the nucleus to any hotspot component (Fig. 1). Multiple hotspots, as indeed we have in this object, have previously been accounted for by such a ‘dentist’s drill’ effect (Scheuer, 1982). The X-ray hotspot is more luminous than the radio one which accords with it being the most recent one, in a region of enhanced magnetic field and synchrotron lifetime arguments fit with it being young ( to ). The X-ray hotspot being inset from the radio hotspot is also consistent with this model as the jet may now be hitting the side of the cavity it carved out when creating the radio hotspot. In the context of this model, giant radio sources are thought to be those that do not move around very much so have created a channel a long way from their central sources (Scheuer, 1982), this is consistent with the compact double radio hotspot in 4C 74.26. It may be that we are seeing the ‘dentist’s drill’ effect as an offset in this source precisely because it is large; 4C 19.44 is also a large source where an analogous offset is seen (Sambruna et al., 2002).
4.1.3 Observational tests
The ‘dentist’s drill’ model predicts optical/IR emission coincident with the X-ray hotspot and/or at the location of the no-longer-fed, radio hotspots.
We detect faint diffuse optical emission associated with the radio hotspot which is in keeping with our synchrotron models. Deeper optical or IR observations are needed to be able to make a more secure detection and identify its nature.
The inverse-Compton up-scattering of the CMB in a decelerating jet model predicts a smooth change in X-ray brightness between the X-ray and radio peak and no change to the spectral index.
Further Chandra observations (without the gratings in place) would permit us to characterise the X-ray hotspot both spatially and spectrally and thus say whether we are seeing a jet which is relativistic on scales of at least 800.
5 conclusions
We have presented archival XMM-Newton and Chandra observations of 4C 74.26, one of the largest sources in the local Universe with each jet long projected onto the plane of the sky making it the largest known radio quasar. We find a bright X-ray counterpart to the southern radio hotspot which is the most X-ray luminous hotspot known at low redshift.
There is a significant offset between the radio (MERLIN) and X-ray (XMM-Newton) peak; however, our analysis shows that the X-ray source is not a background AGN due to its extreme X-ray–to–optical flux ratio and spectrum.
The X-ray hotspot, being more luminous than the radio hotspot, may reveal the site where the jet dumps most of its energy and is the site of particle acceleration; the separation of the radio and X-ray hotspots may arise from Scheuer’s ‘dentist’s drill’ effect. The offset may alternatively be created by inverse-Compton scattering of the CMB in a relativistic and decelerating jet, which would imply that the jets in 4C 74.26 are relativistic on scales of at least 800. A final toy model invokes the idea that the jet may contain a fast spine which has less momentum than its surrounding sheath and is stopped more efficiently.
In order to differentiate between these various models whose implications all have important consequences for our understanding of dynamics of jets, we require higher resolution X-ray data and deeper, high resolution, optical imaging data.
Acknowledgements
MCE acknowledges PPARC for financial support. ACF and KMB thank the Royal Society. CM thanks LJMU for support and award of LT observing time. DRB is supported by the University of Arizona Theoretical Astrophysics Program Prize Postdoctoral Fellowship. We thank Tom Muxlow for help with the MERLIN observation. We thank Elena Belsole, Annalisa Celotti and Carolin Crawford for their helpful comments. We thank the referee for useful comments that improved the content of this paper. MERLIN is a National Facility operated by the University of Manchester at Jodrell Bank Observatory on behalf of PPARC.
References
- Achterberg et al. (2001) Achterberg A., Gallant Y. A., Kirk J. G., Guthmann A. W., 2001, MNRAS, 328, 393
- Antonucci (1993) Antonucci R., 1993, ARA&A, 31, 473
- Bai & Lee (2003) Bai J. M., Lee M. G., 2003, ApJ, 585, L113
- Ballantyne (2005) Ballantyne D. R., 2005, MNRAS, 362, 1183
- Ballantyne & Fabian (2005) Ballantyne D. R., Fabian A. C., 2005, ApJ, 622, L97
- Barger et al. (2003) Barger A. J. et al., 2003, AJ, 126, 632
- Barthel (1989) Barthel P. D., 1989, ApJ, 336, 606
- Blundell et al. (2006) Blundell K. M., Fabian A. C., Crawford C. S., Erlund M. C., Celotti A., 2006, ApJ, 644, L13
- Bridle et al. (1994) Bridle A. H., Hough D. H., Lonsdale C. J., Burns J. O., Laing R. A., 1994, AJ, 108, 766
- Brunetti et al. (2003) Brunetti G., Mack K.-H., Prieto M. A., Varano S., 2003, MNRAS, 345, L40
- Cappelluti et al. (2007) Cappelluti N. et al., 2007, astro-ph/0701196
- Celotti et al. (2001) Celotti A., Ghisellini G., Chiaberge M., 2001, MNRAS, 321, L1
- Chiaberge et al. (2000) Chiaberge M., Celotti A., Capetti A., Ghisellini G., 2000, A&A, 358, 104
- Cox et al. (1991) Cox C. I., Gull S. F., Scheuer P. A. G., 1991, MNRAS, 252, 558
- Dickey & Lockman (1990) Dickey J. M., Lockman F. J., 1990, ARA&A, 28, 215
- Fanaroff & Riley (1974) Fanaroff B. L., Riley J. M., 1974, MNRAS, 167, 31P
- Georgakakis et al. (2006) Georgakakis A. et al., 2006, MNRAS, 371, 221
- Georganopoulos & Kazanas (2003) Georganopoulos M., Kazanas D., 2003, ApJ, 589, L5
- Georganopoulos & Kazanas (2004) Georganopoulos M., Kazanas D., 2004, ApJ, 604, L81
- Giacconi et al. (2002) Giacconi R. et al., 2002, VizieR Online Data Catalog, 213, 90369
- Hardcastle et al. (2002) Hardcastle M. J., Birkinshaw M., Cameron R. A., Harris D. E., Looney L. W., Worrall D. M., 2002, ApJ, 581, 948
- Heavens & Drury (1988) Heavens A. F., Drury L. O., 1988, MNRAS, 235, 997
- Jester et al. (2006) Jester S., Harris D. E., Marshall H. L., Meisenheimer K., 2006, ApJ, 648, 900
- Kaspi (2004) Kaspi S., 2004, in Storchi-Bergmann T., Ho L. C., Schmitt H. R., ed, IAU Symposium, p. 41
- Kataoka et al. (2003) Kataoka J., Edwards P., Georganopoulos M., Takahara F., Wagner S., 2003, A&A, 399, 91
- Koekemoer et al. (2004) Koekemoer A. M. et al., 2004, ApJ, 600, L123
- Laing (1989) Laing R., 1989, in Meisenheimer K., Roeser H.-J., ed, LNP Vol. 327: Hot Spots in Extragalactic Radio Sources, p. 27
- Landolt (1992) Landolt A. U., 1992, AJ, 104, 340
- Lehmer et al. (2005) Lehmer B. D. et al., 2005, ApJS, 161, 21
- Mack et al. (1997) Mack K.-H., Klein U., O’Dea C. P., Willis A. G., 1997, A&AS, 123, 423
- Marshall et al. (2002) Marshall H. L., Miller B. P., Davis D. S., Perlman E. S., Wise M., Canizares C. R., Harris D. E., 2002, ApJ, 564, 683
- Meisenheimer et al. (1989) Meisenheimer K., Roser H.-J., Hiltner P. R., Yates M. G., Longair M. S., Chini R., Perley R. A., 1989, A&A, 219, 63
- Mignoli et al. (2004) Mignoli M. et al., 2004, A&A, 418, 827
- Miniutti et al. (2006) Miniutti G., Ponti G., Dadina M., Cappi M., Malaguti G., Fabian A. C., Gandhi P., 2006, MNRAS, 373, L1
- Mori et al. (2001) Mori K., Tsunemi H., Miyata E., Baluta C. J., Burrows D. N., Garmire G. P., Chartas G., 2001, in ASP Conf. Ser. 251: New Century of X-ray Astronomy, p. 576
- Pearson et al. (1992) Pearson T. J., Blundell K. M., Riley J. M., Warner P. J., 1992, MNRAS, 259, 13P
- Riley & Warner (1990) Riley J. M., Warner P. J., 1990, MNRAS, 246, 1P
- Riley et al. (1989) Riley J. M., Warner P. J., Rawlings S., Saunders R., Pooley G. G., Eales S. A., 1989, MNRAS, 236, 13P
- Sambruna et al. (2002) Sambruna R. M., Maraschi L., Tavecchio F., Urry C. M., Cheung C. C., Chartas G., Scarpa R., Gambill J. K., 2002, ApJ, 571, 206
- Scheuer (1982) Scheuer P. A. G., 1982, in Heeschen D. S., Wade C. M., ed, IAU Symp. 97: Extragalactic Radio Sources, p. 163
- Siemiginowska et al. (2002) Siemiginowska A., Bechtold J., Aldcroft T. L., Elvis M., Harris D. E., Dobrzycki A., 2002, ApJ, 570, 543
- Tavecchio et al. (2005) Tavecchio F., Cerutti R., Maraschi L., Sambruna R. M., Gambill J. K., Cheung C. C., Urry C. M., 2005, ApJ, 630, 721
- Tavecchio et al. (2000) Tavecchio F., Maraschi L., Sambruna R. M., Urry C. M., 2000, ApJ, 544, L23
- Tsunemi et al. (2001) Tsunemi H., Mori K., Miyata E., Baluta C., Burrows D. N., Garmire G. P., Chartas G., 2001, ApJ, 554, 496
- Wilson et al. (2000) Wilson A. S., Young A. J., Shopbell P. L., 2000, ApJ, 544, L27
- Wilson et al. (2001) Wilson A. S., Young A. J., Shopbell P. L., 2001, ApJ, 547, 740