A soft-lithographed chaotic electrokinetic micromixer for efficient chemical reactions in lab-on-chips
Abstract
Mixing is one of the basic functions which automated lab-on-chips require for the effective management of liquid samples. In this paper we report on the working principle, design, fabrication and experimental characterization of a soft-lithographed micromixer for microfluidic applications. The device effectively mixes two liquids by means of chaotic advection obtained as an implementation of a Linked Twisted Map (LTM). In this sense it is chaotic. The liquids are electrokinetically displaced by generating rolls through AC electroosmosis on co-planar electrodes. The device performance has been tested on dyed DI-water for several voltages, frequencies and flow-rates, displaying good mixing properties in the range of kHz, at low peak-to-peak voltages ( volts). Low voltage supply, small dimensions and possibility of fabrication via standard lithographic techniques make the device highly integrable in lab-on-a-chip platforms.
I Introduction
Since the beginning of the 1990s many research efforts have been devoted to the development of integrated miniature fluidic systems for the automated handling of biosamples on chip (lab-on-chip and micro total analysis systems ()). In many biological and chemical experimental procedures the ability to control the mixing index between different reactants is often of paramount importance for fast and efficient reactions. The development of micromixers for microfluidic applications has attracted the attention of many research groups worldwide, and a quite large number of papers already appeared which report on the development of micromixers based on different actuation strategies (see for instance Campbell and Grzybowski (2004)).
Mixing occurs when at least two species molecules spread around and diffuse uniformly in the bulk of a medium. Diffusion is a spontaneous process: the simplest micromixer is a simple channel into which two liquids are injected. If is the diffusion coefficient of a certain species, the characteristic dimension of the channel cross section, and the average flow speed, the Peclet number is and the given species mixes homogenously only after having travelled a distance over the channel . In order to reduce mixing times, channels with small cross sections are required. Nonetheless, the diffusive mixing length may be quite long. For example, mixing large macromolecular species, such as DNA or proteins, which typically have a diffusion coefficient on the order of in a wide channel, with an average flow speed of , requires a channel length of about with a corresponding mixing time exceeding . This example shows that passive micromixers, which rely only on spontaneous diffusion of species suspended in liquid carriers, are not really compatible with miniature chips. On the contrary, active micromixers are able to both shortening mixing length and reducing mixing time by “stirring” the liquids, so that their interfacial area increases while the actual diffusion distance is greatly shortened.
Since flows in microchannels are typically controlled by viscosity (“creeping flows” at low Re numbers), stirring cannot be achieved by means of turbulence. On the contrary, convective transport can be effectively used to generate chaotic advection, that is streamlines stretching-and-folding in such a way that originally close fluid particles follow trajectories which diverge exponentially in time.
Also chaotic micromixers can be passive or active. In the former class, chaotic advection may be induced by means of geometrical features of the mixing channel (Liu et al. (2000) and Stroock et al. (2002)). In the latter class, active mixing is generated by means of an external actuation which can be mechanical (e.g. in Campbell and Grzybowski (2004) self-assembled magnetic microstirrers are used), or electrokinetic (e.g. Oddy et al. (2001); Huang and Breuer (2003); Wu and Liu (2005); Lee et al. (2004)). The second type is of greater practical interest because it does not involve moving parts. On the other hand, current electrokinetic devices show a few drawbacks due to the typically high electric voltages required. The device presented here overcomes such limitations by taking advantage of low-voltage AC electrokinetic rolls generation (see below).
The device was designed according to the Linked Twisted Map (LTM) strategy described in Ottino and Wiggins (2004) and based on dynamic system theory. As the liquids flow downstream, they encounter a number of mixing elements which induce transverse circulating flows. As a fluid particle transverse one element’s length, its coordinates in the cross-section plane change to new values according to a map of the cross section into itself. The flow through many identical elements, then, can be modelled as the repeated application of that map. The mixer would perform well only if the map has effective mixing properties in the sense of dynamic system theory. The LTM is one of the possible mixing maps which might be implemented in real microfluidic mixers. The main idea of the LTM is that of alternating an asymmetric (with respect to one of the channel symmetry planes) circulating pattern with its symmetrical one (with respect to the same plane) Ottino and Wiggins (2004). The problem has been studied mathematically Wiggins and Ottino (2004), to give the conditions on the circulating flows’ “strength” and “overlap”, which ensure the map to be mixing. The device proposed in Stroock et al. (2002), is a striking example of chaotic advection induced by an LTM. In that device, also named staggered herringbone micromixer the circulating flows are generated by means of opportunely defined grooves on the top of the channel and, as such, it is a passive device.
Recently111While this work was already under preparation., Sasaki et al. Sasaki et al. (2006) have demonstrated that electrokinetic rolls can be used for developing an active micromixer. In this paper we further develop the approach presented in Sasaki et al. (2006) in the framework of the chaotic LTM-mechanism and we present a novel device which differs from that of Sasaki et al. (2006) both in geometry and fabrication technology. In particular, we show that the device can be effectively fabricated using glass an polymers, instead of silicon, using a low-cost rapid prototyping techniques called soft-lithography Xia and Whitesides (1998). Electrodes have been fabricated by sandwiching Ti-Au-Ti layers, the first one (Ti) serving as an adhesion layer over glass, the second one (Au) to reduce the electrical impedance and the third one (Ti) as a dielectric layer, since Ti spontaneously form a coherent dielectric oxide layer. Compared to the device described in Sasaki et al. (2006), current mixer performed well with very high Peclet numbers in the range - .
II Design
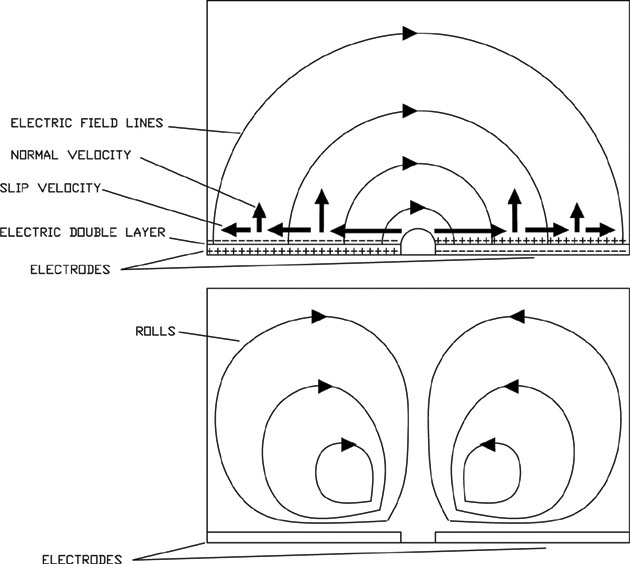
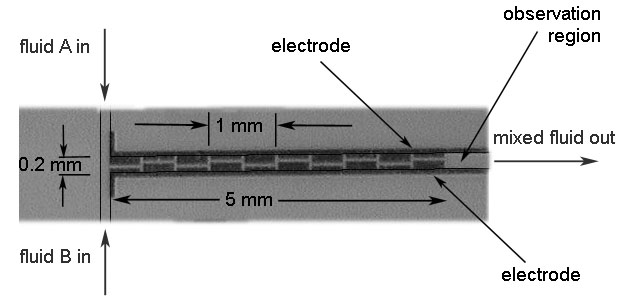
The generation of rolls by means of AC electroosmosis has been thoroughly studied both experimentally and theoretically Green et al. (2000); González et al. (2000); Green et al. (2002); Ajdari (1995) and it is becoming increasingly popular in the microfluidics community. Examples of the employment of electrokinetic rolls include micropumps Studer et al. (2002) and control of microparticles Tuval et al. (2005). The mechanism of electrokinetic roll generation is schematically illustrated in Fig. 1. Two coplanar micro-electrodes, spaced by a thin gap (on the order of wide) are addressed with an AC low voltage ( volts). The electric field interacts with a ionic diffuse layer, which forms on top of the electrodes, giving rise to a constant slip velocity which points from the electrode gap outwards (see Fig. 1, top). Since the liquid is confined in a closed cavity, the slip-velocity results in the formation of a couple of counter-rotating rolling patterns (see Fig. 1, bottom). We used asymmetric microelectrodes to produce a sequence of asymmetric rolls in order to implement a LTM. The device comprises a T-channel with two inlets for the fluids to be mixed and one outlet for the mixed flow. The flow is pressure driven. As the two liquids enter the main channel their flow is laminar () with a very slow spontaneous mixing rate. The mixing tract, hosting the micro-electrodes on its floor, starts at entrance of the main channel. The electrodes are patterned so as to define mixing elements (see Fig 2), each comprising two zones. In the first zone the gap ( wide) between the electrodes is placed at a distance from one channel side and from the other side, where is the channel width. In the second zone the gap is located symmetrically with respect to the channel axis, so that the positions of the two electrodes are interchanged (twisted). Therefore the electrode gap has the shape of a square wave moving along the channel axis. Each mixing element generates two couples of asymmetrical rolls, one for each zone. The rolls generated in the second zone are identical to those generated in the first zone, except for their interchanged (twisted) location. Such spatial twisting is at the basis of the implemented LTM strategy.
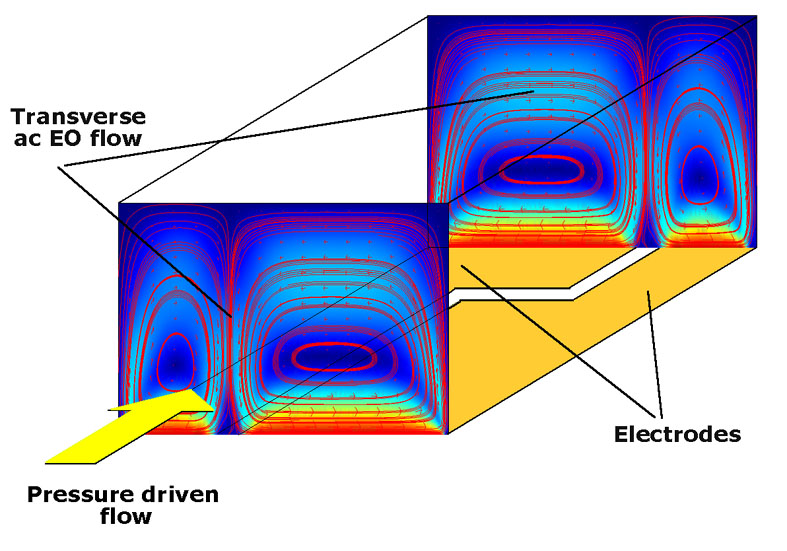
Because of the very low Re number, the resulting flow in the channel can be imagined as the superimposition of an axial pressure driven flow with transversal and twisted circulating flows, as schematically represented in Fig. 3.
The device might also work with other periodic shape of electrodes. As an example, in Sasaki et al. (2006) a device with a sinusoidal gap between electrode is presented.
III Fabrication
The channel has been fabricated in PDMS using soft-lithographic techniques Xia and Whitesides (1998). The electrodes where patterned on a glass substrate using a lift-off process. The electrodes were made of an Au layer () sandwiched between two Ti layers ( bottom, top) as described in Green et al. (2000). The bottom layer serves as an adhesion layer, whereas the top layer serves for insulation purposes (Titanium develops an insulating superficial thin oxide layer at room temperature and pressure conditions). The PDMS channel was aligned and mounted on the patterned glass substrate to define the micro-device. Sealing between PDMS and glass was obtained by assembly the parts in a purposely developed mechanical support. The main channel is wide and high. The mixing region is long for a total of five long mixing elements.
IV Experimental
The micro-device was treated in an oxygen plasma (, ) to make the channels hydrophilic, then it was primed with DI water. The two inlet reservoirs were respectively loaded with DI water and methylene blue dyed water. The pressure was applied by connecting the inlets to a pressurised air chamber. The pressure was measured using a digital manometer (model 840081 by Sper Scientific). The pressure in the air chamber was generated hydrostatically connecting the chamber to a vertical column filled with water. The device outlet was left at room pressure ().
The electrodes were connected to a wave form generator with maximum output voltage and addressed with a sinusoidal wave. In the experimental tests we observed the region of the channel which follows the mixing region using a CCD microscope (from Hirox inc.). Digital videos at 30 frames per second were stored in a PC equipped with a frame-grabber (VCE-pro by Imperx Inc.) for off-line analysis.
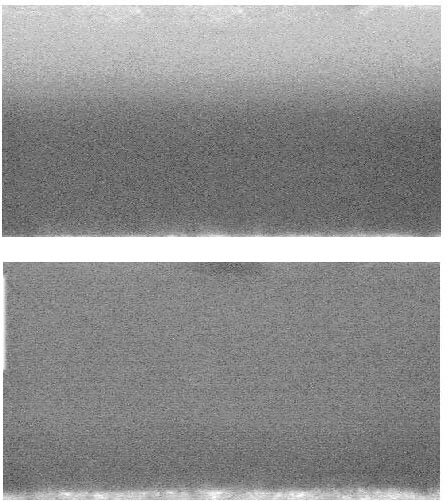
Figure 4 shows two pictures ( pixels) taken at constant applied relative pressure (, corresponding to ) when the device is off (top) and on. In both cases the applied voltage is at . The picture shows how the blue dye spreads homogeneously through the channel cross section.
To quantify the mixing level starting from images analysis we adopted the standard deviation method as described in Stroock et al. (2002). The frames were first converted to grey-scale and then pixel values were normalized to , so that corresponds to white and to black. Finally, standard deviation of pixel values was computed.
Two theoretical limit cases exist. For perfectly unmixed fluids222In practice, diffusion always creates a finite grey region at interface. half pixels are black and half are white. In this case it is . For fully mixed fluids all the pixels have the same grey color and it is . Based on this observation, we define the mixing index as:
| (1) |
in such a way that corresponds to completely unmixed fluids and to completely mixed ones. It is worth underlining that this definition of mixing index contains an element of arbitrariness as it depends on the contrast of the image. Further, since the standard deviation is used, is affected by the CCD noise. As a consequence, images need to be pre-processed before computation of the standard deviation. We proceeded as follow. Since the mixing index is evaluated over the cross sections of the channel, which correspond to lines perpendicular to the axis as viewed in the grabbed frames, pixels intensities have been averaged along rows, so as to reduce each image matrix to a array. This array contains the mean value of pixel intensities along each row. To overcome the arbitrariness due to contrast we took the first frame acquired during the experimental session, reduced it to an array as explained above, evaluated its maximum and minimum pixel values , and adjusted the contrast by linearly mapping the pixel value interval into the interval . The same transformation was then applied to all the arrays obtained from the frames acquired during the experimental session. Finally the mixing index was calculated for each array.
We performed a number of experimental tests at different applied pressure differences ( psi, corresponding respectively to measured Peclet numbers of ), for different values of driving frequency (ranging from to Hz) and four values of peak-to-peak voltage amplitude (,, and volts). The chosen Peclet numbers correspond to average flow velocities of , and and flow rates of .
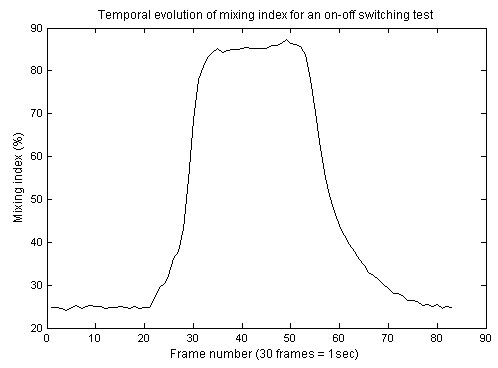
The tests consisted in turning the device on and off while recording a video. Fig. 5 shows a typical temporal evolution of the mixing index. For each test we computed the temporal evolution of the mixing index. The average mixing index calculated over the high plateau has been taken as a measure of the mixing performance of the device at the corresponding values of frequency, voltage and flow-rate. The error on this measure is given by the standard deviation of the mixing index on the plateau.
V Results and discussion
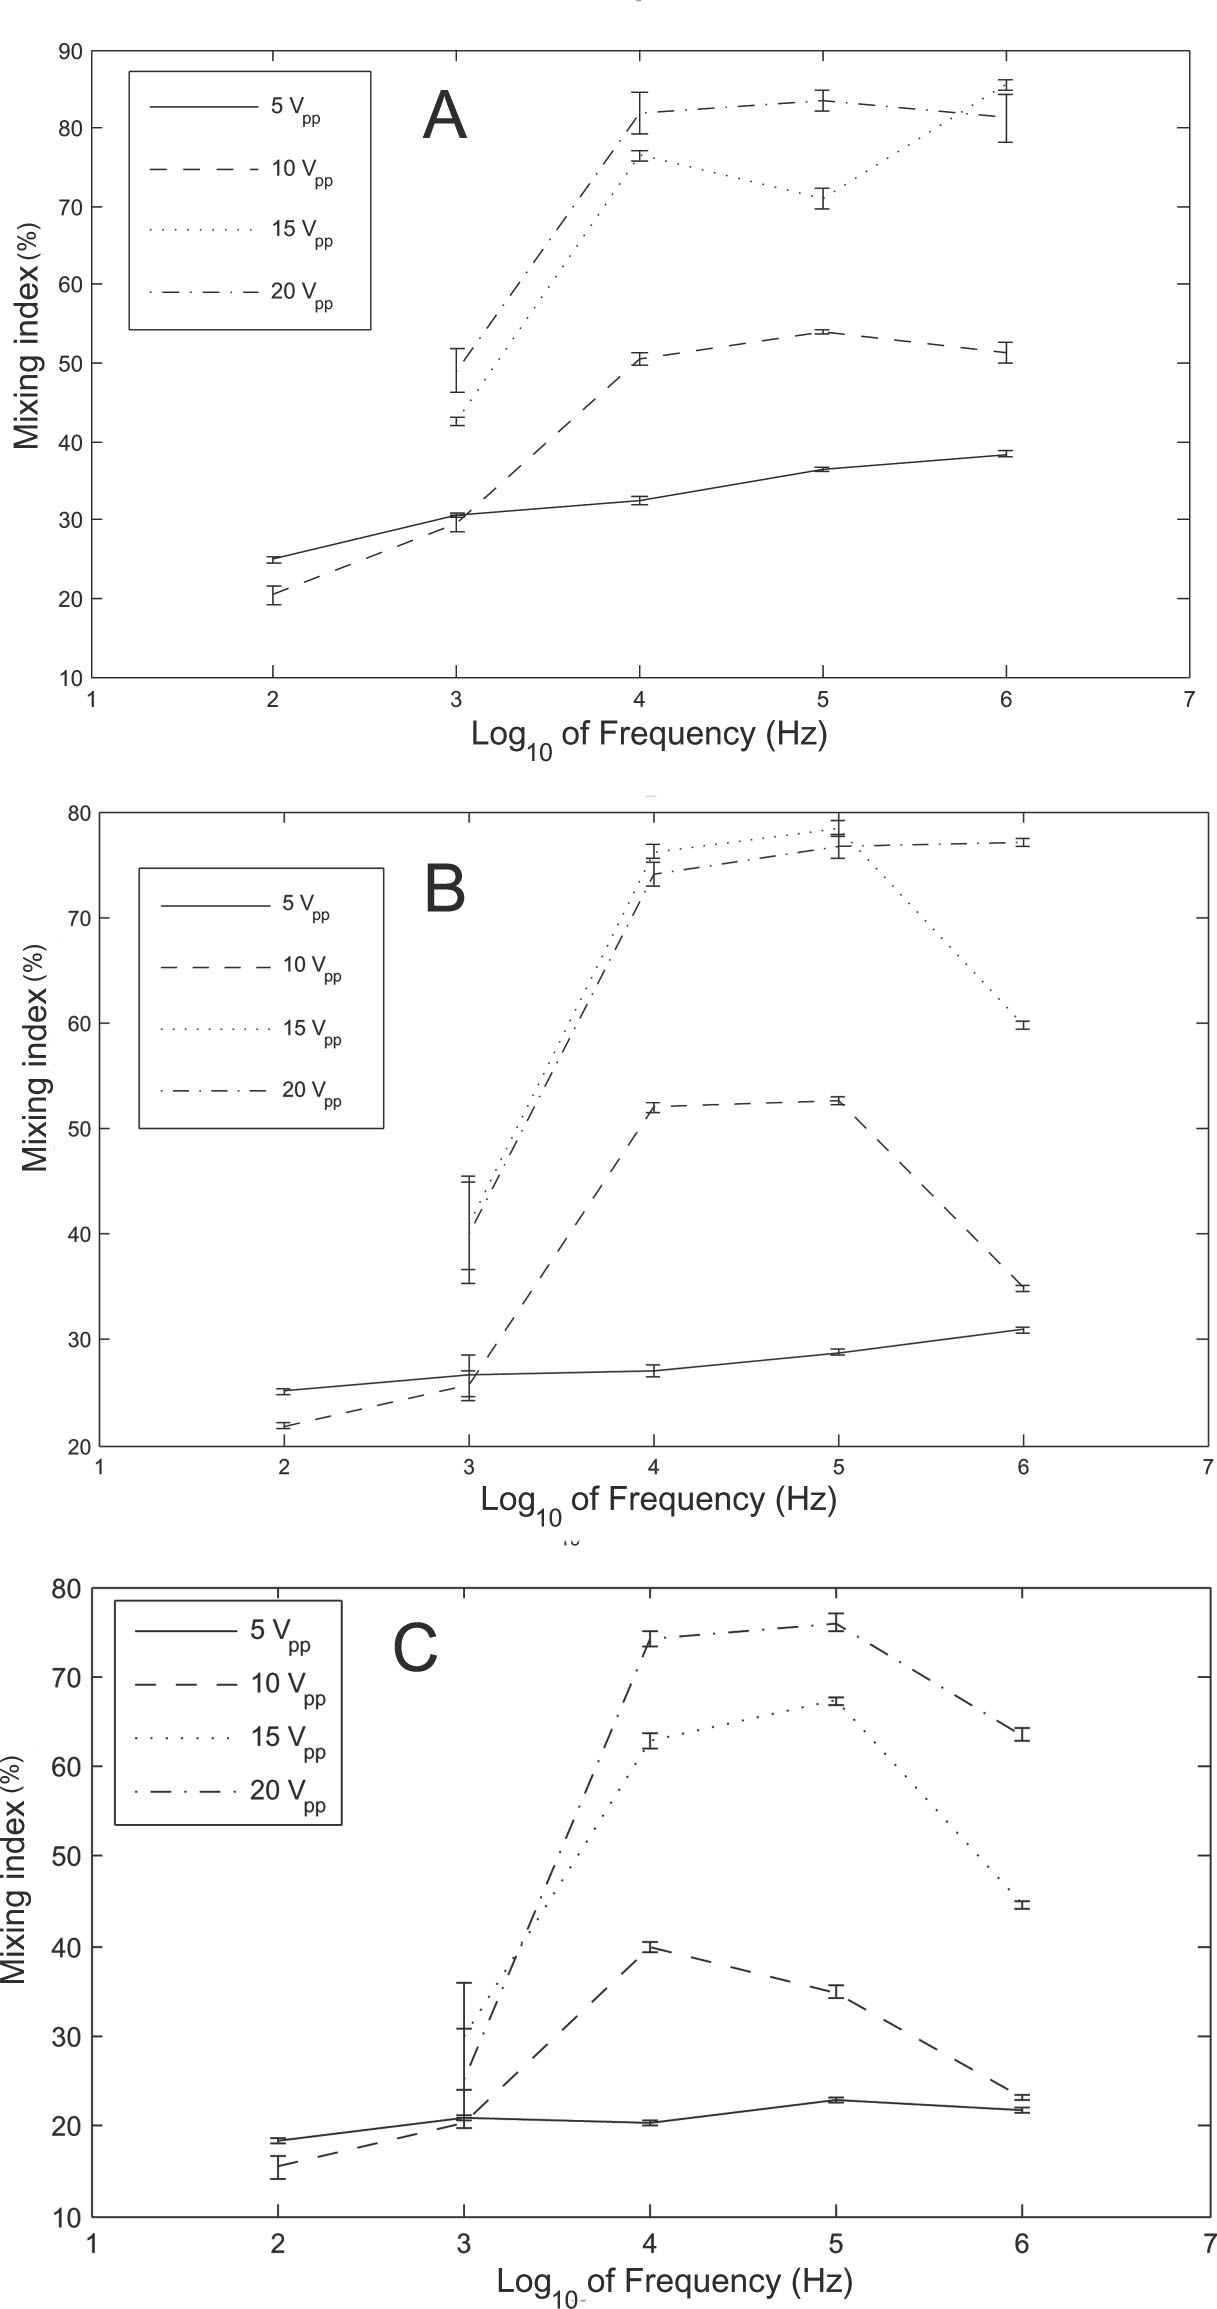
The results of all tests are collected in Fig. 6. The mixing index is higher for higher applied voltages. All the curves display a similar behavior: the mixing index grows with frequency up to the value of kHz, where a plateau begins. In most cases a decrease is observed around , where electrothermal phenomena may occur. Peak performance () is observed at frequencies between kHz and MHz, for the lowest Peclet number employed (). The presence of a peak frequency around 100 kHz was expected on the basis of the theoretical analysis of Ref. Ajdari (2000): at lower frequencies the field quickly relaxes into the bulk, whereas at higher frequencies the electric charges do not have time to build up over electrodes.
Measurements also show that the mixing index decreases with increasing flow rates, so that longer mixing lengths are required for higher flow velocities. This behavior is expectedly typical for such devices and a similar one was also reported in Sasaki et al. (2006).
We conclude by observing a few advantages and drawbacks of this device with respect to other similar ones reported in literature. For what concerns the drawbacks we should notice that, unlike the staggered herringbone micromixer Stroock et al. (2002), the axial and transverse flows are independent from each-other. Therefore, as the axial velocity increases, one has to increase the velocity of the circulating flows accordingly in order to guarantee that the resulting map be mixing. Practically this poses a limit to the range of flow rates over which the device performs well. Nonetheless, the devised application as micromixer for Lab-on-Chip is not hindered by such limit, since the limit flow-rates are above those which can practically be produced in Lab-on-a-chip devices.
Among the advantages we should mention that unlike other electrokinetic micro-mixers Oddy et al. (2001); Wu and Liu (2005); Lee et al. (2004) which use high voltages ( volts), here the voltage employed is quite low ( volts). Furthermore, the high frequency AC operation preserve the device from observable electrolytic bubbles generation.
Another nice feature of this device is its scalability. As the channel cross section gets smaller it is expected that the same performances be reached with lower voltages. The main advantage of active micromixing is not only that the liquid can be stirred at will, but it can be mixed up to a desired level by tuning the applied voltage. This makes the device amenable to be integrated with a programmable control system which records pixel values with a CCD sensor, process them in real time and tunes the voltage output in order to control the mixing level.
All these properties, along with the small dimensions and the possibility, which we have demonstrated, of using soft-lithography as fabrication technique, makes the device ideal for integration on low-cost, multi-functional Lab-on-a-chip platforms.
Acknowledgements
This work has been supported by the Italian Ministry of Education, University and Research through grants FIRB RBNE01T22-003 and FIRB RBNE01ZB7A-005.
References
- Campbell and Grzybowski (2004) C. J. Campbell and B. A. Grzybowski, Royal Society of London Transactions Series A 362, 1069 (2004).
- Liu et al. (2000) R. H. Liu, M. A. Stremler, K. V. Sharp, M. G. Olsen, J. G. Santiago, R. J. Adrian, H. Aref, and D. J. Beebe, JOURNAL OF MICROELECTROMECHANICAL SYSTEMS 9, 190 (2000).
- Stroock et al. (2002) A. D. Stroock, S. K. W. Dertinger, A. Ajdari, I. Mezić, H. A. Stone, and G. M. Whitesides, Science 295, 647 (2002).
- Oddy et al. (2001) M. H. Oddy, J. G. Santiago, and J. C. Mikkelsen, Analytical Chemistry 73, 5822 (2001).
- Huang and Breuer (2003) P. Huang and K. S. Breuer, in Transducers’03 (2003), pp. 663–666.
- Wu and Liu (2005) H.-Y. Wu and C.-H. Liu, Sensors and Actuators A 118, 107 115 (2005).
- Lee et al. (2004) C.-Y. L. G.-B. Lee, L.-M. Fu, K.-H. Lee, and R.-J. Yang, J. Micromech. Microeng 14, 1390 139 (2004).
- Ottino and Wiggins (2004) J. M. Ottino and S. Wiggins, Science 305, 485 (2004).
- Wiggins and Ottino (2004) S. Wiggins and J. M. Ottino, Phil. Trans. R. Soc. Lond. A 362, 937 970 (2004).
- Sasaki et al. (2006) N. Sasaki, T. Kitamori, and H.-B. Kim, Lab on a Chip 6, 550 554 (2006).
- Xia and Whitesides (1998) Y. Xia and G. M. Whitesides, Angewandte Chemie International Edition 37, 550 (1998).
- Green et al. (2000) N. G. Green, A. Ramos, A. González, H. Morgan, and A. Castellanos, Physical Review E 61, 4011 (2000).
- González et al. (2000) A. González, A. Ramos, N. G. Green, A. Castellanos, and H. Morgan, Physical Review E 61, 4019 (2000).
- Green et al. (2002) N. G. Green, A. Ramos, A. González, H. Morgan, and A. Castellanos, Physical Review E 66, 026305 (2002).
- Ajdari (1995) A. Ajdari, Physical Review Letters 75, 755 (1995).
- Studer et al. (2002) V. Studer, A. Pepin, Y. Chen, and A. Ajdari, Microelectronic Engineering 61 62 pp. 915–920 (2002).
- Tuval et al. (2005) I. Tuval, I. Mezić, F. Bottausci, Y. T. Zhang, N. C. MacDonald, and O. Piro, Physical Revire Letters 95, 236002 (2005).
- Ajdari (2000) A. Ajdari, Phys. Rev. E 61, R45 (2000).