An X-ray Imaging Study of the Stellar Population in RCW 49
Abstract
We present the results of a high-resolution X-ray imaging study of the stellar population in the Galactic massive star-forming region RCW 49 and its central OB association Westerlund 2. We obtained a 40 ks X-ray image of a 17′17′ field using the Chandra X-ray Observatory and deep near-infrared (NIR) images using the Infrared Survey Facility in a concentric 8383 region. We detected 468 X-ray sources and identified optical, NIR, and Spitzer Space Telescope mid-infrared (MIR) counterparts for 379 of them. The unprecedented spatial resolution and sensitivity of the X-ray image, enhanced by optical and infrared imaging data, yielded the following results: (1) The central OB association Westerlund 2 is resolved for the first time in the X-ray band. X-ray emission is detected from all spectroscopically-identified early-type stars in this region. (2) Most (86%) X-ray sources with optical or infrared identifications are cluster members in comparison with a control field in the Galactic Plane. (3) A loose constraint (2–5 kpc) for the distance to RCW 49 is derived from the mean X-ray luminosity of T Tauri stars. (4) The cluster X-ray population consists of low-mass pre–main-sequence and early-type stars as obtained from X-ray and NIR photometry. About 30 new OB star candidates are identified. (5) We estimate a cluster radius of 6′-7′ based on the X-ray surface number density profiles. (6) A large fraction (90%) of cluster members are identified individually using complimentary X-ray and MIR excess emission. (7) The brightest five X-ray sources, two Wolf-Rayet stars and three O stars, have hard thermal spectra.
Subject headings:
X-rays: stars — infrared: stars — ISM: H II regions: individual (RCW 49) — open clusters and associations: individual (Westerlund 2) — stars: Wolf-Rayet — stars: pre–main-sequence1. INTRODUCTION
H II regions, which are recognized by diffuse hydrogen emission ionized by UV photons from stars earlier than B2, are the sites of massive star formation. Strong radiation and winds from early-type stars in massive star-forming regions (SFRs) have effects that cannot be understood by a simple extrapolation of low-mass SFRs. X-ray studies of massive SFRs, which are potentially important to detect hot gas as well as stellar constituents, had lagged behind those of low-mass regions in the past due to their greater distance, source confusion, and obscuration. Both high spatial resolution and hard X-ray sensitivity are required to overcome these difficulties.
The Chandra X-ray Observatory is capable of conducting high-resolution and high-sensitivity imaging observations in the 0.5–8.0 keV band. Its 1″ spatial resolution and sensitivity are sufficient to resolve scales 1017 cm (a typical size of ultra-compact H II regions; Churchwell 2002) and to detect X-ray emission from embedded late-type pre–main-sequence sources at a distance of several kiloparsecs, typical of well-studied Galactic massive SFRs.
Along with the Chandra Orion Ultradeep Project (Getman et al., 2005), which led to a series of X-ray imaging studies of the nearest ( 0.5 kpc) rich SFR, we have seen a surge of results from X-ray studies of massive SFRs at larger distances. Galactic massive SFRs with X-ray imaging surveys of their stellar contents include: NGC 3603 (Moffat et al., 2002), W 3 (Hofner et al., 2002), the Carina nebula (Evans et al., 2003, 2004; Sanchawala et al., 2007), NGC 6530 (Damiani et al., 2004), the Trifid Nebula (Rho et al., 2004), S 106 (Giardino et al., 2004), Ara OB1 (Skinner et al., 2005), Cepheus B (Getman et al., 2006), RCW 38 (Wolk et al., 2006), the Arches and Quintuplet clusters (Wang et al., 2006), NGC 2362 (Delgado et al., 2006), NGC 2264 (Flaccomio et al., 2006), Westerlund 1 (Skinner et al., 2006), IC 1396N (Getman et al., 2007a), NGC 6357 (Wang et al., 2007a), the Rosette nebula (Townsley et al., 2003; Wang et al., 2007b), M 16 (Linsky et al., 2007), Cygnus OB2 (Albacete Colombo et al., 2007), and M 17 (Townsley et al., 2003; Broos et al., 2007). Early results are reviewed in Townsley (2006b) and Feigelson et al. (2007).
This paper describes the results of the Chandra imaging study of the stellar contents in a southern massive SFR RCW 49 and its central OB association Westerlund 2. The region was imaged in the mid-infrared (MIR) band as a part of the Galactic Legacy Infrared Mid-Plane Survey Extraordinaire program (GLIMPSE; Benjamin et al. 2003) using the Spitzer Space Telescope (Werner et al., 2004). We also obtained deep near-infrared (NIR) images of this region using the Infrared Survey Facility. Many previous Chandra studies were combined with NIR imaging data, but none was presented with MIR imaging data, which is a growing tool for the stellar census studies in massive SFRs with the launch of Spitzer. We demonstrate the ability of high-resolution X-ray imaging to identify and understand the nature of the stellar population in massive SFRs with a particular emphasis on the combination with NIR and MIR imaging.
The outline of this paper is as follows. In § 2, we give a brief review of RCW 49 and Westerlund 2. In § 3, we present our X-ray and NIR observations of this region. In § 4, we describe our X-ray and NIR data reduction and the identification of X-ray sources with optical, NIR, and MIR sources using our deep NIR data as well as archived data. In the data reduction, special care is taken in source extraction, photometry, and cross-correlation in crowded regions. In total 468 X-ray sources are detected and 379 of them are identified by optical and infrared sources.
In § 5, we discuss how the X-ray data are relevant to discriminate intrinsic RCW 49 members, identify new sources, and infer their nature. Seven multi-faceted and loosely-related results are discussed in each subsection. In the first subsection (§ 5.1), we show that the central OB association is resolved in the X-ray image and all the massive members in this region are detected in the X-ray. In § 5.2, we argue that most of the X-ray sources with optical or infrared counterparts are intrinsic to RCW 49 by a comparison study with the X-ray population of a control field in the Galactic Plane. In § 5.3, we obtain a loose constraint on the distance to RCW 49 using the mean X-ray luminosity of T Tauri stars in the mass range of 2.0–2.7 . In § 5.4, we evaluate the nature of X-ray sources using X-ray and infrared photometric data. We employ the X-ray versus NIR flux and luminosity plots in addition to the conventional NIR color-magnitude diagram. We argue that the majority of X-ray sources are low-mass pre–main-sequence sources and early-type main sequence stars. Some early-type stars are found to be harder and more luminous in the X-ray than others with a similar NIR brightness. In § 5.5, we study the spatial distribution of X-ray-identified cluster members. Because of the low level of contamination of X-ray samples, we can identify cluster members far from the central OB association. We find a possible excess population at 4′ and the cluster boundary at 6′–7′ from the cluster center. In § 5.6, we examine the fraction of RCW 49 members individually selected using X-ray emission and find that about half of the RCW 49 sources brighter than Ks14 mag are identified by X-rays. The rate increases to 90% when combined with MIR excess emission, another indicator of cluster membership complementary to the X-ray emission signature. In the last subsection (§ 5.7), we discuss the X-ray spectra of the five brightest X-ray sources. We summarize these results in § 6.
2. RCW 49 and Westerlund 2
RCW 49 was identified as an optically-visible H II region by Rogers et al. (1960). It is also known as Kes 10 (Kesteven, 1968), G 284.3–00.3, and Gum 29 (Gum, 1955). The visual extinction toward the region is 5–6 mag (Carraro & Munari, 2004; Rauw et al., 2007; Ascenso et al., 2007). The stellar constituents in the region were studied by imaging studies in the optical (Moffat & Vogt, 1975; Moffat et al., 1991; Piatti et al., 1998; Carraro & Munari, 2004; Rauw et al., 2007), infrared (Churchwell et al., 2004; Whitney et al., 2004; Uzpen et al., 2005; Ascenso et al., 2007), and X-ray (Goldwurm et al., 1987; Belloni & Mereghetti, 1994) bands. At least a dozen OB stars comprise the central OB association called Westerlund 2 (Wd 2; Westerlund 1960). The association is also known as NGC 3247 (Dreyer, 1888), ESO 127-18, and C 1024-576.
Moffat et al. (1991) identified six O6–7 stars based on low-resolution optical spectroscopy. Rauw et al. (2007) added six more O-type stars and gave a consistent classification based on medium-resolution optical spectroscopy. These stars were reclassified toward earlier spectral classes ranging between O3 and O6.5 (Rauw et al., 2007).
Three more early-type stars are found beyond the cluster core. One is a star with a spectral type of O4 V(f) or O5 V(f) (Uzpen et al., 2005; Rauw et al., 2007), which we refer to as MSP 18 (Moffat et al., 1991). Another is a binary Wolf-Rayet star WR 20a (WN6WN6; van der Hucht 2001; Rauw et al. 2005), which is the most massive binary in the Galaxy with a well-determined mass (Rauw et al., 2005). Another Wolf-Rayet star WR 20b (van der Hucht, 2001) lies 37 from Wd 2 (Shara et al., 1991). These early-type stars in and around Wd 2 are probably the cause of exotic high energy phenomena discovered in this region, such as extended hard X-ray emission (Townsley et al., 2004) found in the same Chandra data set presented in this paper and TeV gamma-ray emission (Aharonian et al., 2007) found by the High Energy Stereoscopic System telescope.
A much larger number of lower-mass members are anticipated, many of which are at the pre–main-sequence stage that can be identified either by infrared excess or X-ray emission, arising respectively from circumstellar disks and envelopes and from enhanced coronal magnetic activity. Some of the low-mass members were detected by mid-infrared excess emission using the Spitzer data (Whitney et al., 2004). In the X-ray band, the two previous studies did not have sufficient spatial resolution and sensitivity to distinguish individual stars. In these studies, respectively using Einstein and ROSAT, only one (Goldwurm et al., 1987) and seven (Belloni & Mereghetti, 1994) X-ray sources were detected in the Chandra studied field presented here. Most of these sources are isolated early-type stars and unresolved stars in Wd 2 (1E 1022.1–5730 in Goldwurm et al. 1987 and source number 24 in Belloni & Mereghetti 1994).
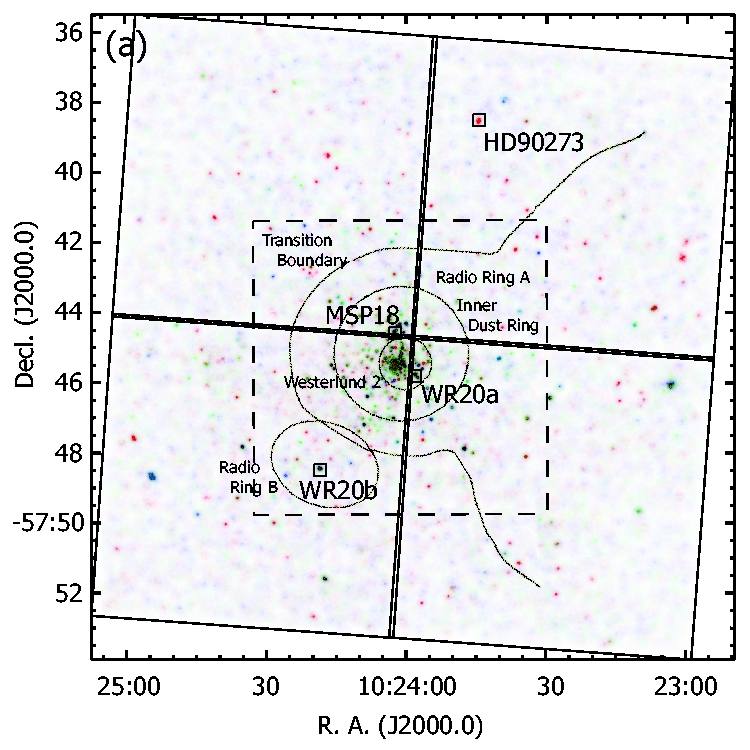
The ionized gas content at 104 K in RCW 49 was studied by a radio continuum imaging study at 0.843, 1.38, and 2.38 GHz (Whiteoak & Uchida, 1997). Two shells appear in the images, one around the complex of Wd 2 and WR 20a with a diameter of 73 (radio ring A) and the other around WR 20b with a diameter of 41 (radio ring B). Enhanced emission was found at the position where these two shells overlap. A similar global structure was found in the dust content. The MIR image taken by the Infrared Array Camera (IRAC) onboard Spitzer traces the dust distribution via polycyclic aromatic hydrocarbon emission at its three ([3.6], [5.8], and [8.0] m) of four bands (Churchwell et al., 2004). Moreover, the Spitzer image reveals a network of highly structured filaments, pillars, and shocks at arcsecond scales, some of which are suggestive of instabilities.
Both gas and dust distributions are dominated by the massive stars in Wd 2 and the two Wolf-Rayet stars via their strong stellar winds and UV radiation that sculpt the surrounding interstellar medium. These effects not only suppress further star formation, but also trigger the second generation of star formation. From the spatial distribution of MIR excess sources, Whitney et al. (2004) argued that star formation is taking place preferentially in 4′ around Wd 2. The radius corresponds to the outer boundary of the radio ring A where swept-up material is accumulated, suggesting that these young sources are a consequence of induced star formation.
The distance to RCW 49 is highly controversial, ranging from 2 to 8 kpc in the literature (Churchwell et al. 2004 and references therein). The kinematic distance determination gives a poor constraint because the region is in the tangential direction of the Saggitarius-Carina arm. The debate on the distance continues in two most recent papers; Rauw et al. (2007) argued for 8.01.4 kpc based on optical spectro-photometric study of bright stars in Wd 2, while Ascenso et al. (2007) proposed 2.8 kpc based on NIR magnitudes and colors of RCW 49 sources on the Henyey track. With the present X-ray data, we can also loosely constrain the distance using the mass-stratified mean X-ray luminosity (§ 5.3). This gives an estimate of 2–5 kpc. Despite intensive study, the distance to this cluster remains an open question. We adopt 4.2 kpc as used by Churchwell et al. (2004), which is roughly a geometric mean of the smallest and the largest distance estimates, to avoid the worst case when the question is settled.
The association of Wolf-Rayet stars and an O4–O5 V(f) star with Wd 2 suggests that the star cluster is no older than a few Myrs. No cluster member appears to be located away from the zero-age–main-sequence isochrone curve in the optical color-magnitude diagram, from which Carraro & Munari (2004) estimated an age of 2 Myr. Ascenso et al. (2007) similarly derived the cluster age of 2 Myr by fitting the color-magnitude distribution of NIR sources with theoretical calculations.
3. OBSERVATIONS
We carried out an X-ray observation of RCW 49 using the Advanced CCD Imaging Spectrometer (ACIS; Garmire et al. 2003) onboard the Chandra X-ray Observatory (Weisskopf et al., 2002) from 2003 August 23 UT 18:20 to August 24 UT 4:54. Four imaging array (ACIS-I) chips covered a 17′17′ field centered at (R. A., decl.)(10h24m005, –57°45′18″) in the equinox J2000.0 for a 36.7 ks exposure. ACIS-I covers the 0.5–8.0 keV energy band with a spectral resolution of 150 eV at 6 keV and a point spread function (PSF) radius of 05 within 2′ of the on-axis position, degrading to 6″ at a 10′ off-axis angle. The data were taken with the very faint telemetry mode and the timed exposure CCD operation with a frame time of 3.2 s.
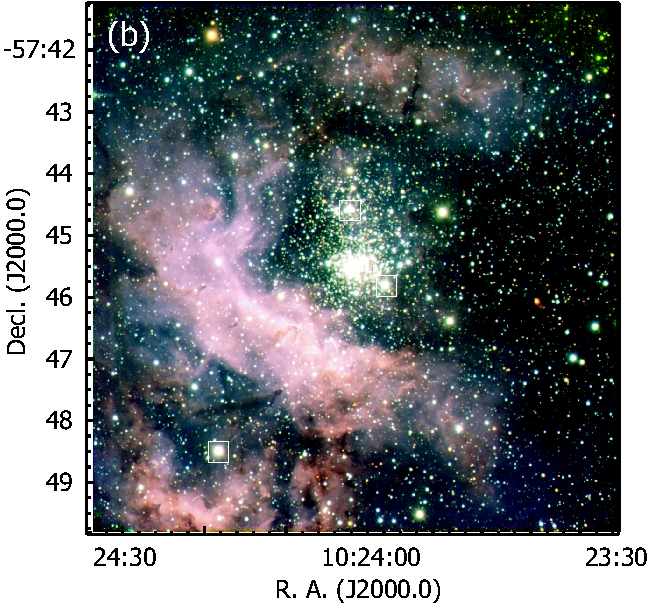
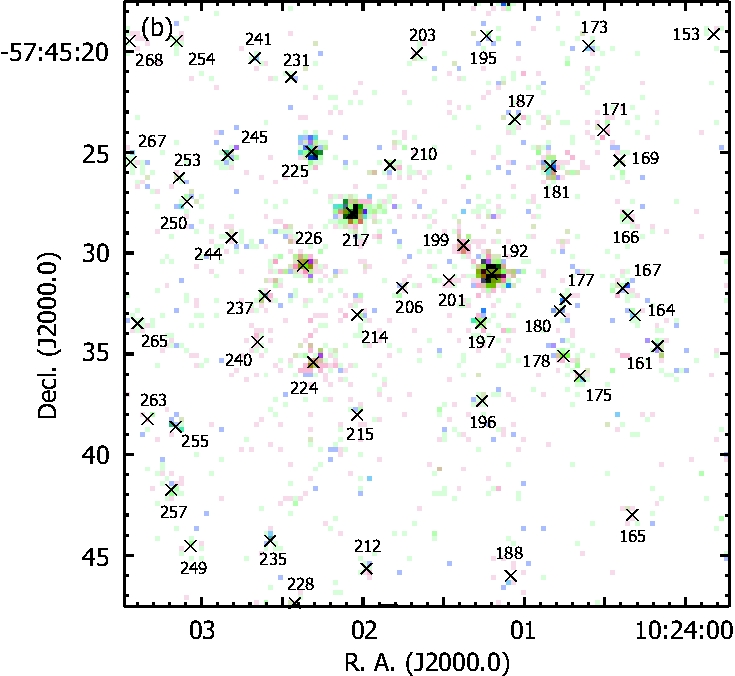
We conducted near-infrared (NIR) observations on 2004 December 25 and 28 using the Simultaneous three-color InfraRed Imager for Unbiased Surveys (SIRIUS; Nagayama et al. 2003) mounted on the Cassegrain focus of the Infrared Survey Facility (IRSF) 1.4 m telescope at the South African Astronomical Observatory. SIRIUS is a NIR imager capable of obtaining simultaneous images in the J, H, and Ks bands using two dichroic mirrors. The instrument is equipped with three HAWAII arrays of 10241024 pixels. The pixel scale of 045 is an excellent match with the on-axis spatial resolution of Chandra. With ten-point dithering, we covered 8383 fields at two positions, one aimed at RCW 49 (10h24m019, –57°45′31″) and the other at a control region (10h27m135, –58°01′26″) free from very bright sources displaced by 30′ from RCW 49. Both fields have the same Galactic latitude.
Each frame was exposed for 30 s and the total exposure time was 30 minutes equally for the two regions. Additional short (5 s) exposure frames were also taken for the two regions to extend the dynamic range of the data set to brighter sources. The observing conditions were photometric with a seeing of 10 on both nights.
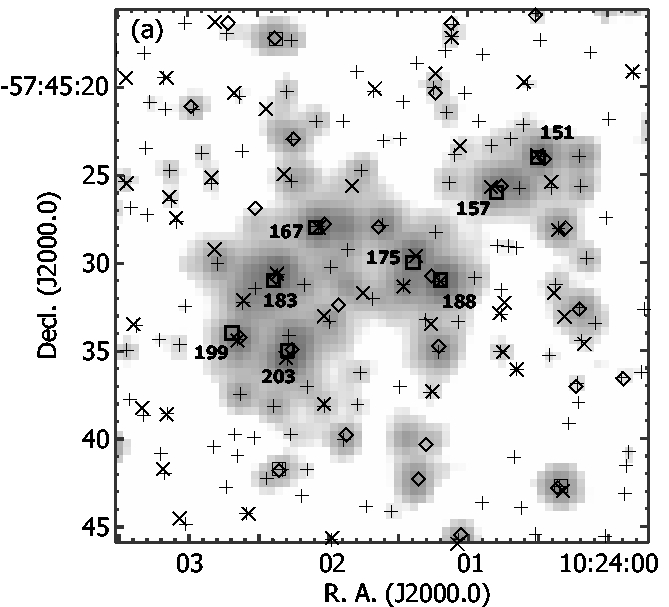
Figures 1 (a) and (b) respectively show the ACIS and SIRIUS images of the study field. The SIRIUS image has a wider coverage by 2.9 times than the image presented in Ascenso et al. (2007).
4. DATA REDUCTION AND ANALYSIS
4.1. X-ray Data
4.1.1 Reduction & Source Extraction
We reprocessed the raw data distributed by the Chandra X-ray Center to obtain an X-ray event list. A background rejection algorithm specific to data taken with the very faint mode was applied. Events were further cleaned by removing cosmic-ray afterglow and applying filters based on the event grades, status, and good-time intervals (Townsley et al., 2003). Charge transfer inefficiency was corrected (Townsley et al., 2002) and the positions of all events were improved using a sub-pixel repositioning technique (Tsunemi et al., 2001).
We detected sources using the wavdetect algorithm in the CIAO package111See http://asc.harvard.edu/ciao/ for detail. independently for the soft (0.5–2.0 keV), hard (2.0–8.0 keV), and full (0.5–8.0 keV) band images. The software failed to detect sources in crowded regions, where we manually added candidate sources with the aid of smoothed images in different kernel sizes and PSF-deconvolved images obtained using a maximum likelihood technique (Lucy, 1974; Townsley et al., 2006a). In total, 556 X-ray source candidates were identified including 60 manually added sources. We took a stance to add sources manually in a liberal manner here, and we examined their validity in a rigorous manner later.
For all the candidate sources, we used ACIS Extract222See the ACIS Extract User’s Guide at http://www.astro.psu.edu/xray/docs/TARA/ae_users_guide.html for detail. A complete description of the procedure using the ACIS Extract package can be found in Getman et al. (2005). version 3.107 for automated systematic source and background event extractions. The source positions were refined by correlating the event distribution with the PSF or by using the centroid of the events. Signals were then extracted from a 90% encircled energy polygon of 1.5 keV X-rays to derive source counts in 0.5–8.0 keV (). When two extraction regions overlap, the regions were reduced. A masked dataset was created by removing the events in a circle with a 99% encircled energy radius around all sources, from which background events were extracted locally around each source to derive their background and net counts, and , where and are the integrals of the masked exposure map values within the source and background extraction regions.
Each source candidate was tested for validity using the photometric significance (PS) and probability of no source () statistics extracted by ACIS Extract. PS is the commonly used photometric signal-to-noise ratio given by
| (1) |
where the approximation by Gehrels (1986) was employed to calculate the uncertainty . is the probability for the null hypothesis that all detected counts or more are explained by fluctuations of the background and is defined by
| (2) |
where indicates a Poisson probability distribution function of a mean to have counts.
We recognize 468 source candidates with 1.0 and 1.010-2 to be valid X-ray sources (Table 1). None of them is bright enough to cause pile-up. Almost all the sources are newly detected here.
4.1.2 Photometry & Time Variability
For all valid sources, ACIS Extract was used for recalculating their source and background counts, producing instrumental responses, and constructing spectra and light curves for systematic photometry and spectroscopy analyses. The photometry results are compiled in Table 1. Columns (1) and (2) are the sequential number and the source name. Columns (3)–(6) give position information (R. A. and decl. in the equinox J2000.0, their uncertainty, and the off-axis angle). Columns (7)–(9) show counts in 0.5–8.0 keV; , , and , whereas column (10) shows the net counts in 2.0–8.0 keV (). Column (11) indicates the PSF fraction of source extraction, in which smaller numbers than the default value (0.9) indicate that the extraction region was reduced to avoid overlapping. Columns (12) and (13) are for PS and . Columns (14) and (15) are sets of flags to indicate extraction anomalies and source variability. Column (16) gives the effective exposure time, the time needed to accumulate the observed counts if the source were at the aim point. Column (17) lists the median energy of the extracted X-ray events corrected for the background. Median energy is proposed to be a better quantity to characterize X-ray spectral hardness and to give a reliable estimate of extinction than the conventionally-used hardness ratio (Hong et al., 2004; Feigelson et al., 2005). Column (18) is the photometric flux discussed in § 4.1.3.
X-ray variability was examined for 377 bright sources off the chip gaps using a Kolmogorov-Smirnov test. The null hypothesis probability () that the flux is constant was tested and sources were placed into three classes; (a) no evidence for variability (), (b) possibly variable (), and (c) definitely variable (). Seven sources are in the “definitely variable” class, showing flare-like light curves.
4.1.3 Spectroscopy & Flux Estimates of Faint Sources
Table 2 gives the results from the X-ray spectral fits obtained with ACIS Extract, where 230 spectra with PS 2 were fitted by an optically-thin thermal plasma (APEC) model (Smith et al., 2001) with interstellar absorption. The best-fit values of plasma temperature (), the volume emission measure (), and the extinction column density () were derived. The photometric and spectroscopic tables (Tables 1 and 2) are in a format similar to those found in associated papers (Getman et al., 2006; Townsley et al., 2006a; Getman et al., 2007a; Wang et al., 2007a; Broos et al., 2007; Wang et al., 2007b).
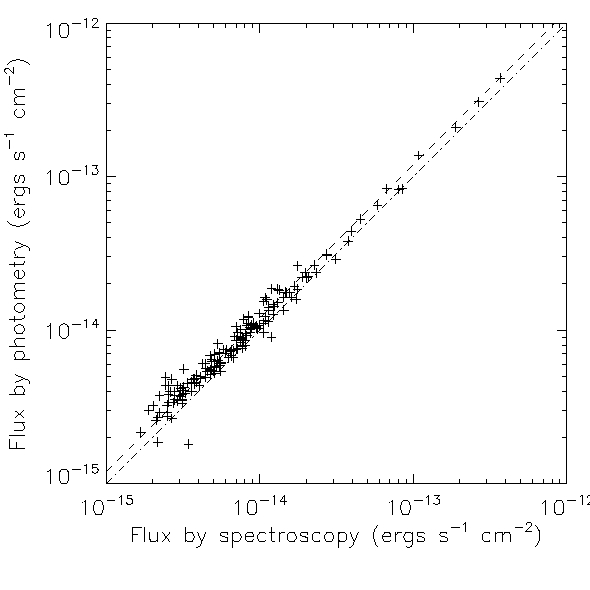
The X-ray flux can be derived by the spectral fits for most of the sources in Table 2. For the remaining sources, which are mostly faint, we estimated their X-ray flux using broad-band photometry: the mean energy times the net count rate divided by the mean effective area (Tsujimoto et al., 2005). The consistency between the two flux estimates was checked for the brightest 173 sources (Fig. 2), for which both values are available. They are overall in good agreement with a systematic offset (20%). We hereafter use the spectroscopic flux for the 173 bright sources and the photometric flux corrected for the offset for the remaining sources.
4.2. NIR Data
All SIRIUS frames were reduced following standard procedures using IRAF, including dark-current correction, sky subtraction, and flat-fielding. Dithered images were registered to construct combined images in the three bands (J, H, and Ks). Sources were extracted and their photometry was measured using the daofind and daophot tasks in IRAF.
In order to cope with source crowding in the SIRIUS images, we used the following procedure (Stetson, 1987). First, we constructed the average PSF from dozens of bright sources across each image. The profile of each extracted source was fitted with the average PSF and the source was masked from the image if the fit was successful. The procedure was repeated until most sources were masked. We then reconstructed the PSF from the masked image, which we consider is freer from contamination than the original one. By repeating the procedure, we separated closely spaced sources and deblended their overlapping signals.
We extracted 10,540 and 9,768 sources in RCW 49 and the control fields, respectively, at levels larger than 3 of the sky background noise in all three bands. We derived their positions and magnitudes in the J, H, and Ks bands in the longer-exposure images. We replaced magnitudes with those derived from the shorter-exposure images when they were saturated at levels brighter than 11.0 (J), 11.5 (H), and 12.0 (Ks) mag. The 3 detection limits of the longer-exposure images in the RCW 49 field are 20.5 (J), 19.8 (H), and 18.4 (Ks) mag, whereas the 10 limits are 19.0 (J), 17.8 (H), and 16.8 (Ks) mag. These limits were 0.5 mag shallower than those measured in the control field because of the larger source confusion. All the detected sources are used for the X-ray counterpart search, while only those with magnitude uncertainty less than 0.1 mag are used for photometric analysis.
4.3. Optical and Infrared Identifications of X-ray Sources
We identified the X-ray sources in the optical, NIR, and MIR bands using the Naval Observatory Merged Astrometric Dataset (NOMAD)333See http://www.nofs.navy.mil/nomad/ for details., the Two-Micron All-Sky Survey (2MASS; Skrutskie et al. 1997), SIRIUS, and GLIMPSE. GLIMPSE is a Legacy Program of the Spitzer Space Telescope to survey a 220 deg2 region of the Galactic Plane at four MIR bands ([3.6], [4.5], [5.8], and [8.0] m) with a 16–19 resolution using IRAC (Fazio et al., 2004). A 1707 region encompassing RCW 49 was mapped with ten 1.2 s exposures in the initial phase of the program (Churchwell et al., 2004).
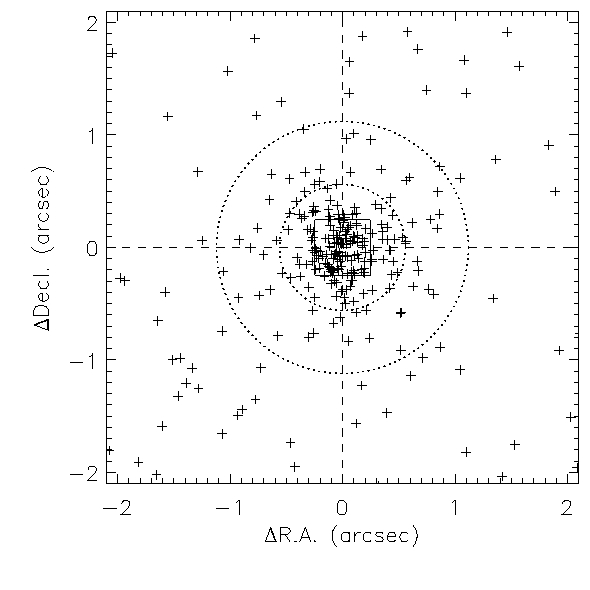
First, the ACIS image was shifted to match the absolute astrometry of 2MASS using the closest ACIS–2MASS pairs. The residual displacements of the pairs in the R. A. and decl. directions are plotted in Figure 3, in which the rms (1 ) of the displacements is 056 (Fig. 3; the inner dotted circle). We recognized 216 ACIS–2MASS pairs within 2 displacement (Fig. 3; the outer dotted circle) to be physical counterparts. We similarly found NOMAD, SIRIUS, and IRAC counterparts within 2 of ACIS sources after a correction of the systematic offset, where 1 is 063, 038, and 059, respectively. Consequently, 230, 299, and 156 ACIS sources were found to have NOMAD, SIRIUS, and IRAC counterparts. Both the numbers of false positives (unrelated pairs identified as counterparts) and false negatives (physical pairs unidentified as counterparts) are estimated to be 10.
The resultant identifications and the optical (R), NIR (J, H, and Ks), and MIR ([3.8], [4.5], [5.8], and [8.0]) photometry are summarized in Table 3. The R-band magnitude is from NOMAD, which is a compilation work of several catalogues. NIR magnitudes are either from 2MASS or SIRIUS, which is indicated by the NIR flag column.
In total, 379 of the 468 ACIS sources have either NOMAD, 2MASS, SIRIUS, or IRAC counterparts. Except for massive stars in and around Wd 2, almost all the X-ray sources are poorly studied in other wavelengths. Spectroscopic classifications are available for five sources outside of Wd 2 (Moffat et al., 1991; Rauw et al., 2007): HD 90273 (O 7), HD 302752 (A), MSP 91 (G0 V–III), MSP 158 (G0 III), and MSP 218 (A0 III), among which only HD 90273 was detected in X-rays. The identifications with sources in earlier work are also given in Table 3.
5. DISCUSSION
5.1. Early-type stars in Westerlund 2 and Beyond
Figure 4 shows a close-up view of Wd 2 in the SIRIUS and ACIS images. The Chandra observation of RCW 49 resolved X-ray sources in the central OB association. A dozen early-type stars from O7 to O3 are present in the cluster core ; MSP 151, 157, 167, 171, 175, 182, 183, 188, 199, 203, and 263 (Rauw et al., 2007). In addition, three early-type stars, an O4 V(f) or O5 V(f) star (MSP 18; Uzpen et al. 2005; Rauw et al. 2007) and two Wolf-Rayet stars (WR 20a MSP 240 and WR 20b), lie outside the cluster core.
We detected X-ray emission from all of these early-type sources. The identifications are given in Table 3. The results illustrate clearly that high-resolution X-ray imaging observations, even with a short exposure of 30–40 ks, are powerful enough to resolve and identify the crowded massive members in OB associations at a few kiloparsecs away, as was found by Wang et al. (2007a) in NGC 6357, Broos et al. (2007) in M 17, and similar studies.
5.2. Galactic & Extra-Galactic Contaminants
The population of X-ray sources detected in ACIS images of Galactic massive SFRs is a superposition of the young cluster members, field stars in the Galactic Plane, and extragalactic background. In order to examine how many X-ray sources toward RCW 49 are intrinsic to the cluster, we compare the RCW 49 population with that in a control field of the Galactic Plane (Ebisawa et al., 2005).
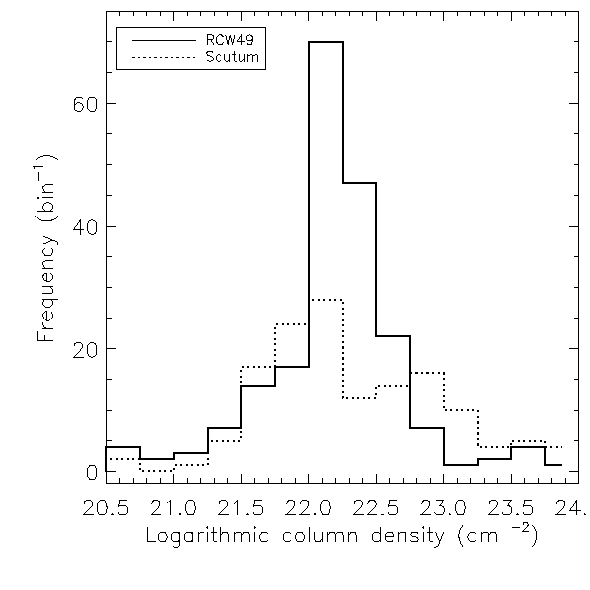
The control field, the “Scutum region” at (, ) (285, 00), is an ideal place for our comparison study. First, the region was covered by X-ray and NIR imaging studies with a sensitivity similar to RCW 49. Second, it does not harbor a young stellar cluster and the X-ray population there is a typical Galactic Plane population superposed on obscured extragalactic contaminants. Third, the extinction in the two regions is similar. The typical in RCW 49 is derived to be 1022–1022.5 cm-2 from Figure 5, which is consistent with the ROSAT (Belloni & Mereghetti, 1994) and NIR extinction (Ascenso et al., 2007) measurements. The Scutum region shows a bimodal distribution unlike RCW 49 (Fig. 5), but their median values are the same (1022.2 cm-2). In any case, the extinction correction is not very important in the hard X-ray band, where the opacity is less than one.
We use the radial profile of X-ray surface number density (SND) in RCW 49 to argue that a large fraction of our X-ray sources consists of the intrinsic RCW 49 population. First, the radial SND profile of all X-ray sources (Fig. 6a) shows a centrally peaked shape. The peak at R. A.10:24:01.6 and decl.–57:45:31, which was derived as the mean position of all X-ray sources, is consistent with the position of Wd 2. Second, the SND of RCW 49 has an overpopulation compared to the Scutum region (Fig. 6a; dotted histogram) out to 6′–7′. Within 5′ of the cluster center where we have SIRIUS coverage, the number of X-ray sources is 374 while the projected number of the Scutum region is 69, indicating that 82% of the X-ray sources are intrinsic to RCW 49.
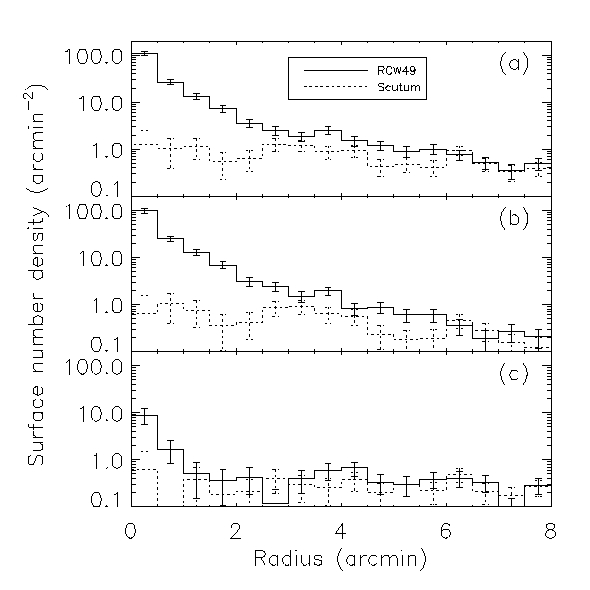
Our claim that the X-ray population suffers little contamination by non–cluster-members is more evident for those with stellar (optical, NIR, and MIR) identifications (Fig. 6b). We have 330 identified X-ray sources within 5′ of the Wd 2 center, while the projected number in the Scutum region is 47, which accounts only for 14% of the RCW 49 count.
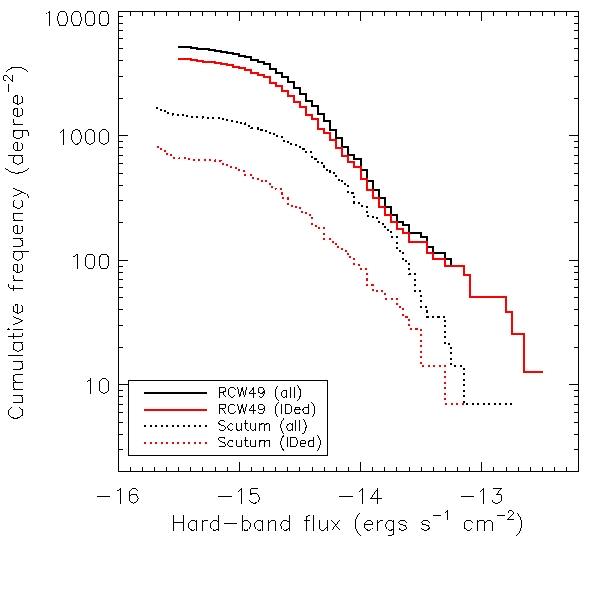
This overpopulation holds in the entire X-ray flux range of the Chandra study. In the comparison of the hard-band relations (Fig. 7), we find the total and identified X-ray populations of the RCW 49 region (thick histograms) are well above those of the Scutum region (broken histograms).
5.3. Distance Constraint from X-ray Data
The distance to RCW 49 is controversial despite intensive studies across many wavelengths (§ 2). In the present study, we obtained a rich X-ray sample and learned that most of the identified X-ray sources are intrinsic to RCW 49. It is therefore worthwhile to attempt to constrain the distance with the new X-ray data set.
We use a method proposed in Getman et al. (2007b) to constrain the distance based on X-ray data. In this method, a constraint comes from the dependence of X-ray luminosity on the mass of late-type pre–main-sequence sources. The relation between these two stellar quantities is established consistently in several young star clusters, including Cepheus B (Getman et al., 2006), the Orion Nebula Cluster (Getman et al., 2006, Table 6; Preibisch et al. 2005), the Taurus Molecular Cloud (Güdel et al., 2007), and CG 12 (Getman et al., 2007b). Note that the X-ray luminosity versus mass relation is not degenerate with respect to distance because pre–main-sequence X-ray luminosity and mass depend differently on the assumed distance.
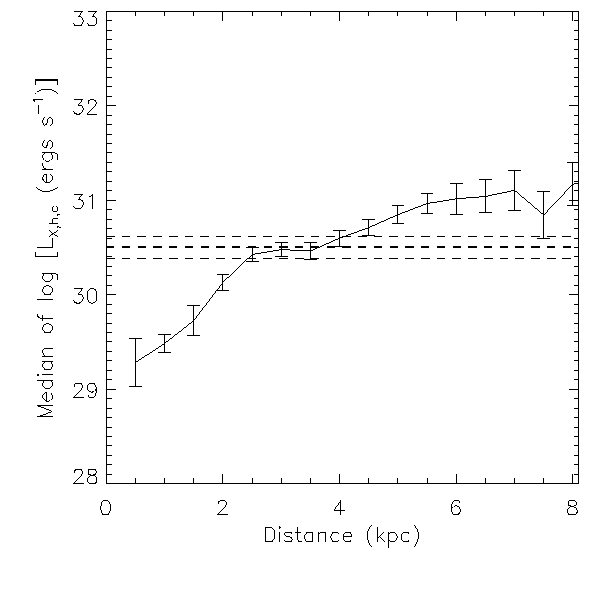
First, we estimate the stellar mass of X-ray sources, for which NIR photometry is available (Table 3). We construct a J/(J–H) color-magnitude diagram assuming various distances from 0.5 to 8 kpc and derive the mass by comparing the dereddened J-band magnitudes to the Siess et al. (2000) model. Then, we extract the X-ray sources with an estimated mass of 2.0–2.7 and derive the median value of their logarithmic hard-band absorption-corrected X-ray luminosity ( in Table 2) in order to minimize the extinction effect. The mass range is limited by the degeneracy in the mass estimate above 2.7 and by our X-ray sensitivity below 2.0 .
Figure 8 shows the median X-ray luminosity at each assumed distance, in which the estimated mean X-ray luminosity increases monotonically as the distance increases. We compare the median X-ray luminosity in the same mass range of the Orion Nebula Cluster (Getman et al., 2006), for which the distance is reliably measured. We found that the distance is constrained to be 2–5 kpc, which is consistent with the claim by (Ascenso et al., 2007) but not with (Rauw et al., 2007).
5.4. Nature of X-ray Cluster Population
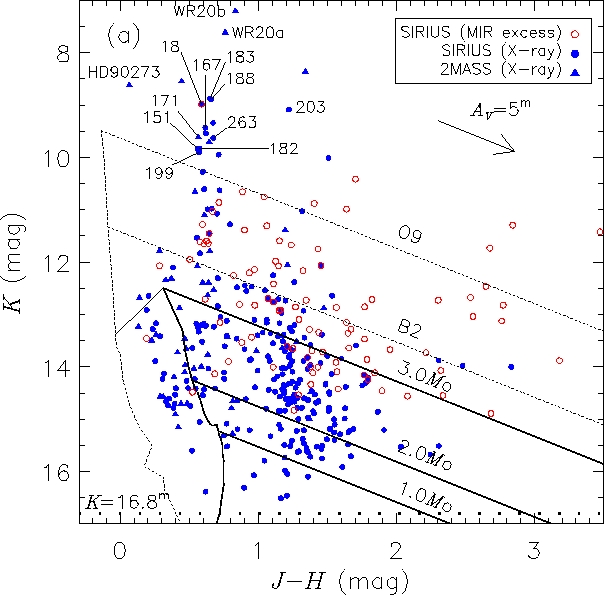
Sources of different natures have different X-ray and NIR brightness and colors. In massive SFRs, where the mass range of stellar constituents is wider than low-mass SFRs, the brightness is of prime importance for estimating the nature. We employ X-ray versus NIR brightness plots (Figs. 9a and 9b) to estimate the nature of X-ray cluster members of RCW 49, aided by the conventional NIR color-magnitude diagram (Fig. 11a).
Figure 9 (a) shows the observed Ks-band magnitude () versus hard-band X-ray flux () of all the X-ray sources with Ks-band identification. Figure 9 (b) is restricted to a sample with X-ray spectral fits, showing the extinction-corrected absolute Ks-band luminosity () versus hard-band X-ray luminosity (). The constant flux ratio lines between the Ks-band and the hard X-ray band (dotted-and-dashed lines in Figure 9a and b) are a proxy for the canonical X-ray versus bolometric luminosity, which is independent from our distance estimate.
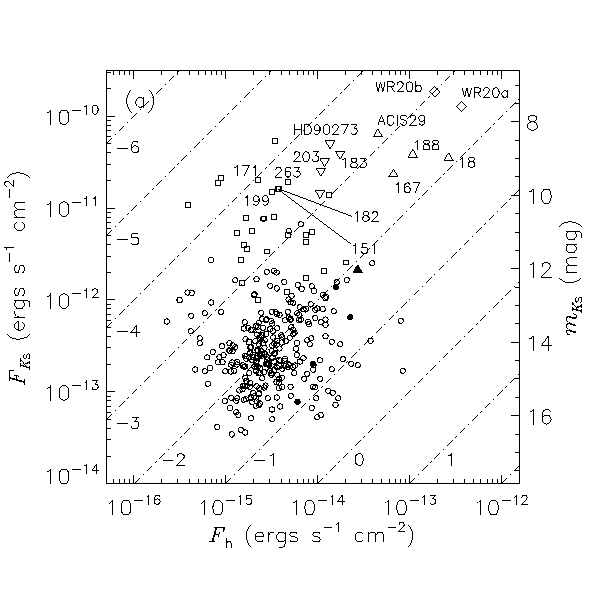
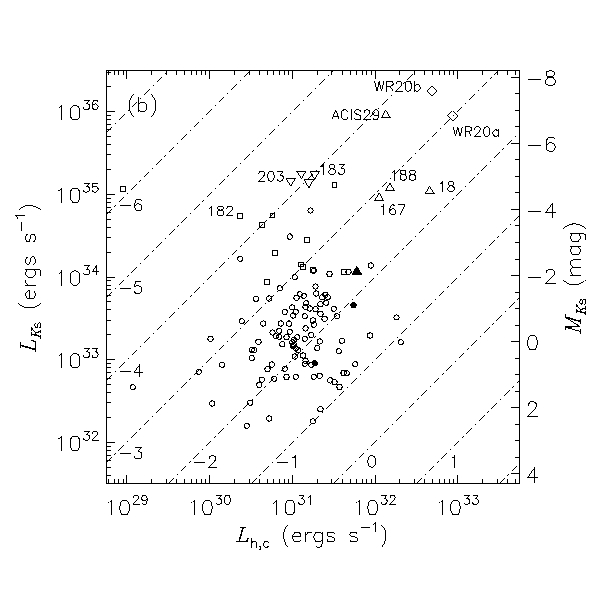
It is easily recognized that the sources form several groups in both plots. The most populous group centered at (, ) (, ) ergs s-1 cm-2 in Figure 9 (a) and (, ) (, ) ergs s-1 in Figure 9 (b) are 1.0–3.0 low-mass pre–main-sequence sources in RCW 49 for the following reasons. Their Ks-band brightness (13–16 mag) is consistent with the NIR brightness of pre–main-sequence sources in this mass range. Their hard-band X-ray luminosities 1030–1031.5 ergs s-1 and flaring are typical of this class of stars in near-by regions (e.g., Wolk et al. 2006; Getman et al. 2006). The ratio of X-ray to NIR brightness of 10-1–10-3 is consistent with the fractional X-ray to bolometric luminosity of 10-3–10-5 common among these sources. The Ks-band bolometric corrections for A0 V, F0 V, and G0 V stars are –3.75, –2.85, and –2.25 mag (Tokunaga, 2000; Drilling & Landolt, 2000).
A number of sources deviate in the upward and rightward directions of the primary group in Figure 9. Among them, two Wolf-Rayet stars occupy the top right end of all sources with (, ) (, ) ergs s-1 cm-2 in Figure 9 (a) and (, ) (, ) ergs s-1 in Figure 9 (b).
The sources in between the late-type pre–main-sequence and Wolf-Rayet star groups, both in X-ray and NIR brightness, are early-type main-sequence stars. They have a large dispersion in the horizontal direction in Figure 9, indicating that sources with a similar NIR brightness can differ significantly in hard X-ray brightness. We first extract early-type star candidates based on the NIR color-magnitude diagram (Fig. 10a). X-ray sources with dereddened K-band magnitude brighter than a B2 V star are considered to be early-type candidates and are labeled “ET” in Table 3. A total of 43 candidate stars include 13 spectroscopically-identified O-type stars from preceding studies (Moffat et al., 1991; Rauw et al., 2007). These early-type candidates are plotted by different symbols based on their X-ray spectral hardness.
The upward and downward triangle sources, which respectively indicate hard and soft X-ray emission by X-ray spectroscopy, occupy different regions naturally reflecting the fact that harder O stars are brighter in the hard X-ray band. The two groups appear to form two separate clustering in Figure 9 and have different X-ray to NIR brightness ratio. These suggests that they have different X-ray production mechanisms. Eight spectroscopically-identified sources (HD 90273, MSP 151, 171, 182, 183, 199, 203, and 263) are in the soft O-star group with /, while three (MSP 18, 167, and 188) are in the hard O-star group with /. Source number 29 (ACIS 29) may belong either to the hard O-star or Wolf-Rayet star group, but the nature of this source is unknown without any spectroscopic studies. We note that the source has infrared excess emission (Table 3) and is an off-cluster source at 45 away from the center, which is similar to WR 20a and MSP 18.
The soft O stars share common characteristics with traditional X-ray-emitting O stars (Berghoefer et al., 1997) for having soft and constant X-ray emission due to internal shocks in their stellar winds (Lucy & White, 1980). The hard O stars are among the growing class of new-type O stars with hot thermal emission (§ 5.7.2). The three hard O stars (MSP 18, 167, and 188) are bright enough for detailed X-ray spectroscopy, and we discuss them in § 5.7.2.
5.5. Spatial Distribution of X-ray Cluster Members
We can individually identify cluster members based on their X-ray identification with a low level of contamination. Unlike optical and infrared imaging, the X-ray detections are not affected by non-uniform and intense diffuse emission. These two features of X-ray imaging studies are particularly important outside of the cluster core, where the optical and NIR SNDs of cluster members fall to a comparable level to those of irrelevant sources. Using the X-ray SND profiles, we obtain a sensible estimate of the spatial scale and distribution of cluster members away from the cluster core.
In the X-ray SND profile (Fig. 6a), we see two interesting features. One is that the profile shows an overall decline, reaching the background level at 6′–7′. The X-ray declining profile is smoother and more extended than the NIR profile constructed from 2MASS (Ascenso et al., 2007, Fig. 6). We obtained a larger estimate of the cluster size by twice than the NIR estimate of 41 (Ascenso et al., 2007). Our estimated radius is 8 pc at the assumed distance, which is far larger than the Orion Nebula Cluster and somewhat larger than NGC 6357 (Wang et al., 2007a).
The other feature is a deviation from the monotonic trend at 4′. A similar excess can also be found in the identified and unidentified X-ray source profile (Figs. 6b and c). A 4′ radius partial ring around Wd 2 is the most conspicuous feature both in the radio and MIR images (Fig. 1a; Whiteoak & Uchida 1997; Churchwell et al. 2004), where gas and dust are compressed by winds and radiation from massive sources in the central OB association. The possible peak at 4′ in the X-ray profiles, although the significance is low, suggests that a second generation of triggered star formation is present in this ring. A deeper X-ray image would confirm this possibility and identify members of the triggered population.
We identified thirty new OB star candidates based on the NIR photometry of X-ray sources (§ 5.4). It is interesting to note that many of them are located outside of the cluster core. In addition to the three off-core early-type stars (WR 20a, 20b, and MSP 18 at 06, 37, 10 from the Wd 2 center, respectively; Fig. 1a) considered to be physically associated with RCW 49, we have 14 early-type candidates beyond 3 of the cluster center. One of them (HD 90273) is a spectroscopically-identified O star (Cannon & Pickering, 1919). This implies either that these are run-away O stars as suggested for MSP 18 (Uzpen et al., 2005) or that the cluster was formed without primordial mass segregation. We note that the OB stars in the Rosette Nebula Cluster similarly do not exhibit mass segregation (Wang et al., 2007b). Follow-up studies are mandatory to confirm the early-type nature of these off-core candidates and to understand the cause of their large spatial distribution.
5.6. Discrimination of Intrinsic Cluster Members
We detected 10,540 and 9,768 sources in the SIRIUS images on and off of the RCW 49 region (§ 3; hereafter called the object and the control fields). This indicates that the NIR sample is seriously contaminated by field stars. Individual cluster members, most of which are low-mass pre–main-sequence sources, are traditionally identified by infrared excess emission from their circumstellar disks and envelopes. MIR excess studies are more sensitive than NIR excess studies (Haisch et al., 2001). Whitney et al. (2004) identified 256 cluster members in the Chandra field from the MIR excess signature based on the MIR color-color diagrams using Spitzer/IRAC. However, the infrared excess is only sensitive to classical T Tauri stars and protostars with rich circumstellar matter. Weak-line T Tauri stars are usually missed. On the contrary, X-ray emission in the 1 keV band does not significantly depend on whether pre–main-sequence sources have disks or not (Feigelson et al., 2007). We now use the X-ray emission as a signature of cluster membership and examine how the Chandra data complement the Spitzer data.
For this purpose, we construct three Ks-band luminosity functions (KLFs). One is the intrinsic KLF of RCW 49 obtained by subtracting the KLF of the control field from that of the object field. The other two are the KLFs of SIRIUS sources with X-ray and MIR excess emission signatures. We examine what fraction of the first KLF is recovered by each and the combination of the latter two KLFs.
Figure 11 (a) shows the KLFs in the object and the control fields (solid and dashed histograms), while the difference of the two is plotted by a solid histogram in Figure 11 (b). Sources in the two fields have slightly different characteristic extinction, for which we compensate by shifting the object KLF brightward by 0.1 mag based on the following argument. The difference between the mean NIR colors in the object and control fields represents the difference in the extinction. In order to avoid the effect of excess emission seen among pre–main-sequence sources, we use only the (J–H) color of sources without any evidence of infrared excess. The mean (J–H) values in the object and control fields are 0.94 and 0.83 mag with 0.01 mag uncertainty. The difference can be converted to mag (Tokunaga, 2000; Benjamin et al., 2003).
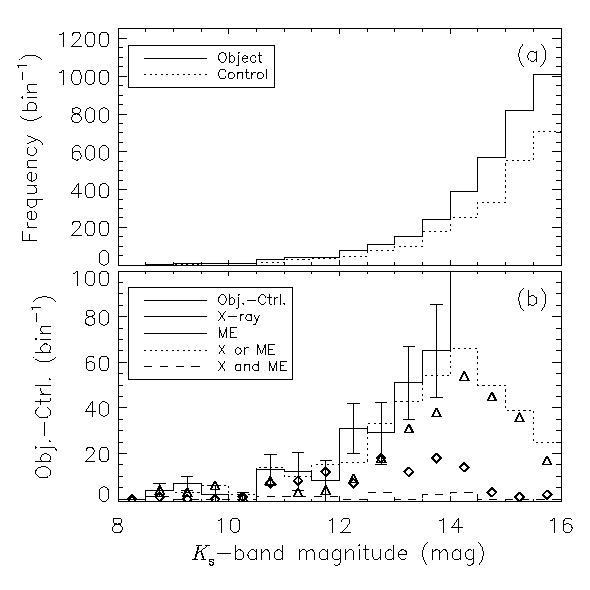
First, we compare the intrinsic KLF of RCW 49 with each of the KLFs of sources with X-ray and MIR excess emission, which are respectively shown with triangles and diamonds in Figure 11 (b). Each of the X-ray and MIR-excess KLFs represent part of the intrinsic KLF. The recovery rate drops at Ks 14 mag because the Chandra and Spitzer sensitivities do not match that of SIRIUS. Also, the Spitzer image suffers confusion in the most crowded part of the cluster. The recovery of cluster members by the X-ray KLF is also expected to drop in the magnitude range for late B and A type sources, because some of them are intrinsically X-ray faint unlike earlier and later type sources (Preibisch et al., 2005). These sources would appear at 12 mag at the assumed distance. The smaller X-ray recovery rate at 12.0–12.5 mag may be attributable to this effect (Fig. 11b).
We nonetheless do not attempt to correct statistically for these types of incompleteness because we are interested in how many of the intrinsic cluster members are individually identified by the current data set. The total counts of sources in the intrinsic KLF at K14.0 and 14.5 mag are 221 and 358. Respectively, 125 (57%) and 179 (50%) of them are recovered in the X-ray KLF, while 84 (38%) and 98 (27%) are in the MIR excess KLF. Each of the X-ray and MIR excess KLFs represent about 30–60% of the intrinsic RCW 49 KLF.
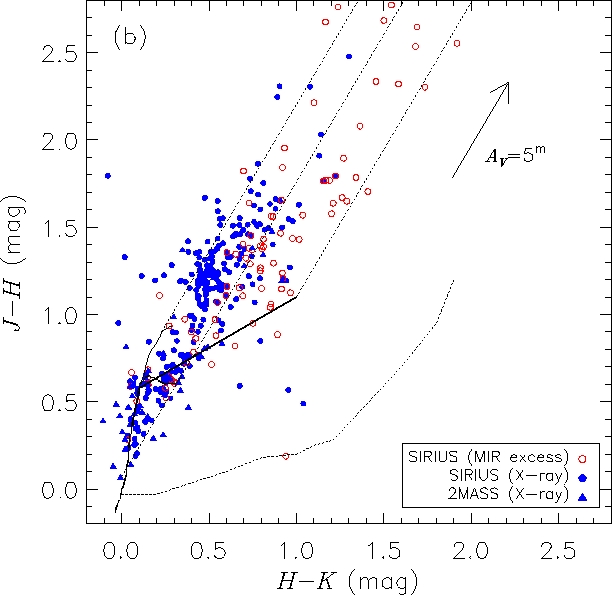
Second, we compare the intrinsic KLF with the combination of X-ray and MIR excess KLFs. The KLFs of the union and the intersection sets of X-ray and MIR excess sources are shown by dotted and dashed histograms in Figure 11 (b). The union set recovers 90% (200) and 74% (266) of the intrinsic cluster members at K14.0 and 14.5 mag, respectively. The intersection set is very small. These indicate that X-ray and MIR excess emission selections operate in a complementary fashion in identifying cluster members and that the combination of the two recovers a large fraction of the members. The complementarity probably comes from the fact that richer circumstellar matter around pre–main-sequence sources increases the MIR excess detection rate due to stronger emission and decreases the X-ray detection rate due to larger extinction. This is best examined in the NIR color-color diagram in Figure 10 (b). SIRIUS sources with X-ray and MIR excess signatures (blue and red dots) are segregated in the plot. The X-ray emission preferentially detects sources with no or smaller NIR excess.
5.7. X-ray Emission from Massive Stars
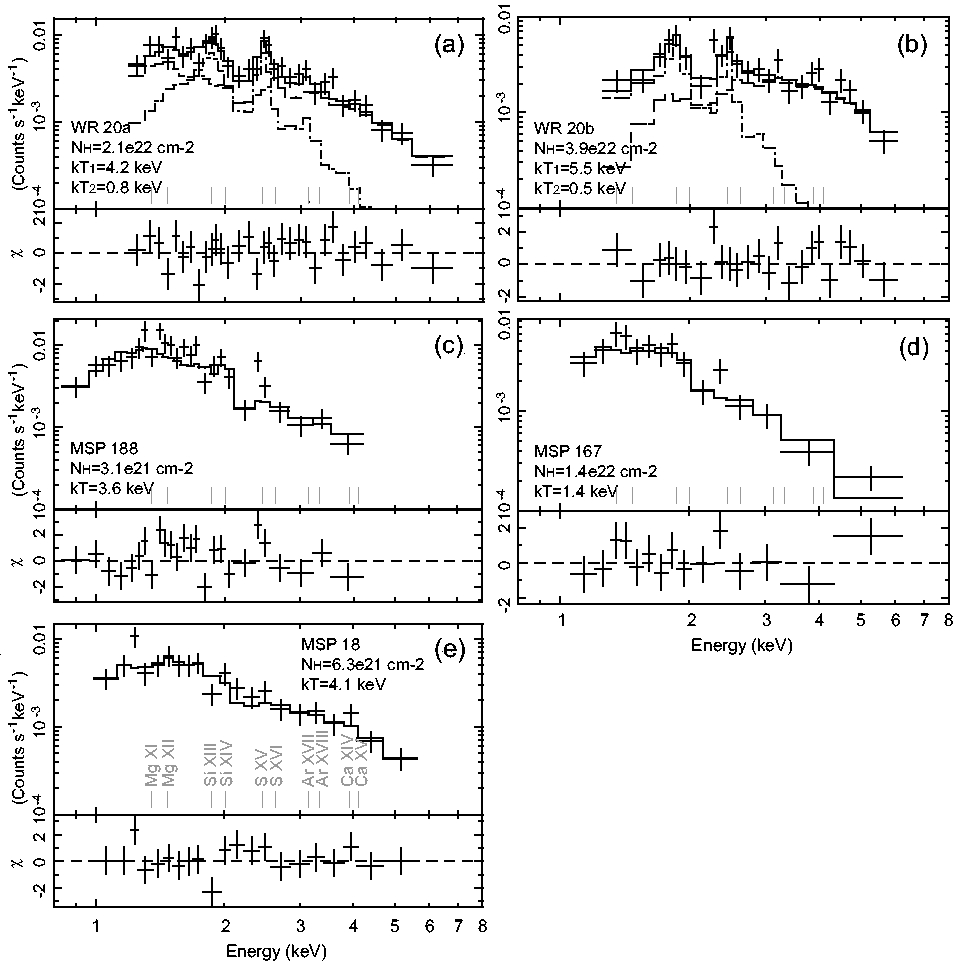
We present the results of detailed X-ray spectroscopy for five exceptionally bright X-ray sources with more than 200 counts. Two of them are Wolf-Rayet stars (WR 20a and 20b) and the rest are O-type stars (MSP 18, 167, and 188). All these sources are located at the top right end of X-ray and NIR brightness plots (Fig. 9).
5.7.1 Wolf-Rayet stars
The X-ray spectra of WR 20a and WR 20b are shown in Figure 12 (a) and (b), respectively. Both of them are characterized by emission lines from highly ionized ions such as Mg, Si, S, Ar, and Ca, and a hard tail up to 5 keV. The Si XIII K emission as well as the hard tail indicate that the emission is more likely from a plasma of multiple temperatures than from that of a uniform temperature. We present the results of a two-temperature plasma fit in Table 4. In the fitting, the abundances of conspicuous lines (Si and S) were thawed to obtain the best-fit values. The abundances of other elements were fixed to be 1 solar. It is known that hydrogen is heavily depleted in Wolf-Rayet stars (e.g., van der Hucht et al. 1986; Morris et al. 2000), but we used the cosmic abundance (Anders & Grevesse, 1989) as we do not know the level of hydrogen depletion for these stars. Once it is known, the abundance values presented here should be decreased accordingly.
WR 20a is an eclipsing binary of two Wolf-Rayet stars of spectral type WN6ha (Bonanos et al., 2004; Rauw et al., 2005). Using the best-fit orbital solution by Bonanos et al. (2004), the Chandra observation covers the orbital phase from 0.36 to 0.48. Because of the uncertainty in the orbital period determination of 3.686 0.01 days, the Chandra phase range has uncertainty from 0.18–0.30 to 0.55–0.67. We compare the X-ray light curves and the eclipsing optical light curve (Fig. 13) with the aim to obtain a hint in the X-ray production mechanism of this source. One artificial effect is introduced by the fact that the source was observed in a gap between ACIS I2 and I3. The source oscillated across the gap at a period of 1000 s due to the dithering motion of the telescope. About 60% of the photons were lost in the gap. We binned the light curves with a binning size of 1000 s to cancel this effect.
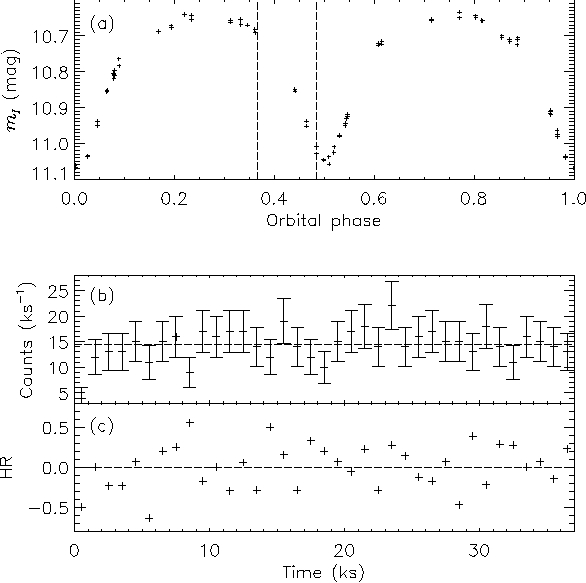
No apparent variation was found in either the average X-ray count rate (Fig. 13b) or the hardness ratio (Fig. 13c). In contrast, a clear decline is seen in the I-band magnitude (Fig. 13a) during the phase of about 0.3–0.7. The Chandra phase coverage is uncertain from 0.18–0.30 to 0.55–0.67. When its lower limit is adopted, the Chandra observation was conducted out of eclipses. When other values are adopted, it was conducted during an optical eclipse. In this case, the lack of the eclipse in the X-ray light curves indicates that the X-ray emitting region is far enough from the stellar surface so as not affected by the photospheric eclipsing. From the orbital solution by Bonanos et al. (2004), the radii of the two stars are 19 and is 53, where is the semi-major axis of the orbit, 74.5∘ is the inclination angle, and is the radius of the Sun. The system is observed close to the edge-on in the line of sight. At the middle of the eclipse, the two stars are separated by . Therefore, the X-ray emitting region is extended to at least a few stellar radii.
5.7.2 O-type Stars
At least two out of three bright O stars show emission line features of highly ionized Mg, Si and S, indicating their thermal plasma origin. We fit all three spectra with a thin-thermal plasma model with variable abundance of elements with conspicuous features. Table 4 gives the results. All of them are characterized by a hard spectrum with the best-fit plasma temperature of 1.5 keV and luminous X-ray brightness of 2–81032 ergs s-1.
Such hard and luminous X-ray-emitting O stars have been reported in some other massive SFRs (Albacete Colombo et al., 2003; Rho et al., 2004; Skinner et al., 2005; Broos et al., 2007; Wolk et al., 2006). The X-ray properties of these sources are quite different from the classical view of main-sequence O-type stars characterized by soft thermal spectra of 1 keV and the X-ray to bolometric luminosity ratio of 10-7 (Berghoefer et al., 1997). Hard X-ray–emitting O stars in massive SFRs should be a new distinct class of X-ray sources with a different X-ray production mechanism.
Several interpretations have been proposed for such hard X-ray emission from O stars. One is magnetically-confined wind shocks (Babel & Montmerle, 1997; Schulz et al., 2003; Gagné et al., 2005; Stelzer et al., 2005), where magnetized winds produce hard X-ray emission in large-scale shocks near the stellar surface. Another is similar to the X-ray emission in WR binaries; i. e., winds from each component of a close binary of two O-type stars collide with each other to make hard X-rays (Zhekov & Skinner, 2000; Skinner et al., 2007). The hard X-rays might be from the magnetic reconnections between the two binary components (Schulz et al., 2006). The binary nature of the three O-type stars in RCW 49 is not confirmed yet, but these sources might be “X-ray-spectroscopic binaries” if this interpretation is correct. Yet another idea is that inverse Compton emission of UV photons from these O stars accounts for their hard spectra (Albacete Colombo et al., 2003). The X-ray production mechanism of such curious O stars is not yet certain, but enriching the sample using plots like Figure 9 may lead to a better understanding of the mechanism.
6. Summary
We observed the Galactic massive star-forming region RCW 49 and its central OB association Westerlund 2 using Chandra/ACIS, IRSF/SIRIUS, and Spitzer/IRAC. The main results are summarized as follows.
-
1.
468 X-ray sources were detected in a 40 ks ACIS exposure covering a 17′17′ field. Previous X-ray studies detected less than 10 sources in the studied field and almost all the X-ray sources reported here are new detections. The results of X-ray photometric, timing, and spectroscopic analyses are presented and summarized in Tables 1 and 2.
-
2.
We obtained SIRIUS images in the J, H, and Ks bands of a concentric 8383 field and extracted 10,540 sources at a 10 detection limits of 19.0 (J), 17.8 (H), and 16.8 (Ks) mag.
-
3.
379 X-ray sources were identified with optical, NIR, and MIR counterparts using NOMAD, 2MASS, SIRIUS, and GLIMPSE data. The results are given in Table 3.
-
4.
The central OB association Westerlund 2 was resolved in the X-ray image for the first time. X-ray emission was detected from all of the spectroscopically-identified early-type stars consisting of two Wolf Rayet stars and a dozen O type stars.
-
5.
About 86% of the X-ray sources with optical or infrared identifications were found to be cluster members by comparing with the X-ray population in a control field in the Galactic Plane. The X-ray overpopulation against the control field is seen in all measured flux ranges.
-
6.
We compared the intrinsic K-band luminosity function of NIR sources in RCW 49 with the KLFs of sources with X-ray or MIR excess identification. We found that 30–60% of the cluster members at Ks14 mag are individually identified using the two observational signatures of cluster membership. When X-ray and MIR excess signatures are combined, about 90% of cluster sources are individually located. The two indicators of the cluster membership work in a complementary fashion, in which the former excels in detecting weak-line T Tauri stars with smaller attenuation while the latter predominantly detects classical T Tauri stars or protostars with richer circumstellar matter.
-
7.
A loose constraint on the distance to RCW 49 was derived to be 2–5 kpc based on the mean hard-band X-ray luminosity of T Tauri stars in the mass range of 2.0–2.7 .
-
8.
The cluster X-ray population consists of low-mass pre–main-sequence sources and early-type sources based on X-ray and NIR photometry. Late-type pre–main-sequence sources, Wolf-Rayet stars, and early-type main sequence stars occupy different regions of X-ray versus NIR brightness plots. Thirty new OB candidates were identified based on the NIR color-magnitude diagram, several times more than the number of optically-identified OB stars.
-
9.
Using the X-ray surface number density radial profiles, we gave an estimate of the cluster radius to be 6′–7′, or 8 pc at the assumed distance. A possible excess is seen at 4′ of the center, suggesting that secondary star formation is taking place at the ring. Fourteen OB star candidates are found outside of Wd 2, suggesting an absence of mass segregation.
-
10.
Detailed X-ray spectroscopy of the two Wolf-Rayet stars was presented. Both sources show two-temperature thermal plasmas with characteristic temperatures of 0.5–1.0 and 4–6 keV and 1–8 keV luminosities of 21033 ergs s-1. No X-ray flux or hardness variation was found from WR 20a, an eclipsing binary, suggesting that the X-ray emission arises far from stellar surfaces.
-
11.
Detailed X-ray spectroscopy of three luminous O-type stars were presented. They are characterized by thermal spectra with a temperature of 1.5 keV. These are among the growing samples of hard X-ray emitting O stars recently found in some massive star-forming regions. Early-type stars appears to have two sub groups, hard and soft, based on the X-ray spectroscopy.
References
- Ascenso et al. (2007) Ascenso, J., Alves, J., Beletsky, Y., & Lago, M. T. V. T. 2007, A&A, in press
- Aharonian et al. (2007) Aharonian, F. et al 2007, A&A, in press
- Albacete Colombo et al. (2003) Albacete Colombo, J. F., Méndez, M., & Morrell, N. I. 2003, MNRAS, 346, 704
- Albacete Colombo et al. (2007) Albacete Colombo, J. F., Flaccomio, E., Micela, G., Sciortino, S., & Damiani, F. 2007, A&A, 464, 211
- Anders & Grevesse (1989) Anders, E., & Grevesse, N. 1989, Geochim. Cosmochim. Acta, 53, 197
- Babel & Montmerle (1997) Babel, J., & Montmerle, T. 1997, ApJ, 485, L29
- Baraffe et al. (1998) Baraffe, I., Chabrier, G., Allard, F., & Hauschildt, P. H. 1998, A&A, 337, 403
- Bauer et al. (2004) Bauer, F. E., et al. 2004, Advances in Space Research, 34, 2555
- Belloni & Mereghetti (1994) Belloni, T. & Mereghetti, S. 1994, A&A, 286, 935
- Benjamin et al. (2003) Benjamin, R. A., et al. 2003, PASP, 115, 953
- Berghoefer et al. (1997) Berghoefer, T. W., Schmitt, J. H. M. M., Danner, R., & Cassinelli, J. P. 1997, A&A, 322, 167
- Bonanos et al. (2004) Bonanos, A. Z., et al. 2004, ApJ, 611, L33
- Broos et al. (2007) Broos, P. S., Feigelson, E. D., Townsley, L. K., Getman, K. V., Wang, J., Garmire, G. P., Jiang, Z., & Tsuboi, Y. 2007, ApJ, in press
- Cannon & Pickering (1919) Cannon, A. J., & Pickering, E. C. 1919, Annals of Harvard College Observatory, 94, 1
- Carpenter (2001) Carpenter, J. M. 2001, AJ, 121, 2851
- Carraro & Munari (2004) Carraro, G. & Munari, U. 2004, MNRAS, 347, 625
- Churchwell (2002) Churchwell, E. 2002, ARA&A, 40, 27
- Churchwell et al. (2004) Churchwell, E., et al. 2004, ApJS, 154, 322
- Damiani et al. (2004) Damiani, F., Flaccomio, E., Micela, G., Sciortino, S., Harnden, F. R., Jr., & Murray, S. S. 2004, ApJ, 608, 781
- Delgado et al. (2006) Delgado, A. J., González-Martín, O., Alfaro, E. J., & Yun, J. 2006, ApJ, 646, 269
- Dreyer (1888) Dreyer, J. L. E. 1888, MmRAS, 49, 1
- Drilling & Landolt (2000) Drilling, J. S. & Landolt, A. U. 2000, in Allen’s Astrophysical Quantities, ed. A. N. Cox (New York: Springer-Verlag), 381
- Ebisawa et al. (2005) Ebisawa, K., et al. 2005, ApJ, 635, 214
- Evans et al. (2003) Evans, N. R., Seward, F. D., Krauss, M. I., Isobe, T., Nichols, J., Schlegel, E. M., & Wolk, S. J. 2003, ApJ, 589, 509
- Evans et al. (2004) Evans, N. R., Schlegel, E. M., Waldron, W. L., Seward, F. D., Krauss, M. I., Nichols, J., & Wolk, S. J. 2004, ApJ, 612, 1065
- Fazio et al. (2004) Fazio, G. G., et al. 2004, ApJS, 154, 10
- Feigelson et al. (2005) Feigelson, E. D., et al. 2005, ApJS, 160, 379
- Feigelson et al. (2007) Feigelson, E., Townsley, L., Güdel, M., & Stassun, K. 2007, Protostars and Planets V, 313, ed. B. Reipurth, D. Jewitt, & K. Keil (Tuscon, Univ of Arizona Press), 313
- Flaccomio et al. (2006) Flaccomio, E., Micela, G., & Sciortino, S. 2006, A&A, 455, 903
- Garmire et al. (2003) Garmire, G. P., Bautz, M. W., Ford, P. G., Nousek, J. A., & Ricker, G. R. 2003, Proc. SPIE, 4851, 28
- Gagné et al. (2005) Gagné, M., Oksala, M. E., Cohen, D. H., Tonnesen, S. K., ud-Doula, A., Owocki, S. P., Townsend, R. H. D., & MacFarlane, J. J. 2005, ApJ, 628, 986
- Gehrels (1986) Gehrels, N. 1986, ApJ, 303, 336
- Getman et al. (2005) Getman, K. V., et al. 2005, ApJS, 160, 319
- Getman et al. (2006) Getman, K. V., Feigelson, E. D., Townsley, L., Broos, P., Garmire, G., & Tsujimoto, M. 2006, ApJS, 163, 306
- Getman et al. (2007a) Getman, K. V., Feigelson, E. D., Garmire, G., Broos, P., & Wang, J. 2007, ApJ, 654, 316
- Getman et al. (2007b) Getman, K. V., et al. in prep.
- Giardino et al. (2004) Giardino, G., Favata, F., & Micela, G. 2004, A&A, 424, 965
- Goldwurm et al. (1987) Goldwurm, A., Caraveo, P. A., & Bignami, G. F. 1987, ApJ, 322, 349
- Güdel et al. (2007) Güdel, M., et al. 2007, A&A, in press
- Gum (1955) Gum, C. S. 1955, MmRAS, 67, 155
- Haisch et al. (2001) Haisch, K. E., Lada, E. A., Piña, R. K., Telesco, C. M., & Lada, C. J. 2001, AJ, 121, 1512
- Hofner et al. (2002) Hofner, P., Delgado, H., Whitney, B., Churchwell, E., & Linz, H. 2002, ApJ, 579, L95
- Homeier & Alves (2005) Homeier, N. L., & Alves, J. 2005, A&A, 430, 481
- Hong et al. (2004) Hong, J., Schlegel, E. M., & Grindlay, J. E. 2004, ApJ, 614, 508
- Kesteven (1968) Kesteven, M. J. L. 1968, Australian Journal of Physics, 21, 369
- Lada & Adams (1992) Lada, C. J., & Adams, F. C. 1992, ApJ, 393, 278
- Linsky et al. (2007) Linsky, J. L., Gagné, M., Mytyk, A., McCaughrean, M., & Andersen, M. 2007, ApJ, 654, 347
- Lucy (1974) Lucy, L. B. 1974, AJ, 79, 745
- Lucy & White (1980) Lucy, L. B., & White, R. 1980, ApJ, 241, 300
- Meyer, Calvet, & Hillenbrand (1997) Meyer, M. R., Calvet, N., & Hillenbrand, L. A. 1997, AJ, 114, 288
- Moffat & Vogt (1975) Moffat, A. F. J., & Vogt, N. 1975, A&AS, 20, 125
- Moffat et al. (1991) Moffat, A. F. J., Shara, M. M., & Potter, M. 1991, AJ, 102, 642
- Moffat et al. (2002) Moffat, A. F. J., et al. 2002, ApJ, 573, 191
- Morris et al. (2000) Morris, P. W., van der Hucht, K. A., Crowther, P. A., Hillier, D. J., Dessart, L., Williams, P. M., & Willis, A. J. 2000, A&A, 353, 624
- Muno et al. (2006) Muno, M. P., et al. 2006, ApJ, 636, L41
- Nagayama et al. (2003) Nagayama, T., et al. 2003, Proc. SPIE, 4841, 459
- Nakajima et al. (2005) Nakajima, Y., et al. 2005, AJ, 129, 776
- Piatti et al. (1998) Piatti, A. E., Bica, E., & Claria, J. J. 1998, A&AS, 127, 423
- Preibisch et al. (2005) Preibisch, T., et al. 2005, ApJS, 160, 401
- Rauw et al. (2005) Rauw, G., et al. 2005, A&A, 432, 985
- Rauw et al. (2007) Rauw, G., Manfroid, J., Gosset, E., Nazé, Y., Sana, H., De Becker, M., Foellmi, C., & Moffat, A. F. J. 2007, A&A, 463, 981
- Rho et al. (2004) Rho, J., Ramírez, S. V., Corcoran, M. F., Hamaguchi, K., & Lefloch, B. 2004, ApJ, 607, 904
- Rogers et al. (1960) Rodgers, A. W., Campbell, C. T., & Whiteoak, J. B. 1960, MNRAS, 121, 103
- Sanchawala et al. (2007) Sanchawala, K., Chen, W.-P., Lee, H.-T., Chu, Y.-H., Nakajima, Y., Tamura, M., Baba, D., & Sato, S. 2007, ApJ, 656, 462
- Schulz et al. (2003) Schulz, N. S., Canizares, C., Huenemoerder, D., & Tibbets, K. 2003, ApJ, 595, 365
- Schulz et al. (2006) Schulz, N. S., Testa, P., Huenemoerder, D. P., Ishibashi, K., & Canizares, C. R. 2006, ApJ, 653, 636
- Seward et al. (1979) Seward, F. D., Forman, W. R., Giacconi, R., Griffiths, R. E., Harnden, F. R., Jr., Jones, C., & Pye, J. P. 1979, ApJ, 234, L55
- Shara et al. (1991) Shara, M. M., Smith, L. F., Potter, M., & Moffat, A. F. J. 1991, AJ, 102, 716
- Siess et al. (2000) Siess, L., Dufour, E., & Forestini, M. 2000, A&A, 358, 593
- Skinner et al. (2003) Skinner, S., Gagné, M., & Belzer, E. 2003, ApJ, 598, 37 5
- Skinner et al. (2005) Skinner, S. L., Zhekov, S. A., Palla, F., & Barbosa, C. L. D. R. 2005, MNRAS, 361, 191
- Skinner et al. (2006) Skinner, S. L., Simmons, A. E., Zhekov, S. A., Teodoro, M., Damineli, A., & Palla, F. 2006, ApJ, 639, L35
- Skinner et al. (2007) Skinner, S. L., Simmons, A. E., Audard, M., & Guedel, M. 2007, ApJ, in press
- Skrutskie et al. (1997) Skrutskie, M. F., et al. 1997, ASSL Vol. 210: The Impact of Large Scale Near-IR Sky Surveys, 25
- Smith et al. (2001) Smith, R. K., Brickhouse, N. S., Liedahl, D. A., & Raymond, J. C. 2001, ApJ, 556, L91
- Stelzer et al. (2005) Stelzer, B., Flaccomio, E., Montmerle, T., Micela, G., Sciortino, S., Favata, F., Preibisch, T., & Feigelson, E. D. 2005, ApJS, 160, 557
- Stetson (1987) Stetson, P. B. 1987, PASP, 99, 191
- Tokunaga (2000) Tokunaga, A. T. 2000, in Allen’s Astrophysical Quantities, ed. A. N. Cox (4th ed.; New York: Springer), 143
- Townsley et al. (2002) Townsley, L. K., Broos, P. S., Nousek, J. A., & Garmire, G. P. 2002, Nuclear Instruments and Methods in Physics Research A, 486, 751
- Townsley et al. (2003) Townsley, L. K., Feigelson, E. D., Montmerle, T., Broos, P. S., Chu, Y.-H., & Garmire, G. P. 2003, ApJ, 593, 874
- Townsley et al. (2004) Townsley, L. K., Feigelson, E. D, Montmerle, T., Broos, P. S, Chu, Y.-H., Garmire, G. P., & Getman, K. V. 2004, Proc. X-Ray and Radio Connections (astro-ph/0406349)
- Townsley et al. (2006a) Townsley, L. K., Broos, P. S., Feigelson, E. D., Garmire, G. P., & Getman, K. V. 2006, AJ, 131, 2164
- Townsley (2006b) Townsley, L. K. 2006, Proc. Massive Stars: From Pop III and GRBs to the Milky Way (astro-ph/0608173)
- Tsujimoto et al. (2005) Tsujimoto, M., Kobayashi, N., & Tsuboi, Y. 2005, AJ, 130, 2212
- Tsunemi et al. (2001) Tsunemi, H., Mori, K., Miyata, E., Baluta, C., Burrows, D. N., Garmire, G. P., & Chartas, G. 2001, ApJ, 554, 496
- Uzpen et al. (2005) Uzpen, B., et al. 2005, ApJ, 629, 512
- van der Hucht et al. (1986) van der Hucht, K. A., Cassinelli, J. P., & Williams, P. M. 1986, A&A, 168, 111
- van der Hucht (2001) van der Hucht, K. A. 2001, New Astronomy Review, 45, 135
- Wang et al. (2006) Wang, Q. D., Dong, H., & Lang, C. 2006, MNRAS, 371, 38
- Wang et al. (2007a) Wang, J., Townsley, L. K., Feigelson, E. D., Getman, K. V., Broos, P. S., Garmire, G. P., & Tsujimoto, M. 2007, ApJS, 168, 100
- Wang et al. (2007b) Wang, J., et al. in prep.
- Weisskopf et al. (2002) Weisskopf, M. C., Brinkman, B., Canizares, C., Garmire, G., Murray, S., & Van Speybroeck, L. P. 2002, PASP, 114, 1
- Werner et al. (2004) Werner, M. W., et al. 2004, ApJS, 154, 1
- Westerlund (1960) Westerlund, B. 1960, Arkiv for Astronomi, 2, 419
- Whiteoak & Uchida (1997) Whiteoak, J. B. Z., & Uchida, K. I. 1997, A&A, 317, 563
- Whitney et al. (2004) Whitney, B. A., et al. 2004, ApJS, 154, 315
- Wolk et al. (2006) Wolk, S. J., Spitzbart, B. D., Bourke, T. L., & Alves, J. 2006, AJ, 132, 1100
- Zhekov & Skinner (2000) Zhekov, S. A., & Skinner, S. L. 2000, ApJ, 538, 808
| Source | Position | Extracted Counts | Characteristics | |||||||||||||||||
|---|---|---|---|---|---|---|---|---|---|---|---|---|---|---|---|---|---|---|---|---|
| Seq | CXOU J | Err | PSF | PS | Anom | Var | EffExp | Photo | ||||||||||||
| # | (deg) | (deg) | (″) | (′) | Frac | (ks) | (keV) | (ergs s cm-2) | ||||||||||||
| (1) | (2) | (3) | (4) | (5) | (6) | (7) | (8) | (9) | (10) | (11) | (12) | (13) | (14) | (15) | (16) | (17) | (18) | |||
| 1 | 102257.09574403.0 | 155.73789 | 57.73418 | 1.2 | 8.6 | 7.8 | 4.2 | 5.2 | 0.0 | 0.89 | 1.6 | 2.5 | …. | a | 20.7 | 1.0 | 2.8e16 | |||
| 2 | 102259.75574157.1 | 155.74899 | 57.69922 | 0.7 | 8.8 | 28.8 | 6.3 | 4.2 | 0.0 | 0.90 | 4.2 | 5 | …. | a | 20.1 | 0.9 | 4.3e15 | |||
| 3 | 102300.48574226.1 | 155.75202 | 57.70726 | 0.5 | 8.5 | 53.3 | 8.1 | 3.7 | 2.7 | 0.90 | 6.2 | 5 | …. | a | 20.9 | 1.0 | 9.9e15 | |||
| 4 | 102300.49574307.5 | 155.75208 | 57.71875 | 1.1 | 8.3 | 7.9 | 3.9 | 3.1 | 0.0 | 0.90 | 1.8 | 3.4 | …. | a | 19.9 | 1.2 | 1.6e15 | |||
| 5 | 102302.84574606.9 | 155.76185 | 57.76859 | 0.3 | 7.7 | 110.4 | 11.4 | 8.6 | 73.7 | 0.90 | 9.2 | 5 | …. | a | 21.2 | 2.8 | 5.4e14 | |||
| 6 | 102305.27574150.6 | 155.77196 | 57.69741 | 0.9 | 8.1 | 9.1 | 4.0 | 2.9 | 8.0 | 0.89 | 2.0 | 4.2 | …. | a | 20.5 | 3.0 | 5.4e15 | |||
| 7 | 102306.68574353.2 | 155.77787 | 57.73145 | 0.3 | 7.3 | 77.1 | 9.4 | 1.9 | 8.8 | 0.89 | 7.8 | 5 | …. | c | 21.5 | 1.1 | 1.6e14 | |||
| 8 | 102308.67574631.2 | 155.78616 | 57.77535 | 0.7 | 7.0 | 10.5 | 4.1 | 2.5 | 0.4 | 0.90 | 2.2 | 5 | g… | 19.7 | 1.2 | 2.4e15 | ||||
| 9 | 102309.23574620.4 | 155.78848 | 57.77235 | 0.9 | 6.9 | 6.8 | 3.5 | 2.2 | 0.0 | 0.90 | 1.6 | 3.3 | g… | 19.8 | 0.9 | 3.8e16 | ||||
| 10 | 102309.82574942.2 | 155.79096 | 57.82841 | 0.5 | 8.1 | 35.5 | 6.7 | 2.5 | 20.3 | 0.90 | 4.9 | 5 | …. | b | 18.6 | 2.2 | 1.5e14 | |||
Note. — Column 1: X-ray catalog sequence number, sorted by R. A. Column 2: IAU designation. Columns 3, 4: R. A. and decl. for the equinox J2000.0. Column 5: Estimated standard deviation of the random component of the position error, . The single-axis position errors, and , are estimated from the single-axis standard deviations of the PSF inside the extraction region and the number of counts extracted. Column 6: Off-axis angle. Columns 7, 8: Estimated net counts extracted in the total energy band (0.5–8 keV); average of the upper and lower 1 errors on column 7. Column 9: Background counts scaled to the source extraction area (total band). Column 10: Estimated net counts extracted in the hard energy band (2–8 keV). Column 11: Fraction of the PSF (at 1.497 keV) enclosed within the extraction region. A reduced PSF fraction (significantly below 90%) may indicate that the source is in a crowded region. Column 12: Photometric significance. Column 13: Logarithmic probability that extracted counts (total band) are solely from background. Column 14: Source anomalies: g = fractional time that source was on a detector (FRACEXPO from mkarf) is ; e = source on field edge; p = source piled up; s = source on readout streak. Column 15: Variability characterization based on K-S statistic (total band): a = no evidence for variability (); b = possibly variable (); c = definitely variable (). No value is reported for sources in chip gaps or on field edges. Column 16: Effective exposure time: approximate time the source would have to be observed on-axis to obtain the reported number of counts. Column 17: Background-corrected median photon energy (total band). Column 18: Photometric flux estimate in the 0.5–8.0 keV band. See discussion in § 4.1.3.
Note. — Table 1 is published in its entirety in the electronic edition of the Astrophysical Journal. A portion is shown here for guidance regarding its form and content.
| Sourceaa For convenience, columns 1–4 reproduce the source identification, net counts, and photometric significance data from Table 1. | Spectral FitbbSources with photometric significance of larger than 2 were fit with an absorbed thin-thermal plasma model. The abundance is fixed to be 0.3 times solar value. Columns 5 and 6 present the best-fit values for the extinction column density and plasma temperature parameters. Column 7 presents the emission measure for the model spectrum, assuming a distance of 4.2 kpc. Uncertainties represent 90% confidence intervals. More significant digits are used for uncertainties in order to avoid large rounding errors; for consistency, the same number of significant digits is used for both lower and upper uncertainties. Uncertainties are missing when XSPEC was unable to compute them or when their values were so large that the parameter is effectively unconstrained. Fits lacking uncertainties, fits with large uncertainties, and fits with frozen parameters should be viewed merely as splines to the data to obtain rough estimates of luminosities; the listed parameter values are unreliable. | X-ray LuminositiesccX-ray luminosities are presented in columns 8–12: s = soft band (0.5–2 keV); h = hard band (2–8 keV); t = total band (0.5–8 keV). Absorption-corrected luminosities are subscripted with a “c”; they are omitted when since the soft band emission is essentially unmeasurable. Luminosities are derived assuming a distance of 4.2 kpc. | |||||||||||
|---|---|---|---|---|---|---|---|---|---|---|---|---|---|
| Seq | CXOU J | PS | |||||||||||
| # | (cm-2) | (keV) | (cm-3) | (ergs s-1) | |||||||||
| (1) | (2) | (3) | (4) | (5) | (6) | (7) | (8) | (9) | (10) | (11) | (12) | ||
| 5 | 102302.84574606.9 | 110.4 | 9.2 | 22.3 | 4.3 | 55.3 | 31.07 | 32.04 | 32.13 | 32.09 | 32.39 | ||
| 29 | 102328.78574629.3 | 106.5 | 9.4 | 22.5 | 1.6 | 55.7 | 31.10 | 31.92 | 32.13 | 31.98 | 32.68 | ||
| 68 | 102347.43574755.8 | 157.7 | 11.6 | 22.2 | 7.4 | 55.3 | 31.18 | 32.19 | 32.26 | 32.23 | 32.46 | ||
| 132 | 102358.01574548.8 | 532.6 | 22.1 | 22.3 | 1.9 | 56.4 | 32.12 | 32.80 | 32.94 | 32.89 | 33.39 | ||
| 192 | 102401.19574531.0 | 451.9 | 20.3 | 21.8 | 2.0 | 55.7 | 31.96 | 32.14 | 32.18 | 32.36 | 32.62 | ||
| 217 | 102402.06574527.9 | 246.2 | 14.7 | 22.0 | 2.0 | 55.5 | 31.64 | 31.99 | 32.05 | 32.15 | 32.48 | ||
| 229 | 102402.42574436.1 | 352.7 | 17.8 | 21.8 | 4.2 | 55.8 | 32.12 | 32.63 | 32.66 | 32.75 | 32.92 | ||
| 396 | 102418.39574829.8 | 398.4 | 19.0 | 22.4 | 3.0 | 56.0 | 31.56 | 32.56 | 32.69 | 32.60 | 33.02 | ||
| 463 | 102454.55574842.9 | 193.9 | 12.9 | 22.5 | 55.7 | ||||||||
Note. — Table 2 is published in its entirety in the electronic edition of the Astrophysical Journal. A portion is shown here for guidance regarding its form and content.
| X-rayaaSource sequence numbers follow Table 1. | NOMAD | 2MASS | IRAC | NIRbb“T” and “S” indicate that the NIR photometry is from 2MASS and SIRIUS data, respectively. NIR magnitudes are given only for good photometry; i. e., flags A, B, or C for 2MASS sources and the uncertainty of 0.1 mag for SIRIUS sources. | R | J | H | Ks | [3.6] | [4.5] | [5.8] | [8.0] | FlagsccThree types of flags (“NE”, “ME”, and “ET”) indicate the NIR excess sources identified in the NIR color-color diagram (Fig. 9a), MIR excess sources (Whitney et al., 2004), and early-type star candidates that have a brighter K-band magnitude than a main-sequence B2V star in the NIR color-magnitude diagram (Fig. 9b). Also given are the names in the literature (MSP from Moffat et al. (1991) and BM from Belloni & Mereghetti (1994)). |
|---|---|---|---|---|---|---|---|---|---|---|---|---|---|
| ID | ID | ID | ID | flag | (mag) | (mag) | (mag) | (mag) | (mag) | (mag) | (mag) | (mag) | & IDs |
| 3 | G284.128700.3588 | 11.0 | 10.9 | 10.9 | 10.9 | BM22 | |||||||
| 63 | 03230248919 | 102344455738316 | G284.176200.2515 | T | 9.0 | 8.6 | 8.6 | 8.6 | 8.5 | 8.6 | 8.6 | 8.5 | HD90273, BM5, ET |
| 112 | 03220246800 | 102356175745299 | G284.260400.3358 | S | 13.8 | 10.6 | 10.1 | 9.8 | 9.4 | 9.4 | 9.4 | 9.7 | MSP182, ET |
| 132 | 03220246854 | 102358005745489 | G284.266700.3380 | T | 12.6 | 8.9 | 8.1 | 7.6 | 7.1 | 6.8 | 6.7 | 6.3 | WR20a, BM25, ET, ME |
| 171 | G284.267600.3293 | S | 10.7 | 10.1 | 9.8 | 9.4 | 9.4 | 9.2 | MSP151, ET | ||||
| 172 | 03220246947 | 102400495744444 | G284.261800.3199 | S | 11.1 | 12.0 | 11.4 | 11.1 | 10.7 | 10.7 | 10.8 | MSP44, ET | |
| 181 | 03220246954 | 102400735745253 | G284.268400.3293 | T | 9.2 | 9.2 | 9.3 | 9.1 | MSP157 | ||||
| 192 | 03220246983 | 102401255745308 | G284.270100.3299 | S | 9.7 | 9.1 | 8.9 | 8.3 | 8.2 | 8.1 | MSP188, ET | ||
| 202 | 03220246993 | 102401515745569 | G284.274400.3358 | S | 14.3 | 10.6 | 9.9 | 9.6 | 9.2 | 9.2 | 9.2 | MSP263, ET | |
| 217 | 03220247016 | 102402015745279 | G284.271100.3283 | S | 10.3 | 9.7 | 9.4 | 8.7 | 8.6 | 8.5 | MSP167, ET | ||
| 224 | 03220247034 | 102402305745351 | G284.272600.3297 | S | 10.5 | 9.2 | 9.1 | 8.3 | 8.3 | 8.2 | MSP203, ET | ||
| 226 | 03220247036 | 102402375745307 | G284.272200.3286 | S | 9.8 | 9.2 | 8.9 | 8.2 | 8.1 | 7.9 | MSP183, ET | ||
| 229 | 03220247041 | 102402435744359 | G284.264200.3156 | S | 12.2 | 9.6 | 9.1 | 9.0 | 8.2 | 7.9 | 7.2 | 4.8 | MSP18, BM23, ET, ME |
| 240 | G284.273200.3291 | S | 10.7 | 10.1 | 9.9 | 9.3 | 9.3 | 9.2 | MSP199, ET | ||||
| 298 | 03220247156 | 102404895745282 | G284.276600.3250 | T | 11.9 | 10.5 | 10.0 | 9.6 | 9.4 | 9.3 | 9.4 | MSP171, ET | |
| 389 | 03230249498 | 102416655739310 | G284.245800.2271 | T | 15.9 | 13.5 | 12.9 | 12.6 | 12.3 | 12.2 | 11.7 | BM16 | |
| 396 | 03210235221 | 102418395748297 | G284.328800.3517 | T | 12.0 | 8.7 | 7.8 | 7.2 | 6.8 | 6.1 | 5.8 | 5.5 | WR20b, ET |
| 466 | 03220248312 | 102458505747379 | G284.396500.2921 | T | 14.0 | 13.2 | 12.5 | 12.4 | 12.1 | 12.1 | 11.7 | BM9 |
Note. — The complete version of this table is in the electronic edition of the Journal. The printed edition contains only a sample.
| X-rayaaSource numbers follow Table 1. | Name | Modelbb“1T” and “2T” indicate the fits by an absorbed one-temperature and two-temperature thin-thermal plasma (vapec) model, respectively. The amount of extinction (), the plasma temperature (1, 2), X-ray flux () and luminosity (), the abundance of Si and S relative to the cosmic values, and the goodness of the fit (/d.o.f.) are derived. The cosmic abundance (Anders & Grevesse, 1989) is used. For the 2T fits, 1 and 2 represent the higher and lower temperature component. The ratio of the two components is given as 1/2. | LabelccThe label of figures for the spectra and the best-fit models in Figure 11. | ddUncertainties of a 90% confidence range are given in parentheses. | 1b,db,dfootnotemark: | 2b,db,dfootnotemark: | 1/2 | eeValues in the 1.0–8.0 keV range. A distance of 4.2 kpc is assumed to derive . | eeValues in the 1.0–8.0 keV range. A distance of 4.2 kpc is assumed to derive . | SiddUncertainties of a 90% confidence range are given in parentheses. | SddUncertainties of a 90% confidence range are given in parentheses. | /d.o.f. |
|---|---|---|---|---|---|---|---|---|---|---|---|---|
| ID | (1022 cm-2) | (keV) | (keV) | (ergs s-1 cm-2) | (ergs s-1) | () | () | |||||
| 132 | WR 20a | 1T | 2.0 (1.1–2.4) | 2.0 (1.7–3.3) | 3.710-13 | 1.51033 | 0.7 (–2.8) | 1.7 (1.0–5.1) | 40.8/27 | |||
| 2T | (a) | 2.1 (0.9–3.0) | 4.2 (2.2–) | 0.8 (0.08–1.1) | 0.6 | 3.910-13 | 2.21033 | 1.2 (0.3–4.1) | 4.0 (1.5–) | 25.3/24 | ||
| 396 | WR 20b | 1T | 2.5 (1.9–3.4) | 3.0 (1.9–6.4) | 1.910-13 | 7.61032 | 1.0 (–5.3) | 1.6 (–6.4) | 33.6/18 | |||
| 2T | (b) | 3.9 (2.2–5.8) | 5.5 (2.8–) | 0.48 (0.30–0.72) | 0.1 | 2.210-13 | 1.81033 | 1.2 (0.3–5.0) | 3.4 (0.69–) | 20.3/17 | ||
| 192 | MSP 188 | 1T | (c) | 0.31 (0.11-0.56) | 3.6 (2.6–6.2) | 1.210-13 | 2.91032 | 6.2 (2.4–11) | 2.1 (0.0–8.0) | 41.7/10 | ||
| 217 | MSP 167 | 1T | (d) | 1.4 (0.2–2.8) | 1.4 (0.9–4.7) | 6.110-14 | 4.91032 | 0.9 (0.2–3.1) | 0.5 (–4.7) | 12.5/9 | ||
| 229 | MSP 18 | 1T | (e) | 0.63 (0.30–0.99) | 4.1 (2.6–8.9) | 2.710-13 | 7.21032 | 17.0/18 |