The interplay between radio galaxies and cluster environment
Abstract
By combining the REFLEX and NORAS cluster datasets with the NVSS radio
catalogue, we obtain a sample of 145, , X-ray selected clusters brighter than
erg s-1cm-2 that show a central radio emission above
3 mJy. For virial masses , 11 clusters out of 12
(corresponding to 92% of the systems) are inhabited by a central radio source.
This fraction decreases with higher masses as .
If this decrease is a selection effect, it
suggests that the majority of X-ray selected clusters host in their centre a
radio source brighter than W/Hz/sr.
A division of the sample into clusters harbouring either point-like or
an extended radio-loud AGN reveals that the steepening of the
relation for low-temperature clusters is strongly associated with the presence
of central radio objects with extended jets and/or lobe structures.
In the latter case, while for point-like sources one recovers an
approximately self-similar relation . Monte Carlo simulations
show that the steepening of the relation is not caused by
clusters being under-luminous in the X-ray band, but rather by overheating,
most likely caused by the interplay between the extended radio structures
and the intracluster medium. In the case of low-mass
systems, we also find a tight correlation between radio luminosity and
cluster temperature.
The effects of the central radio source on the thermal state of
a cluster become less important with increasing cluster mass.
The presence of radio sources with extended structures
(61, corresponding to of the sample) is enhanced
in X-ray luminous clusters with respect to ’field’ radio-loud AGN.
Furthermore, we find that the luminosity distribution of the cluster radio population
differs from that of all radio sources,
as there is a deficit of low-luminosity ( W/Hz/sr) objects, while
the number of high-luminosity ones is boosted.
The net effect on the radio luminosity function of radio galaxies
associated to cluster centres is of a flattening at all luminosities
W/Hz/sr.
keywords:
cosmology:observations - galaxies:clusters:general - galaxies:active - galaxies:statistics- X-rays:galaxies:clusters - radio continuum:galaxies1 Introduction
Arguably one of the most important problems in the field of structure formation is the
question of how cooling of gas, which leads to star and galaxy formation, is controlled
by various heating processes.
The widely accepted, hierarchical picture for galaxy formation states that baryonic matter
accretes onto dark matter halos. This picture implies that in the absence of any
feedback process, the galaxy mass function follows the dark matter halo mass function.
However, it has been known for some time that this is not true (see e.g. White & Frenk 1991).
At the high- and low-mass end, there is a deficit of galaxies compared with dark matter
halos. These discrepancies indicate that various heating mechanisms must be involved
in the formation of galaxies. Galaxy clusters possess the largest dark matter halos found
in the universe and contain gas at X-ray-emitting temperatures. The intracluster medium (ICM)
of galaxy clusters
has been studied intensively and X-ray selected clusters of galaxies provide an excellent
laboratory to explore the complex interplay between gas properties and heating mechanisms.
Galaxy clusters are known to obey fairly tight scaling relations between global properties
such as mass, temperature and X-ray luminosity. These relations are important when
using galaxy clusters to estimate cosmological parameters.
It is also known that simple, self-similar models (Kaiser et al.
1986) that correctly reproduce the scaling properties of the dark-matter distribution
of galaxy clusters (e.g. Borgani et al. 2001; Pointecouteau et al. 2005; Vikhlinin et
al. 2006) fail in describing the observed scaling relations of the hot baryonic component.
This discrepancy increases as one moves from
the regime of rich clusters of galaxies to that of poor clusters and groups, giving rise to
the so-called entropy-floor problem (e.g. Ponman et al. 1999; Ponman et al. 2003;
Pratt & Arnaud 2005; Piffaretti et al. 2005). Some source of extra heating has to be
invoked to reconcile theoretical expectations and observations.
Moreover, in the absence of non-gravitational heating, very dense cluster cores in which
the cooling time is often less than the Hubble time (so-called cool core clusters) should
cool and accrete gas at rates of hundreds and more solar masses per year (see Fabian et al.
2004 for a review). However, this model conflicts with results from X-ray spectroscopy that
have provided evidence that there is no massive cooling of gas in the central regions of
cool core clusters. (e.g. Peterson et al. 2001; 2003; Böhringer et al. 2002). Numerical
simulations of clusters of galaxies that include radiative cooling (e.g. Bryan 2000; Voit
& Brian 2001; Wu & Xue 2002)
star formation and supernova feedbacks (e.g. Borgani et al. 2004; 2005) are found to be
unable to reproduce the observed properties of the intracluster medium.
Currently, the most popular model that is invoked to explain the dearth of gas below about 1 keV (Peterson et al. 2003; Tamura et al. 2001) in the ICM relies on the heating by a central AGN. In principle, radio galaxies are energetic enough to halt the cooling in the centres of galaxy clusters and explain the high-mass truncation of the galaxy luminosity function (see e.g. Best et al. 2006). Radio-loud active galactic nuclei drive strong outflows in the form of jets that inflate bubbles or lobes. These lobes are filled with hot plasma, and can heat the cluster gas in a number of ways (e.g. Brüggen, Ruszkowski & Begelman 2005; Ruszkowski et al. 2004; Brüggen & Kaiser 2002; Churazov et al. 2001).
Direct evidence for AGN heating is growing. Images taken by CHANDRA and XMM-Newton have shown that AGNs in the centres of groups and clusters inflate bubbles in the surrounding X-ray emitting gas. Observations of the Perseus Cluster (Fabian et al. 2003; 2006) and of the Virgo Cluster (Forman et al. 2005, Simionescu et al. 2006) reveal sound waves and weak shocks that extend out to several tens of Kpc. Similar results are reported from investigations of Hydra A (Nulsen et al. 2005), MS0735.6+7421 (McNamara et al. 2004) and Abel 478 (Sanderson et al. 2004). From a more statistical point of view, Croston et al. (2005) considered a well-defined and homogeneous sample of ROSAT groups and report evidence for the gas properties of groups containing radio galaxies to differ from those associated to radio-quiet ones, in the sense that radio-loud groups are likely to be hotter at a given X-ray luminosity than radio-quiet groups. They attribute this to the effect of heating induced by radio galaxies. Dunn & Fabian (2006) analysed a more heterogeneous sample of 30 clusters that show clear signatures of radio activity either in the form of ’bubbles’ or in the form of a central radio core and study some of the properties of AGN heating.
More recently, Best et al. (2007) investigated the radio properties of galaxies located in the centres of 625 nearby groups selected from the Sloan Digital Sky Survey Data Release 4 (DR4; Strauss et al. 2002) and argue that AGN heating from the cluster central galaxy probably overcompensates the radiative cooling losses in groups of galaxies, therefore accounting for the observed entropy floor in these systems. However, Best et al. (2007) did not study the thermal properties of the ICM using X-ray data. Lastly, Jetha et al. (2006) examined the central regions of 15 galaxy groups with CHANDRA and find that repeated outbursts have a long-term cumulative effect on the entropy profiles in their sample.
By following Croston et al. (2005) and Best et al. (2007), the present work assesses the importance of (central) radio emission on the thermal properties of the intracluster medium in groups and clusters of galaxies from a statistical point of view. Our approach provides an improvement with respect to previous works as it addresses the issue of small statistics (present in Croston et al. 2005), lack of information on the thermal properties of the ICM (present in Best et al. 2007) and it also extends the investigation of the AGN-cluster properties up to the highest cluster masses (), while both the Best et al. (2007) and Croston et al. (2005) analyses only go up to rich groups/poor clusters scales. Finally, we distinguish radio sources in cluster centres on the basis of their radio morphology. As it will be discussed throughout the paper, such a distinction has an important impact on the analysis of the general properties of the ICM.
Here, we have considered a statistically significant sample of 145 X-ray selected clusters brighter than , taken from the REFLEX and NORAS surveys and endowed with central radio emission above the 3 mJy flux limit. The above limits ensure completeness both in the X-ray and radio selections. We investigate the thermal properties of our cluster sample and compare them to pre-existing results from the literature. We have also made use of detailed Monte Carlo simulations to study the behaviour of radio sources surrounded by a dense medium such as that of rich clusters.
The layout of the paper is as follows: §2 presents the parent catalogues from which our sample was drawn, while §3 discusses the procedure to assign a radio source to cluster centres. §4 describes the final catalogue, with particular attention to the issue of extended vs unresolved radio structures. §5 illustrates our results on the fraction of X-ray selected clusters which host a central radio source (§5.1), on the X-ray and radio luminosity relations with cluster temperature (§5.2), on the X-ray, radio and mechanical luminosity relations with the clusters velocity dispersion (§5.3) and on the mass deposition rate (§5.4). §6 presents the results from Monte Carlo simulations on the X-ray luminosity distribution of clusters inhabited by a central radio source and on the radio luminosity distribution of radio sources surrounded by a dense medium. §7 summarizes our results and discusses the complex interplay between radio source activity and thermal properties of the clusters which host them.
Throughout this work we adopt a flat cosmology with a matter density and a vacuum energy density , a present-day value of the Hubble parameter in units of km/s/Mpc, .
2 The parent catalogues
2.1 NORAS and REFLEX
The Rosat-Eso Flux Limited X-ray galaxy cluster survey (REFLEX; Böhringer et al. 2004) provides information on the X-ray properties, fluxes, redshifts and some identification details for a sample of 447, , galaxy clusters brighter than an X-ray flux of (0.1 to 2.4 KeV). It covers 4.24 sr (corresponding to 34% of the entire sky) by observing at almost all Galactic latitudes and declinations . The catalogue completeness is estimated to be per cent for fluxes brighter than . The number of sources fulfilling this flux requirement is 425.
The Northern ROSAT All-Sky galaxy survey (NORAS; Böhringer et al. 2000) contains 484 clusters (including the supplements to the original survey catalogue) with measured redshifts up to . This number decreases to 245 if one considers the flux limit for REFLEX completeness. The survey probes Galactic latitudes and declinations , and is estimated to be % complete with respect to the REFLEX survey at the same flux levels.
X-ray luminosities in the [0.1-2.4] KeV band are provided for both the REFLEX and NORAS clusters. However, while in the case of the REFLEX survey these are given in the concordance CDM cosmology, the NORAS catalogue still refers to an EdS model with . In order to correct for this problem, we converted the NORAS X-ray luminosities from the original EdS cosmology to the one adopted in this work by simply writing , where is the comoving coordinate evaluated at the specific redshift of each object.
For the conversion from X-ray luminosities in the relevant [0.1-2.4] KeV band to cluster masses we followed the approach presented by Borgani et al. (2001). As a first step, we computed bolometric and K-corrections to the [0.1-2.4] KeV-observed band by using the relation provided by Böhringer et al. (2004). Then, for the relation between temperature and bolometric luminosity, we considered the phenomenological expression:
| (1) |
where we took , (e.g. White, Jones & Forman 1997; Wu, Xue & Fang 1999) and . Finally, in order to convert temperature into mass, we assumed the conditions of virialization, hydrostatic equilibrium and isothermal gas distribution to hold by considering the relation:
| (2) |
(e.g. Eke et al. 1998), where we take 76% of gas to be hydrogen, is the cluster virial mass expressed in solar masses, is the ratio between the kinetic energy of dark matter and the gas thermal energy, and is the ratio between the average density within the virial radius and the mean cosmic density at redshift . In our case we assume , as found by the Santa Barbara cluster comparison project (Frenk et al. 1999). Once we have computed the virial masses, we obtain the virial radii via . Given the uncertainties associated with the parameters used in equations (1) and (2) and the errors related to the determination of in both the REFLEX and NORAS surveys, we note that the values quoted throughout this work for both and have to be considered estimates.
2.2 NVSS
The NRAO VLA Sky Survey (Condon et al. 1998) is a radio survey that has observed the entire sky north of -40 deg declination at 1.4 GHz. The NVSS was observed with the array in the D configuration (DnC for most of the southern sky), which provides an angular resolution of 45 arcsec. More than 1.8 million sources were observed down to a flux limit mJy, and the survey is shown to be % complete at fluxes brighter than mJy. The rms uncertainties in right ascension and declination vary from 1 arcsec for relatively strong ( mJy) point sources to arcsec for the faintest detectable objects.
3 matching procedure
As explained in the introduction, the scope of the present work is two-fold: first, it aims at investigating the properties of those radio sources that reside in the proximity of cluster centres. Second, it studies the impact and possible effects of radio sources on the surrounding ICM. Note that for our purposes cluster centres are assumed to coincide with the centres of X-ray emission, so that in most (but not all) cases the adopted centre is coincident with the position of the central cluster galaxy (hereafter CG).
In the region where X-ray and radio surveys overlap (), we compiled a catalogue of X-ray selected clusters with enhanced central radio emission by performing a cross-correlation analysis between objects brighter than in the NORAS and REFLEX samples and radio sources from the NVSS dataset with 1.4 GHz fluxes above 3 mJy. These flux limits were required to ensure a high degree of completeness both in the primary X-ray selection and in the search for radio counterparts (cfr. Sections 2.1 and 2.2). There are 425 clusters from the REFLEX survey fulfilling the above condition on X-ray fluxes. This number falls to 305 when we consider only those sources that lie at , necessary for the overlapping of the radio and X-ray surveys. The total number of clusters used for our analysis is then 550, where 245 come from the NORAS survey.
A suitable matching radius should maximize the number of real associations and minimize spurious matches. Here we have to consider three factors: i) the wide range of redshifts spanned by clusters in the REFLEX and NORAS surveys (from to ), ii) the fact that X-ray and radio emission in the proximity of the cluster centre can be displaced from one another and iii) that NORAS and REFLEX are flux-limited surveys probing on average more luminous and more massive clusters at increasing redshifts. All these factors converge at indicating that we cannot use a fixed matching angular radius. In fact, an angular radius suitable for sources around would be too large for the more local objects and as a result would increase (even by a large factor for the very local clusters) the chances of random associations. On the other hand, an angular radius suitable for local sources would most likely miss real radio-to-X associations at higher redshifts.
Consequently, we have chosen to adopt a varying angular radius in our cross-correlation analysis. Since on average clusters of higher mass are found to host more massive and therefore larger CGs (e.g von der Linden et al. 2007) – so that the possibility for a greater displacement between X-ray and radio emission originating from within the eventual CG is higher – we have adopted a matching radius of the form , where is the angular extension of the cluster given by , with virial radius and comoving distance.
Particular attention was paid to the determination of the value for the quantity used in . We find that (i.e. 1.5% of the projected virial radius) produces a large enough sample of X-ray clusters with a central radio counterpart while minimizing contamination from interlopers. These interlopers can reside both inside (i.e. radio emitters other than the central source) and outside (i.e. spurious matches originating from projection effects) the clusters in our sample.
By applying the above matching criteria to the REFLEX and NORAS samples, we find that 81 REFLEX clusters out of 305 – corresponding to 26.5% of the sample – have a radio counterpart that is offset from the centre of X-ray emission by less than 1.5% of the virial radius, while in the case of NORAS we have 67 radio matches out of 245 objects (i.e. 27.3% of the original dataset) within the same angular distance. It is reassuring that the percentage of matches is approximately the same in the two cluster surveys. These figures are also in agreement with the results from Best et al. (2007) for the occurrence of central radio counterparts in their SDSS cluster sample (see their Figure 2). Croston et al. (2005) and Dunn & Fabian (2006) find somehow higher values (on the order of 50%), but the selection criteria for these two samples are different from ours, especially since both groups consider systems that are on average at much lower redshifts than our sample.
We note that three sources in REFLEX (namely RXCJ0338.4-3526, RXCJ1501.1+0141, RXCJ2347.7-2808) and two in NORAS (RXCJ1229.7+0759 and RXCJ1242.8+0241) allowed for more than one radio counterpart within the adopted matching radius. Visual inspection of radio maps has shown that in all five cases the central radio sources had extended/multiple structures. The radio flux associated with each of these objects was taken to be the sum of their sub-components. We will get back to this point in Section 4.1.
Chances of contamination from spurious sources in the joint radio–X-ray catalogue as obtained above have been estimated by simply vertically shifting all radio positions by 1 degree and by re-running the matching procedure. By doing so, we find that in the case of both REFLEX and NORAS the probability that a radio source falls by chance within the search radius from the centre of X-ray emission is about 5.6%. The adoption of a smaller matching radius sensibly reduces the number of radio sources found in the proximity of the centre of X-ray emission, while leaving the chances for spurious contamination almost unaltered. For instance, if instead of taking we consider , in the case of REFLEX we only obtain 56 matches, while the estimated percentage of random coincidences remains almost the same (%). On the other hand, increasing the allowed matching radius by even a small amount greatly increases the number of possible spurious counterparts: for this figure already gets as high as 13%.
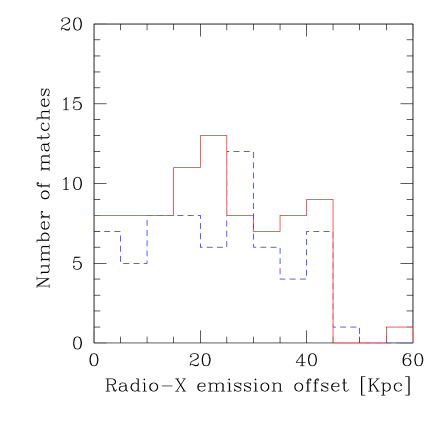
The distribution of residuals between radio and X-ray positions as a function of the (comoving) distance from the centre of the cluster is shown in Figure 1. The solid line indicates the case for REFLEX clusters, while the dashed line refers to the NORAS sample. All radio positions differ from the X-ray ones by less than Kpc. If a central cluster galaxy is present, this implies – as expected – that radio emission originates from it.
The number of clusters brighter than erg s-1cm-2 endowed with a central radio counterpart above the 3 mJy level as derived from our analysis is 148. Three clusters, however, have multiple identifications in the NORAS and REFLEX catalogues (i.e. appear in both surveys). By removing these sources from the radio-NORAS sample, we end up with 145 clusters with a unique central radio counterpart. This is the sample that will be used throughout this work.
4 Description of the sample
Relevant properties for the radio sources found in the proximity of
NORAS and REFLEX cluster centres by following the procedure described in
Section 3 are summarized in Table 2 which reports in the various columns:
(1) Name of the parent cluster.
(2)-(3) RA(2000) and Dec(2000) of the radio source.
(4) Radio flux expressed in mJy ().
(5) Log of the radio luminosity expressed in W/Hz/sr ().
(6) Redshift of the cluster ().
(7) Distance between cluster centre and radio counterpart (Kpc).
(8) Notes on the radio appearance, i.e. whether point-like (blank space)
or extended/sub-structured source (denoted with an ’S’).
Radio luminosities have been calculated according to the relation:
| (3) |
where is the angular diameter distance and is the spectral index for radio emission []. Since we do not have measurements for , we assumed which is the typical value found for early-type galaxies and steep spectrum sources such as jets and lobes. Note that, since the maximum redshift probed by both cluster surveys is always , estimates from equation (3) do not depend on the precise value of the spectral index.
4.1 Radio sources with extended emission
The issue of extended/sub-structured sources (point (8) in Table 2) deserves a digression. As mentioned in Section 3, five clusters are associated with radio sources that have multiple components within the chosen search radius. A visual investigation of the radio images taken from the NVSS survey for all the 145 radio objects associated with NORAS and REFLEX clusters shows that about 42 per cent of them differ from a point-like structure. (Note that since the NVSS resolution is , multiple structures closer than Kpc at up to Kpc at the highest redshifts probed by the REFLEX and NORAS surveys will be unresolved in the NVSS radio maps. We will get back to this point in Sections 5.1 and 5.2). More precisely, this happens for 61 sources, out of which 33 are found in REFLEX clusters and 28 in NORAS clusters. The percentage quoted above is much higher than what is found for ’field’ radio galaxies within the same redshift range and at similar radio flux levels ( cfr. Magliocchetti et al. 2001). We will get back to this point in Sections 6 and 7.
Having labelled the radio sources with an ’S’, we do not make any further distinction on whether the radio emission presents extended blobs, it appears as a close or distant double-lobed object or features a triple/more complex structure. For the purposes of the present work, the only division we are interested in is whether the radio source exhibits signs of extended emission or not.
Generally, it was relatively easy to recognize different sub-structures that belong to the same radio source. Nevertheless, there are a number of cases that remain uncertain and that have been labelled with an ’S?’ in Table 2. To play safe, these sources have not been included in the ”sub-structure” sample and in the following analyses they will be treated as point-like objects.
Radio fluxes for extended radio sources in Table 2 have been obtained by adding up all the fluxes of their different components. Radio luminosities have then been computed by means of equation (3) for the resulting total fluxes.
5 Observational properties of the sample
In this section, we will show the most interesting properties and relations of our sample. In addition to the data described in Section 4, some extra information such as temperatures and velocity dispersions has been gathered from the BAX and VIZIER databases. All the best-fit values for the relations presented in the following pages are summarized in Table 1, while we defer a detailed interpretation of the results to Sections 6 and 7.
| Point-like sources | Extended Sources | Whole sample | |
|---|---|---|---|
| vs (Fig. 7a) | ; (33) | ; (31) | ; (64) |
| vs (Fig. 7b) | ; (33) | ; (31) | ; (64) |
| vs (Fig.8a) | ; (19) | ; (20) | ; (39) |
| vs (Fig. 8b) | ; (16) | ; (18) | ; (34) |
| vs (Fig. 9) | ; (19) | ; (20) | ; (39) |
| vs (Fig. 10) | – | – | (15) |
5.1 Fraction of radio detections
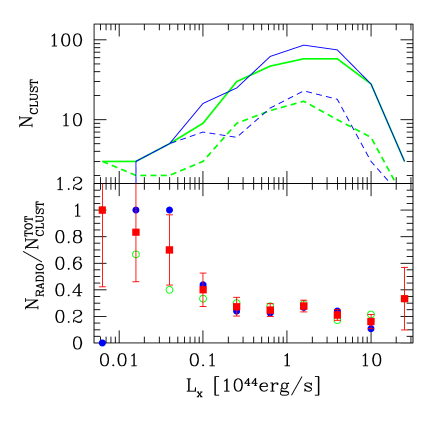
As an interesting first exercise, we can estimate the number of X-ray clusters brighter than 3 erg s-1 cm-2 that host a central radio source above mJy. Figure 2 shows, as a function of X-ray luminosity, the total number of X-ray clusters used in this work (solid lines in the top panel of Figure 2; the thick line represents the NORAS case while the thin one is for REFLEX clusters), the number of X-ray clusters with a central radio counterpart (dashed lines in the top panel of Figure 2), and the ratio between these two quantities (bottom panel of Figure 2, where squares and associated errorbars indicate the combined REFLEX+NORAS case). Note that there is a clear preference for radio sources to appear in poor clusters. In fact, despite the relatively poor statistics at low luminosities, the percentage of clusters hosting a central radio-AGN brighter than 3 mJy drops from about [50%-100%] for erg/s to % at the highest luminosities probed by NORAS and REFLEX.
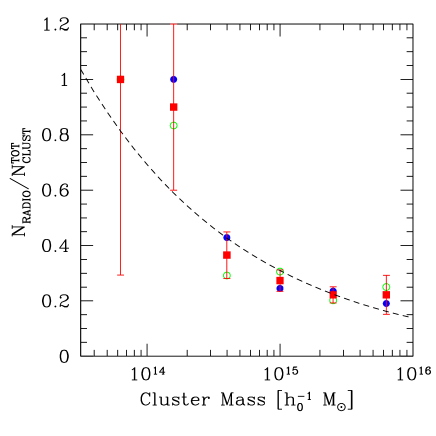
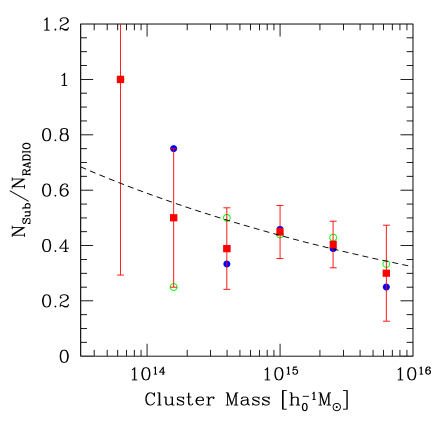
This trend becomes even more intriguing if one considers the fraction of clusters that present central radio emission above 3 mJy as a function of the cluster virial mass evaluated as in Section 2.1 (Figure 3). In this case, there is a trend for central radio detections in clusters to decrease with cluster mass; we find that all but one of the 12 poor clusters and groups identified in NORAS and REFLEX are associated with a central radio emitting source brighter than 3 mJy in the NVSS maps, while this figure rapidly decreases to a per cent as soon as one moves to masses . We can quantify this result by writing: , where and (dashed line in Figure 3).
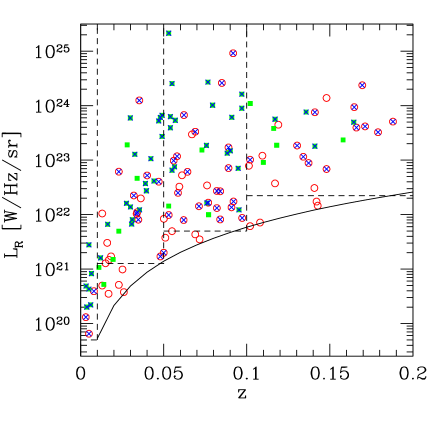
Obviously, selection effects bias the results presented in Figures 3 and 2. The adopted flux limit for NORAS and REFLEX implies that X-ray luminous and therefore more massive clusters are preferentially observed at higher redshifts. On the other hand, the radio-selection function derived from having used a 3 mJy limit for our radio sample (solid line in Figure 12b) implies that while locally one is capable of detecting all radio sources brighter than W/Hz/sr, at the redshifts probed by massive clusters only radio sources brighter than W/Hz/sr can be observed. Furthermore, probing the most luminous clusters at high redshifts may imply selecting relaxed clusters i.e. those which are cool-core ones. If radio-loud AGN are the origin for any feedback, then this may be an extra selection effect, in that cool-core clusters are more likely to host powerful radio sources.
Nevertheless, the observational fact that all but one of the local clusters and groups host a central radio-luminous source suggests that – by going deep enough in radio maps – this might also be the case for the majority of X-ray selected clusters. This conclusion becomes more stringent by the fact that our criterion for associating radio sources with cluster centres necessarily misses relatively common objects such as triple structures where the central component is too faint in radio to be seen (double-lobed sources with a ’radio-quiet’ galaxy set in their middle).
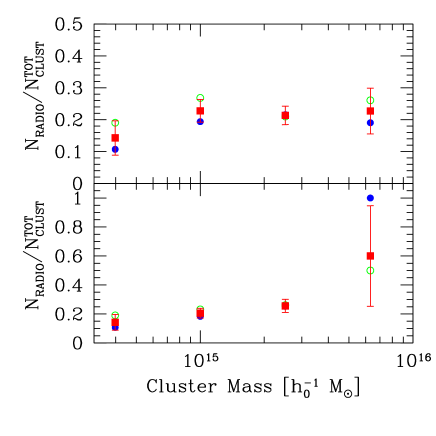
To obtain an unbiased trend for the recurrence of radio sources in cluster centres, we compile a volume-limited sample. This is presented in the bottom-panel of Figure 4 for the volume-limited sample , W/Hz/sr (cfr. Figure 12b), chosen such that the number of sources available for the analysis is maximised. In this case, the fraction of X-ray clusters with central radio emission is found to be around the 20 per cent level, with possibly a slight preference for radio sources to inhabit more massive clusters. We note however that this result only holds for relatively large clusters as the radio luminosity cut has excluded all clusters less massive than .
Best et al. (2007) use a sample of 625 groups and clusters of galaxies selected from
the Sloan Digital Sky Survey and cross-correlated with the NVSS and FIRST (Faint
Images of the Radio Sky at Twenty centimeters; Becker et al. 1995) radio samples to study
the properties of radio-loud AGN in the brightest cluster galaxies (coinciding in the
majority of the cases with our definition of CGs, see von der Linden et al. 2007).
In their work they show that the fraction of brightest cluster galaxies that are
radio-loud AGN increases with (stellar) mass as up to a
plateau level of about per cent reached for their highest mass range
which is centred at around .
Our sample of X-ray selected clusters allows to extend the Best et al. (2007) analysis
to the higher-mass region probed by rich groups and clusters of galaxies. The trend
presented in the top panel
of Figure 4 then shows the fraction of clusters with a central radio
counterpart brighter than W/Hz/sr (limit which is comparable to the
definition of radio loudness given in Best et al. 2005) as a function of
cluster mass. At all cluster masses, the percentage of clusters hosting a central
radio-loud source is substantially constant and equal to per cent.
Our results, both for what
concerns the presence of a plateau in the distribution of objects that are radio-loud AGN
and for the value of such fraction, are then in agreement with those of Best et al.
(2007). It is quite intriguing that the same dependence (or rather independence) on mass
of the occurrence of central radio-loud sources in massive extragalactic objects is found
independently of whether
such a mass is that of a ’field’ galaxy (see Best et al. 2007), of a cluster central galaxy
or of the cluster that surrounds it.
Another interesting point concerns the intermittency of the radio-loud AGN phenomenon. Best et al. (2005) argue that the observational finding that -30 per cent of all the most massive galaxies in their sample present signatures of radio activity implies that this activity has to be re-triggered so often that the galaxy spends about a quarter of its life-time in an active state. This fuel-supply requirement becomes even more demanding if one considers that the Best et al. (2005) selection includes radio sources that are brighter than those considered in this work. As already discussed, Figure 3 suggests that if one goes to low-enough radio luminosities, it is likely that the majority of clusters host a central radio source, just as it is found locally for our sample. This result would then imply an almost constant re-triggering of the radio source, so to allow the hosting galaxy to spend almost all its lifetime in an active state.
As a final point in this section, we have considered those radio sources within the cluster centres that present extended and/or sub-structured radio emission and investigated whether there was a dependence of their recurrence rate on cluster mass. The results are presented in Figure 5. The very marginal trend for their fraction to decrease with () is most likely due to the combined effect of the resolution capabilities of the NVSS survey with the already mentioned selection biases in flux-limited surveys which preferentially identify massive clusters at high redshifts. This implies that, at variance with what happens more locally, close substructures will not be observed as such at those redshifts, resulting in a net loss of sub-structured/extended sources starting from and particularly beyond (cfr. Figure 6). Nonetheless, in the local universe and/or at low cluster masses there is a tendency for the majority (%) of central radio sources to possess extended radio emission. Combining this result with that of Figure 3 we can then conclude that, at least locally, the majority of clusters (which in this case are rather groups) host an extended radio source in their centre. We will investigate the consequence of this finding in the next sub-sections.
5.2 Luminosity vs Temperature

X-ray scaling relations of galaxy clusters, such as the X-ray luminosity-temperature relation, play an important role when using clusters of galaxies to constrain cosmological parameters. When gravitational heating is the only source of heating, clusters should behave self-similarly and the X-ray luminosity (due to thermal bremsstrahlung) should scale as (Kaiser 1986).
Most authors (e.g. White, Jones & Forman 1997; Arnaud & Evrard 1999 and more recently Popesso et al. 2005) report correlations with logarithmic slopes close to 3 in the cluster regime, though attempts to remove the effects of central cooling flows (Allen & Fabian 1998; Markevitch 1998) results in flatter relations. However, the above result is found to break at the mass/luminosity scales of groups of galaxies. Helsdon & Ponman (2000a,b) report a steeper slope of for a sample of X-ray bright loose groups, and for a larger sample including both loose and compact groups, while Xue & Wu (2000) found a slope from data for 38 groups taken from the literature. More recently, Osmond & Ponman (2004) – by analysing a sample of 60 galaxy groups within the GEMS project – have measured an slope that is comparable with that found in clusters (but see their discussion about possible systematics which could have affected their result).
The observed departure from self-similarity has been interpreted as excess of entropy in low mass clusters due to some form of pre-heating generated by sources such as supernovae and/or AGN (see e.g. Tozzi & Norman 2001). Evidence for heating excess in 19 groups containing radio-loud AGN has recently been reported by Croston et al. (2005). From the theoretical point of view a number of works have shown that radio-loud AGN can provide a sufficiently energetic and widely distributed heating mechanism to solve the entropy floor problem (e.g. Brüggen & Kaiser 2001; Brüggen & Kaiser 2002; Böhringer et al. 2002; Fabian et al. 2003; Heinz et al. 2006).
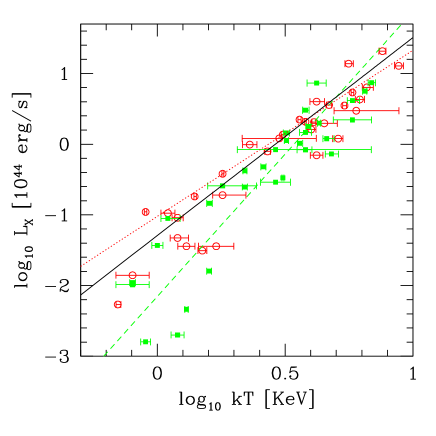
In order to investigate the effects of the presence of a central radio component in groups and clusters of galaxies from a statistical point of view, we have gathered temperatures for 64 of the radio-detected clusters belonging to our sample from the BAX database. This sample was sub-divided according to whether the central radio source presented an extended (31 objects) or an unresolved (33 objects) structure. The vs trend for the two sub-populations is presented in the left-hand panel of Figure 7, where open circles represent clusters inhabited by point-like radio sources, while filled squares are for clusters associated with central sources with extended radio emission. The difference in behaviour between these two populations is striking: at a given temperature, the overwhelming majority of clusters associated with extended radio sources have a lower X-ray luminosity than those that host point-like radio objects. Or, from a different point of view, at a given luminosity clusters associated with extended radio sources are systematically hotter than those that are not.
When we make a fit to our entire sample of X-ray selected clusters that host a central radio source, we find a slope of the relation of . This slope becomes appreciably shallower () if one only includes unresolved radio sources, and remarkably steeper () for the sub-population of extended radio objects. Intriguingly, X-ray clusters with a point-like central radio source trace a distribution that is very similar to the expected for self-similar systems. The presence of extended radio sources breaks this relation causing a much steeper dependence of X-ray luminosity on cluster temperature. This may point towards a more efficient mode with which extended sources can permeate the surrounding ICM and transfer heat within the cluster. As will be discussed in greater detail in Sections 6 and 7, the absolute effect of extended radio-loud AGN on the ICM decreases with cluster mass. This is clearly seen in Figure 7a. With increasing mass (i.e. increasing ), the difference between point-like and extended radio sources decreases.
The issue of point-like vs extended radio sources has been investigated further by considering volume-limited samples of clusters. In fact, given the 45′′ resolution of NVSS (cfr Section 4.1 and Figure 6), the above result on the different behaviour of the relationship for clusters that host compact or extended radio sources could be biased by the presence of radio structures that are extended but appear as point-like in the NVSS maps. We have then repeated the above analysis by splitting the samples into sources with and . This means that for the closer sub-group of clusters, all radio structures more extended than 46 Kpc will be correctly identified as such in the radio maps. However, in the subsample made of more distant objects one will identify as point-like all those extended radio sources that have structures smaller than Kpc. In the former case, the best-fit values for the vs relationship are ; for extended sources and ; for point-like structures. At higher redshifts one instead gets ; and ; . One can then see that the results obtained for the more reliable local subsets of clusters are in very good agreement with those derived previously in this Section (cfr Table 1) regardless of the cluster redshift distribution. This is reassuring. Harder is the intepretation of the higher-redshift results. In this case clusters inhabited by point-like and sub-structured radio sources present a very similar dependence of the X-ray luminosity on the temperature. Whether this effect is due to the fact that the ’point-like’ sample of sources in this redshift range also includes a fraction of sub-structured (but unresolved) objects, therefore producing a net mix of the two populations or whether its explanation resides in the more physical effect that at high redshift we are preferentially selecting higher-mass systems where the absolute effect of extended radio-loud AGN on the ICM is smaller is difficult to tell. Higher-resolution radio observations of the cluster centres are needed to disentangle these two effects.
The average behaviour obtained by considering both populations of extended and point-like radio sources is in remarkable agreement with what is found in the literature for the whole cluster population (e.g. White, Jones & Forman 1997; Arnaud & Evrard 1999; Popesso et al. 2005). This result, together with the fact that we expect most X-ray selected clusters to host a central radio object brighter than W/Hz/sr (see §5.1), suggests that the observed scaling is due to the superposition of two separate populations: clusters inhabited by unresolved radio objects and clusters with extended radio emission.
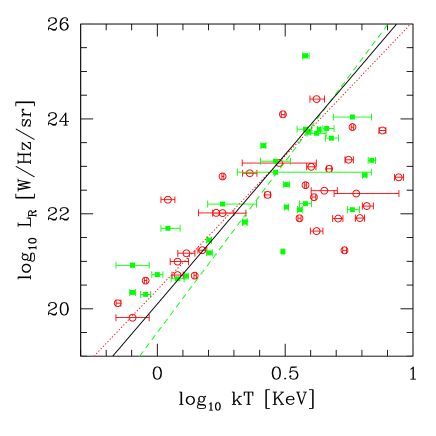
The above analysis underlines the fundamental importance of extended radio-loud AGN in breaking the self-similarity of clusters, at least on scales KeV. At this point one can wonder how the level of radio activity depends on the cluster temperature. A plot of vs is presented in the right-hand panel of Figure 7. Independent of the radio morphology, there is a much greater spread than in the vs plot. However, for keV, i.e. in the regime where radio-loud AGN heating is very efficient, the relation is relatively tight, providing some evidence – at least in low-mass systems – for a relation between radio luminosity and cluster temperature, in that hotter clusters host more powerful radio sources. Note that this result is found to hold for both unresolved and sub-structured radio sources.
5.3 Velocity Dispersions
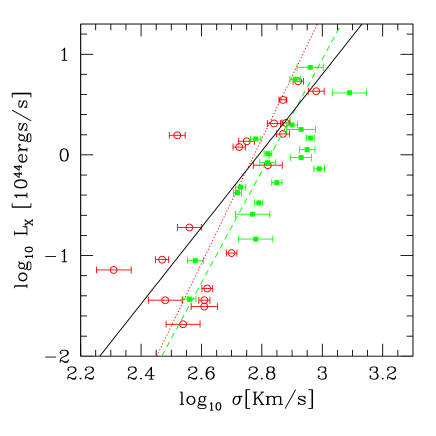
Velocity dispersion measurements for this part of our analysis have been taken from the VIZIER database and in most cases rely on the works of Mahdavi et al. (2000) and Mahdavi & Geller (2001). X-ray luminosities have been compared to velocity dispersions for the 39 clusters for which measurements were available in the left-hand panel of Figure 8. Best-fit values for the fits are provided in Table 1. The trend seen for the whole population of clusters inhabited by a central radio source (, with ) is in general agreement with what is found in the literature for different sets of clusters and groups of galaxies (e.g. , Popesso et al. 2005; , Madhavi & Gheller 2001; for the clusters considered in Osmond & Ponman 2004). This behaviour, together with what was found in Section 5.2 for the relation, show that radio-identified clusters provide a fair sample of the entire cluster population.
However, the similarity breaks if one considers clusters inhabited by unresolved and extended radio sources separately. For the former case, we find that , while in the case of extended radio emission we find . The difference in the observed behaviour of these two sub-groups with the general case (cfr. Figure 8a) may be attributed to the fact that in our sample extended radio sources seem to be systematically associated to higher velocity dispersion systems. Even though the available data is not good enough to provide more than a evidence for this effect, the net result of combining extended and point-like radio sources is a flattening of the relation to the ’standard’ value . As already observed in Section 5.2, it is intriguing that the sum of two populations with dissimilar behaviours gives rise to a trend that matches previous measurements obtained for different cluster sets. This suggests again that clusters can be divided into two rather different groups: clusters that host point-like radio sources and those associated with extended radio emission.
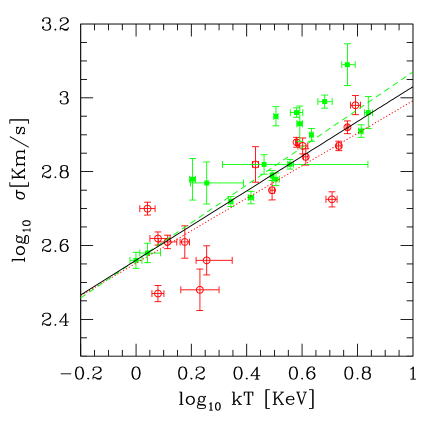
It would be interesting to investigate the relation in the low-mass/low-luminosity region ( erg/s, KeV) where the discrepancy in the behaviour between extended and point-like sources becomes more pronounced. Unfortunately, the available data on velocity dispersions only probe the erg/s regime, so that this is currently not possible. For the same reason, we cannot detect any difference in the relation between temperature and velocity dispersion (right-hand panel of Figure 8), a part from a marginal preference for extended radio sources to reside in higher velocity dispersion systems. The slope of the vs relation is in all cases, again in agreement with most of the results found in the literature.
By analysing the cavities and bubbles that are produced in clusters and groups by the interaction between radio sources and the surrounding hot gas, Birzan et al. (2004) provide a useful empirical relation to estimate the mechanical luminosity released by the central radio source into the ICM:
| (4) |
Even though the 1.4 GHz synchrotron luminosity is not too reliable at predicting the mechanical luminosity as can be seen from the large errors in the exponent of Eq. 4, we will use it to calculate the energetic balance between AGN heating and radiative losses (as in Best et al. 2007 and Birzan et al. 2004). This is presented in Figure 9 as a function of the cluster velocity dispersion, where once again solid squares are for extended radio sources, while open circles represent point-like structures. In agreement with Best et al. (2007) we find that, while on the smallest mass scales ( Km/s) radio heating balances radiative losses, such a heating mechanism falls short by as much as a factor 100 for the most massive clusters in our sample.
There is no significant difference between the behaviour of extended and point-like sources (), even though the data does not allow us to conclude anything about the group regime.
Thus, for the smaller mass systems we have found the following: (i) mechanical heat and radiative losses balance and (ii) there is a correlation between X-ray luminosities and cluster temperatures and between radio luminosities and cluster temperatures in the low temperature regime (Section 5.2). This suggests the conclusion that in objects such as groups or small clusters of galaxies there is a strong interplay between central radio source and the surrounding gas. In this case, more powerful radio sources lead to hotter systems. The eventual presence of extended radio structures such as jets and lobes is of fundamental importance to the thermal state of the ICM, as they can carry energy throughout the whole cluster and appear to be more efficient at heating the surrounding medium. The heating provided by the central radio source is also found to be sufficient to balance radiative losses.
The situation is different at higher masses. In this case, we find that there is no correlation between the radio luminosity of the central source and the cluster temperature. Also, the effect of the radio-loud AGN on the thermal state of the cluster is independent of the capabilities of such an object to permeate the surrounding medium (no difference in the relation between extended and point-like sources). AGN heating is found to be insufficient to counterbalance the radiative losses of the ICM, with a relative energetic importance which steeply decreases (as ) with cluster mass.
A different source of prominent heating must be invoked in this latter case. One such mechanism may be thermal conduction (see e.g. Brüggen et al. 2003; Hoeft & Brüggen 2004; Roychowdury et al. 2005; Ruszkowski & Begelman 2002; Fujita & Suzuki 2005; Narayan & Medvev 2001; Voigt & Fabian 2004). Hoeft & Brüggen (2004) have provided evidence for the relative importance of heating due to thermal conduction to increase with cluster mass, in agreement with our results.
5.4 Cooling core clusters
Clusters of galaxies can be separated into two classes: clusters with dense gaseous cores in which the cooling time is less than the Hubble time, (cool core clusters), and cluster with less dense gaseous cores (non-cool core clusters).
Chen et al. (2007) have investigated the influence of cool cores on cluster scaling relations. Their analysis has shown that in cool core clusters the X-ray luminosity is enhanced over that of non-cool core clusters, while other parameters such as temperature, mass and gas mass are less affected by the occurrence of a cooling core. This has been explained by the fact that at least some of the non-cool core clusters are in dynamically young states compared with cooling core clusters. Alternatively, the non-cool core clusters might have had their cool cores heated by a radio-loud AGN. This is suggested by Fig. 7a which shows the relation for clusters with an extended radio source and for those without it. Our result indicates that the scaling relations for clusters are significantly affected by the presence of a radio-loud AGN at their centres.
In the work by Birzan et al. (2004), a close correlation between the mechanical energy output of the jets and the energy loss of the central X-ray plasma by cooling (related to the traditionally determined cooling flow mass deposition rate) has been established. This lends support to the idea that the feeding of the AGN is connected to the cooling rate and that the energy output of the AGN regulates the cooling core structure by feedback processes. In any model of feedback, the power of the central AGN should be regulated by the supply of fuel from the ICM. Thus, as in a thermostat, large radiative losses should give rise to a strong, central radio source, which in turn will heat up the ICM (see Churazov et al. 2003). The more strongly a cluster cools at its centre, the more fuel can be supplied to the central AGN which, in turn, can drive more energetic radio lobes through the ICM which gets heated until the central cooling time goes up, the mass deposition rate goes down and the supply of fuel is shortened.
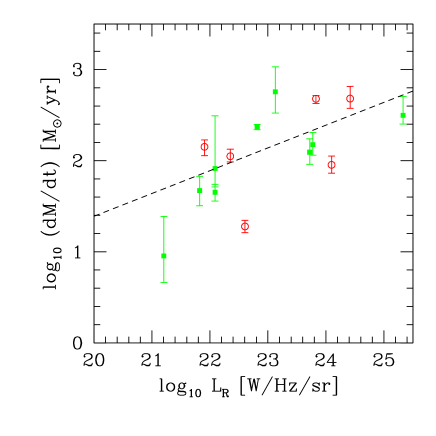
Cooling flow measurements for 15 clusters belonging to our sample have been taken from White et al. (1997). Figure 10 shows the dependence of the radio luminosity of the central source, , on the cooling luminosity , i.e. the X-ray luminosity within the cooling volume (we note that, even though White et al. 1997 quote their values in an , cosmology, converting these measurements to the adopted CDM cosmology would merely correspond to a vertical shift of the vs relation which does not affect our analysis and conclusions). Given the paucity of sources and the fact that they did not show any different behaviour, in this case the best-fit value for vs is only given for the whole sample of clusters which host a central radio source, independent of whether this source presents an extended or a point-like structure. The plot of the classical mass deposition rate versus the radio luminosity shows a clear correlation ( with cfr. Table 1) which is in agreement with feedback models (e.g. Churazov et al. 2003) for the fueling of cluster radio sources.
6 Clusters with central radio emission: under-luminous or overheated?

In Section 5.2 we have seen how clusters that host a radio source endowed with an extended structure show a departure from the typical relation found for the cluster population as a whole (cfr. Figure 7a), a departure that is particularly remarkable in the case of low-mass systems. What is not yet clear from our analysis is if extended radio sources cause an under-luminosity or an overheating of the associated cluster. If it is indeed a temperature increment caused by the central radio galaxy, one may expect the corresponding heat excess to be correlated with the radio power of the central source.
To investigate this possibility, we have considered the quantity which is the energy required to heat the ICM from the predicted to the measured temperature. In the above expression, is the total number of particles, the gas mass of the cluster and the temperature increment of clusters which host an extended radio source with respect to the relation obeyed by clusters with unresolved central sources. The gas mass was computed from the total mass of the cluster by using a constant gas mass fraction of 0.2. We have plotted the required energy as a function of radio power in Fig. 11. The radio luminosity and the heat input needed to produce the observed temperature increment in clusters hosting extended radio sources appear to be correlated, although with a large scatter. This correlation favours a model where the temperature increase is caused by radio galaxy-induced heating. As noted by Croston et al. (2005) who performed a similar analysis for groups of galaxies, the large scatter in this plot is not surprising given that there are many unknown factors such as the age of the source, its history and size.
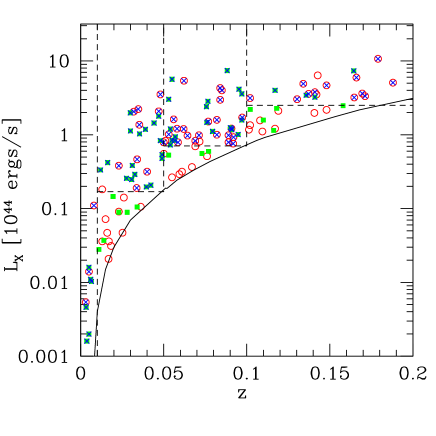
The issue of temperature increment can be investigated further by performing Monte Carlo simulations to be compared with the X-ray and radio luminosity distributions of the present sample. Possible biases due to the joint effects of the X-ray and radio selection functions (highlighted by the solid curves in the two panels of Figure 12), have been removed by limiting our analysis to four contiguous redshift regions which are complete both in X-ray luminosity and in 1.4 GHz radio power. In order to maximize the number of sources available for statistical analyses, these four regions in the space have been identified as follows:
| (5) |
– where X-ray luminosities are in erg/s and radio luminosities in W/Hz/sr – and are those enclosed within the dashed lines in Figure 12. 91 clusters in our dataset fulfill the above requirements (crosses in Figure 12), out of which 45 host sub-structured/extended radio sources (filled green squares with crosses on top in Figure 12).

Simulated samples in the space have been obtained by assuming that the cluster X-ray luminosity and radio luminosity of the central source are not correlated with each other. Each simulated object in the four regions considered in our analysis was then given a triplet of values , and , where the X-ray luminosity was assigned according to the Böhringer at al. (2002) cluster luminosity function as derived from the REFLEX cluster survey once their sample was corrected both for missing flux and flux error:
| (6) |
with , Mpc-3 and
erg/s, where .
Radio luminosities were instead drawn from the Dunlop & Peacock (1990) radio luminosity function for steep-spectrum sources (model 7 for pure luminosity evolution), proved to provide a very good fit to the local, AGN-fuelled, radio population (see e.g. Magliocchetti et al. 2002):
| (7) |
where , , Mpc-3 and where the evolving break luminosity can be expressed as (in W-1 Hz-1 units). Since the above expression was derived for an (EdS) universe, following Dunlop & Peacock (1990) we have rewritten equation (7) in the concordance CDM cosmology by using the relation:
| (8) |
where 1 and 2 refer to the old and new cosmology and is the volume element.
We performed 1000 Monte Carlo runs, where each run was set so to give the same number
of sources per redshift interval with
luminosities above the limits expressed in (5) as in the real dataset.
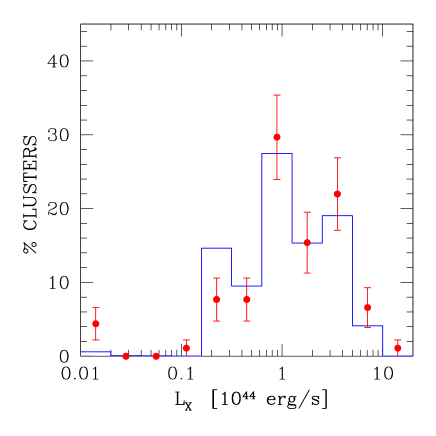
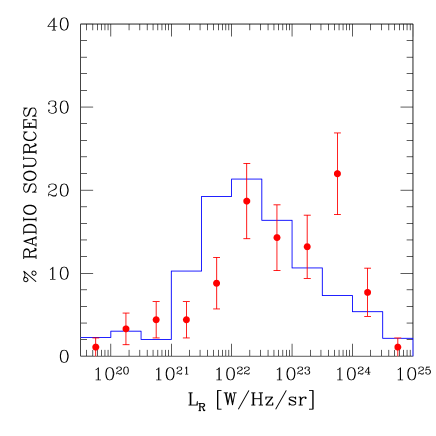
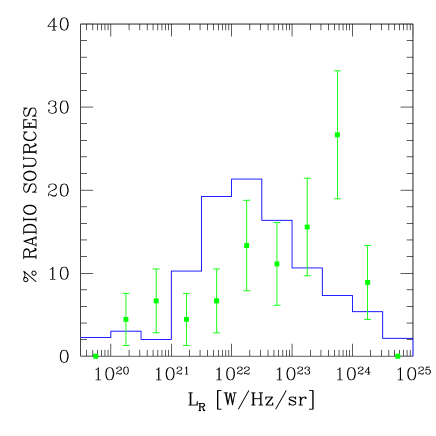
The luminosity distributions of X-ray-selected clusters inhabited by a radio-loud AGN are shown in Figures 13 and 14 which provide the fractional number of clusters per X-ray (left-hand panels) and 1.4 GHz luminosity (right-hand panels) for both real data (points with associated errorbars) and simulated sample (solid lines. Note that, due to the high number of realizations, these values are virtually error-free).
Two important conclusions can be drawn from the distributions shown in Figures 13 and 14 . First, the X-ray luminosity distribution of clusters with a central radio-active counterpart is virtually identical to that featured by the whole population of X-ray selected clusters brighter than the same flux limit. In other words, the presence of a central radio-loud component, however powerful, does not affect the cluster X-ray luminosity. This result is found regardless to whether the radio AGN shows an extended or point-like structure. If we then combine the above finding with what emerged from Sections 5.2 and 5.3, we can conclude that – mostly in the case of small mass systems – the interaction of extended radio sources with the surrounding environment causes a remarkable overheating of the available gas, heating which produces the steepening of the relation observed in Figure 7a. The contribution of AGN heating from a central radio source is less important i) in the case of point-like sources which are not observed to permeate the ICM and ii) – independent of the type of radio object – in the case of high mass systems which require additional forms of energy to balance radiative loss.
This is in agreement with the results displayed in Figure 11. Physically, it means that the radio sources displace only a small fraction of the X-ray luminous ICM so that there is no noticeable luminosity deficit in clusters with radio structure. However, simulations show that if a significant fraction of the jet energy is transferred into potential energy thus leading to an expansion of the cluster atmosphere, also the luminosity of the ICM decreases (see Heinz et al. 2006). Such simulations also suggest that a significant fraction of the jet energy is thermalised in the ICM on relatively short time scales. On long time scales, however, the energy injected into the ICM by radio galaxies must end up mostly as potential energy by the virial theorem, thus implying long-term temperature increments to be small. This indicates that our analysis is unveiling the short-term effects of radio-loud AGN heating. The extended radio structures in fact originate from recent AGN activity and are found in correspondence with ongoing heating in the ICM. On the other hand, those clusters with no extended structures have not had a recent (i.e. longer than the life time of a radio lobe) outbreak of radio-loud AGN activity and therefore show no signs of recent temperature increments.
While the X-ray luminosity of a typical cluster remains unaffected by the presence of a central radio-emitting component, our simulations clearly show that this is not the fate for the 1.4 GHz luminosity of a radio galaxy set at the bottom of the potential well of a cluster. In fact, the right-hand panels of Figures 13 and 14 highlight that there is a remarkable deficit of low-luminosity ( W/Hz/sr) radio sources when compared to the whole mJy population. At the same time, radio-loud AGN within the cluster centres seem to favour luminosities W/Hz/sr ( discrepancy from the results for the whole 1.4 GHz radio population). This different behaviour between the radio-luminosity distribution of real sources and of simulated data sets is found regardless of whether the central radio source presents an extended structure or not. This result implies a difference between the luminosity function of radio sources sitting in the cluster centres and that of the whole radio population, in the sense that the former one is much flatter at all luminosities W/Hz/sr. Indeed, Figure 4 of Best et al. (2007) clearly shows the different behaviour of the luminosity functions as derived for their sample of BCGs and in the more general case of radio sources associated to SDSS galaxies of different mass, even though the authors dismiss the evidence as ’tentative’.
The fact that low-luminosity radio sources are underrepresented in clusters is most likely due to the ’strangling’ effect caused by the overdense central regions of massive systems on radio objects that are not powerful enough to expand throughout the surrounding medium. On the other hand, if we combine the results presented in this section with the analysis performed in Section 5.1, we can conclude that extended structures and high radio luminosities are more likely to occur in sources that are located in rich environments such as groups or clusters of galaxies. This is likely caused by a tight interplay between the intracluster medium and the energy released by a central radio source, which boosts the radio luminosity of the latter one. Indeed, in agreement with our results, Barthel & Arnaud (1996) find that for a fixed jet kinetic power, radio luminosities can be higher in clusters due to the confining effect of the dense ICM which reduces losses due to adiabatic expansion in the radio lobes, therefore enhancing the radio synchrotron emission.
7 Conclusions
We have combined the REFLEX and NORAS cluster surveys with the NVSS dataset to provide a list of X-ray selected clusters brighter than erg s-1cm-2 which host in their centres () a radio source brighter than 3 mJy. Out of 550 clusters set in the whole sky north of , 148 systems (corresponding to per cent of the total sample) show signatures of central radio emission. We find that three systems were imaged both in REFLEX and NORAS in the overlapping region between the two surveys. By then removing double identifications we end up with a sample of 145 clusters that host a central radio source with mJy. Visual investigations of radio maps show that 61 of the radio objects (i.e. per cent of the sample) associated with cluster centres possess extended radio emission in the form of elongated blobs, double or triple/multiple structures. Archival data (mainly taken from the BAX and VIZIER databases) have provided extra information such as temperatures and velocity dispersions for some of the systems in our sample.
The main conclusions of our work can be summarized as follows:
-
(1)
Although the fraction of clusters that host a central radio source brighter than W/Hz/sr is approximately constant with cluster mass and equal to 20% (in agreement with the results of Best et al. 2007), we find that 11 out of 12 (i.e. 92 per cent) local/low-mass systems present central radio emission with luminosities W/Hz/sr. This suggests that, either, radio sources preferentially inhabit low-mass clusters, or – more likely – that by going deep enough in radio flux, most of X-ray selected clusters will be found to host a central radio-loud AGN.
-
(2)
The luminosity-temperature relation of clusters that host a central radio source follows that found for the whole cluster population ( – e.g. White, Jones & Forman 1997; Arnaud & Evrard 1999; Popesso et al. 2005). However, there is a significant discrepancy in the vs relation between unresolved and extended radio sources. The latter population shows the much steeper trend , while for unresolved structures one finds , which is close to the self-similar result. The difference between the vs trend for point-like and extended sources becomes particularly noticeable for temperatures KeV, where almost all systems with extended radio emission lie below those associated with unresolved radio structures.
-
(3)
The radio luminosities of the central sources show a steep () dependence on the cluster temperature for KeV. Such a correlation is lost in more massive systems.
-
(4)
The X-ray luminosity vs velocity dispersion and the temperature vs relations of our sample are in agreement with those found in the literature (; ; e.g. Popesso et al. 2005; Madhavi & Gheller 2001; Osmond & Ponman 2004). No significant differences are found between point-like and extended sources, except for a mild preference for the latter population to appear in higher velocity systems. We remark though that the available measurements do not allow us to probe the very low-mass regime where the different behaviour between point-like and extended sources could be more prominent.
-
(5)
The mechanical luminosity provided by the central radio source is found to balance radiative losses only in small (i.e. km/s) systems.
-
(6)
It seems plausible that heating by low-power (FR I) radio galaxies can explain the absence of cooling flows in clusters of galaxies. This is in agreement with conclusions by various other authors (e.g. Fabian et al. 2003; Croston et al. 2005), who concentrated their analysis on groups of galaxies. However, for the largest clusters, the energy released by the radio sources may not be sufficient to balance radiative losses.
-
(7)
Monte Carlo simulations show that the X-ray luminosity of a cluster is not affected by the presence of a central radio source, however powerful. The luminosity distribution of the present sample of radio-identified systems is the same as that of the whole cluster population. Combining this result with what we found in point (2), we can conclude that the presence of radio sources with an extended structure is responsible for the over-heating of the intracluster gas. The importance of such a heating dramatically increases in low-mass systems.
-
(8)
The luminosity distribution of radio galaxies sitting in cluster centres is very different from that of the total radio population. In fact, in the former case we find that low luminosities ( W/Hz/sr) are depressed, while higher luminosities are strongly boosted. The net effect on the radio luminosity function is a flattening in the whole luminosity range W/Hz/sr.
Our results support a strong interaction between AGN radio emission and the ICM. Radio sources are present in the centres of almost all local/small mass systems and we expect the majority of clusters to exhibit central radio emission with powers W/Hz/sr. The ICM strongly affects the luminosity of the radio source that sits in the cluster centre: low-luminosity objects are ’strangled’ by the overdense central medium, while bright ones have their luminosities boosted by the interaction with the surrounding gas (see e.g. Barthel & Arnaud 1996). Moreover, the existence of a central radio source – especially if it exhibits an extended structure and resides in small-mass systems – leads to a significant heating of the ICM.
Furthermore, radio-loud AGN are observed to provide enough mechanical energy to balance radiative losses. The effect of AGN heating from a central radio source becomes less important i) in the case of point-like sources which are not observed to permeate the ICM and ii) – independent of the type of radio object – for high mass systems. Clusters hotter than KeV, do not obey the tight vs relation observed for small systems, the effect on the thermal state of the cluster as provoked by the presence of a radio-active AGN is independent of the capabilities of such an object to permeate the surrounding medium (no difference in the relation between extended and point-like sources) and AGN heating is found to be insufficient to balance radiative losses in the cluster. In this case, a different source of heating such as thermal conduction (e.g. Narayan & Medvev 2001; Voigt & Fabian 2004) has to be invoked.
The data suggest a smooth transition between the radio-AGN heating mode and the thermal conduction mode. Indeed, double heating models – first developed by Ruszkowski & Begelman (2002) – have been proved to provide a good agreement with the observed cluster properties (see e.g. Brüggen et al. 2003; Hoeft & Brüggen 2004; Roychowdury et al. 2005; Fujita & Suzuki 2005). Within this framework, Hoeft & Brüggen (2004) have shown the relative importance of heating due to thermal conduction to increase with cluster mass, in excellent agreement with our findings.
Obviously, it would be desirable to push
this kind of analysis to fainter fluxes
(both radio and X-ray) and higher redshifts to investigate whether some of our findings
only hold in the local universe or are more general properties of the cluster population.
Forthcoming surveys like COSMOS (see e.g. Finoguenov et al. 2007) are expected to
provide such answers.
Acknowledgments
MM wishes to thank S.Borgani, A.Merloni, P.Rosati & G. De Zotti for
discussions and clarifications which greatly helped shaping up this work.
MB wishes to acknowledge the support by the DFG grant BR 2026/4 within the Priority Program
“Witnesses of Cosmic History” and the supercomputing grants NIC 1927
and 1658 at the John-Neumann Institut at the Forschungszentrum
Jülich. We thank the referee for helpful comments.
References
- [Allen1998] Allen S.W., Fabian A.C., 1998, MNRAS, 297, 57
- [Arnaud1999] Arnaud M, Evrard A.E., 1999, MNRAS, 305, 631
- [Beck1995] Becker R.H., White R.L, Helfand D.J., 1995, ApJ, 450, 559
- [Best12005] Best P.N., Kauffmann G., Heckman T.M., Brinchmann J., Charlot S., Ivezic Z., White S.D.M., 2005, MNRAS, 362, 25
- [Best22006] Best P.N., Kaiser C.R., Heckman T.M., Kauffmann G., 2006, MNRAS, 368, 67
- [Best2007] Best P.N., von der Linden A., Kauffmann G., Heckman T.M., Kaiser C.R., 2007, astro-ph/0611197
- [Birzan2004] Birzan L. Rafferty D.A., Mc Namara B.R., Wise M.W., Nulsen P.E.J., 2004, ApJ, 607, 800
- [Borgani2001] Borgani S., et al. 2001, ApJ, 561, 13
- [Borgani12001] Borgani S., et al. 2001a, ApJ, 559, L71
- [Borgani22004] Borgani S., et al. 2004, MNRAS, 348, 1078
- [Borgani32005] Borgani S., Finiguenov A., Kay S.T., Ponman T.J., Springel V., Tozzi P., Voit G.M., 2005, MNRAS, 361, 233
- [B02000] Böhringer H., et al., 2000, ApJSS, 129, 435
- [B012002] Böhringer H.,Matsushita k., Churazov E., Ikebe Y., Chen Y., 2002, A&A, 382, 804
- [B2004] Böhringer H., et al., 2004, A&A, 425, 367
- [Bru2001] Brüggen M., Kaiser C.R., 2001, MNRAS, 325, 676
- [Bru12002] Brüggen M., Kaiser C.R., 2002, Nat, 418, 301
- [Bru32003] Brüggen M., 2003, ApJ, 593, 700
- [Bru42005] Brüggen, M., Ruszkowski, M., & Hallman, E., 2005, ApJ, 630, 740
- [Bryan2000] Bryan G.L. 2000, ApJ, 544, L1
- [Chen2007] Chen Y., Reiprich T.H., Böhringer H., Ikebe Y., Zhang Y.-Y., 2007, astro-ph/0702482
- [chur12001] Churazov E., Brüggen M., Kaiser C.R., Böhringer H., Forman W., 2001, ApJ, 554, 261
- [chur2003] Churazov E., Formann W., Jones C., Böhringer H., 2003, ApJ, 590, 225
- [Condon1998] Condon J.J., Cotton W.D., Greisen E.W., Yin Q.F., Perley R.A., Taylor G.B., Broderick J.J. 1998, AJ, 115, 1693
- [Cro2005] Croston J.H., Hardcastle M.J., Birkinshaw M., 2005, MNRAS, 357, 279
- [DP1990] Dunlop J.S., Peacock J.A., 1990, MNRAS, 247, 19
- [Dunn2006] Dunn R.J.H. & Fabian A.C., 2006, MNRAS, 373, 959
- [Eke1998] Eke V.R., Cole S., Frenk C.S., Henry J.P., 1998, MNRAS, 298, 1145
- [Fabian2003] Fabian A.C., Sanders J.S., Allen S.W., Crawford C.S., Iwasawa K., Johnstone R.M., Schmidt R.W., Taylor G.B., 2003, MNRAS, 344, L43
- [Fabian22006] Fabian A.C., Sanders J.S., Taylor G.B., Allen S.W., Crawford C.S., Johnstone R.M., Iwasawa K., 2006, MNRAS, 366, 417
- [Fabian12004] Fabian A.C., 2004, ARA&A, 32, 277
- [Fin2007] Finoguenov A. et al. 2007, astro-ph/0612360
- [For2005] Forman W. et al., 2005, ApJ, 635, 894
- [Frenk1999] Frenk C.S., et al., 1999, ApJ, 525, 554
- [Fu2005] Fujita Y., Suzuki T.K., 2005, ApJ, 630 L1
- [Heinz et al.(2006)] Heinz, S., Brüggen, M., Young, A., & Levesque, E. 2006, MNRAS, 373, L65
- [held2000] Heldson S.F., Ponman T.J., 2000a, MNRAS, 315, 356
- [held12000] Heldson S.F., Ponman T.J., 2000b, MNRAS, 319, 933
- [hoft2004] Hoeft M., Bruggen M., 2004, ApJ, 617, 896
- [jetha2007] Jetha N.N., Ponman T.J., hardcastle M.J., Croston J.H., 2007, astro-ph/0612350
- [kaiser1986] Kaiser N., 1986, MNRAS, 222, 323
- [mahdavi2000] Mahdavi A., Böhringer H., Geller M.J., Ramella M., 2000, ApJ, 534, 114
- [mahdavi12001] Mahdavi A., Geller M.J., 2001, ApJ, 554, L129
- [maglio12002] Magliocchetti M. et al. (the 2dfGRS Team), 2002, MNRAS, 333, 100
- [mark1998] Markevitch M., 1998, ApJ, 504, 27
- [Mc2005] McNamara B.R., Nulsen P., Wise M.W., Rafferty D.A., Carilli C., Sarazin C.L., Blanton E.L., 2005, Nature, 433, 45
- [Narayan2001] Narayan R., Medvedev M.V., 2001, ApJ, 562, L129
- [Nulsen2005] Nulsen P., McNamara B.R., Wise M.W., Davis L.P., 2005, ApJ, 628, 629
- [osmond2004] Osmond J.P.F., Ponman T.J., 2004, MNRAS, 350, 1511
- [pet2001] Peterson J.R. et al. 2001, A&A, 365, L104
- [pet12003] Peterson J.R. et al., 2003, ApJ, 590, 207
- [piff2005] Piffaretti R., Jetzer P., Kaastra J.S., Tamura T., 2005, A&A, 433, 101
- [poin12006] Pointecouteau E., Arnaud M., Pratt G.W., 2005, Advances in Space Research, 36, 659
- [pon11999] Ponnman T.J., Cannon D.B., Navarro J.F., 1999, Nature, 397, 135
- [pon21999] Ponnman T.J., Sanderson A.J.R., Finoguuenov A., 2003, MNRAS, 343,331
- [pop2005] Popesso P., Biviano A., Böhringer H., Romaniella M., Voges W., 2005, A&A, 433, 431
- [pratt2005] Pratt G.W., Arnaud M., 2005, A&A, 429, 791
- [RS1977] Raymond J.C., Smith B.W., 1977, ApJS, 35, 419
- [Roy2005] Roychowdury S., Ruszkowski M., Nath B.B., 2005, ApJ, 634, 90
- [Rutz2003] Ruszkowski M., Begelman M.C., 2002, ApJ, 581, 223
- [Rutz12004] Ruszkowski, M., Brüggen, M., & Begelman, M. C., 2004, ApJ, 611, 158
- [san2004] Sanderson A.J.R., Finoguenov A., Mohr J.J., 2004, ApJ, 630, 191
- [Simionescu et al.(2006)] Simionescu, A., Böhringer, H., Brüggen, M., & Finoguenov, A. 2006, ArXiv Astrophysics e-prints, arXiv:astro-ph/0610874
- [str2004] Strauss M.A. et al., 2002, AJ, 124, 1810
- [Tamura2001] Tamura T. et al., 2001, A&A, 365, L87
- [Tozzi2001] Tozzi P., Norman C., 2001, ApJ, 546, 63
- [vilk2006] Vikhlinin A., Kravtsov A., Forman W., Jones C., Markevitch M., Murray S.S., Van Speybroeck L., 2006, ApJ, 640, 691
- [Voges1999] Voges W. et al., 1999, a&A, 349, 389
- [Voit2001] Voit G.M., Bryan G.L., 2001, Nature, 414, 425
- [Voigt2004] Voigt L.M., Fabian A., 2004, MNRAS, 347, 1130
- [Von2007] Von der Linden A., Best P.N., Kauffmann G., White S., 2007, astro-ph/0611196
- [White11991] White S.D.M., Frenk C.S., 1991, ApJ, 379, 52
- [White1997] White D.A., Jones C., Forman W., 1997, MNRAS, 292, 419
- [Wu1999] Wu X.-P., Xue Y.-J., Fang L.-Z., 1999, ApJ, 524, 22
- [Wu12002] Wu X.-P., Xue Y.-J., 2002, ApJ, 569, 112
- [Xue2000] Xue Y.-J., Wu X.-P., 2000, ApJ, 538, 65