The interplay of university and industry through the FP5 network
Abstract
To improve the quality of life in a modern society it is essential to reduce the distance between basic research and applications, whose crucial roles in shaping today’s society prompt us to seek their understanding. Existing studies on this subject, however, have neglected the network character of the interaction between university and industry. Here we use state-of-the-art network theory methods to analyze this interplay in the so-called Framework Programme—an initiative which sets out the priorities for the European Union’s research and technological development. In particular we study in the 5th Framework Programme (FP5) the role played by companies and scientific institutions and how they contribute to enhance the relationship between research and industry. Our approach provides quantitative evidence that while firms are size hierarchically organized, universities and research organizations keep the network from falling into pieces, paving the way for an effective knowledge transfer.
pacs:
05.10.-a, 89.65.-s, 89.75.-kWe address, from a Complex Networks viewpoint, the relationship between companies and scientific institutions and how they contribute to reduce the distance between research and applications. Since this approach requires information about real systems, we focus on the Framework Programme (FP)—an initiative which sets out the priorities for the European Union’s research and technological development. Despite the presence of many and different participants, they can be split in basically two groups: Companies and Universities. The first one is made of companies or other industry related participants who expect that their investments in R+D+I are profitable. The second group can be thought as the opposite: participants involved in some type of academic research for whom results do not necessarily return income. We find that the transmission of information is more efficient between Universities than among Companies. Furthermore, when Universities are excluded from the projects, Companies tend to form clusters, turning difficult (if not impossible) the communication between them. Likewise, if we pay attention to the evolution of the FP, we see that, although the creation of collaborations is encouraged, it is mainly between Universities and this is insufficient to improve the relationship between research and industry. Finally, we find that Companies and Universities differ in the way they establish collaborations. Large corporations are reluctant to choose as partners small companies, whereas size is not important between Universities. But if we analyze how Universities and Companies cooperate, the result is that large Universities prefer working with large Companies, while Companies select their collaborators between Universities regardless of their sizes. These findings have potential implications for future programmes, as well as for new policies and services aiming at research, development and innovation in general.
I Introduction
Understanding the relationship between research and industry is essential to improve the quality of life in any modern society. Ranging from faster application of new discoveries to knowing whether or where investment should be employed, this flow of knowledge between research and industry has long been of general interest. Yet, knowledge is a very special resource whose study demands new techniques. The traditional approach to resources is based on the concept of scarcity since they are usually finite. But knowledge cannot be seen this way because it grows, and the more it is used the more it spreads amidon . In addition, existing studies on the research and industry interplay branscomb ; caloghirou ; krahmer have neglected its network character. Our approach consists in analyzing this issue from a complex network viewpoint albert02 . Many other systems are better understood in this manner guimera05 ; jeong00 ; mendes03 ; newman04sci . In this approach, the interaction between research and industry is best described as a network whose vertices (or nodes) represent either companies or institutions devoted to research, and each edge (or link) represents collaboration between any two of them. Hence, we can quantitatively study how research and industry influence each other, if we have access to data describing a real system.
Here, we focus our attention in the so-called Framework Programme (FP), a mechanism aiming to improve the transference of knowledge in the European Union (EU) by setting out its priorities for research and technological development. The data to generate the corresponding FP network were gathered from the CORDIS website cordis by a robot. Since, currently, the 6th programme is under execution and the 7th is being planned, we focused our study in the 5th Framework Programme (FP5)—covering the period from 1998 to 2002—in order to analyze a completely finished programme. Despite the presence of more than participants, they can be split in two major groups: Companies and Universities. The first is made of over companies and other industry related participants who expect their investments in R+D+I to be profitable. The second group can be regarded as the opposite, more than participants involved in some type of research for whom results do not necessarily return immediate income (see Appendix). Exploring the relationship between these two groups not only provides a good example of the interplay between structure and information flow, but also offers a glimpse on how research links with innovation and if the distance between basic research, applications and products reduces wigzell .
It is worth remarking that we are mainly interested in the capacity of the FP5 to create and transfer information and nothing can be said about this issue inside each node. Notice that some participants are large institutions or companies with complex organization charts, which may have several projects whose coordination cannot be guaranteed in general. However, our main concern is how to set the means to integrate research, development and innovation efficiently, not if these means are successfully used.
II Analysis of the data
To characterize the FP5, in this section we compute five important features in any network: degree distribution, shortest path distribution, betweenness centrality, clustering coefficient and the degree–degree correlation. The detailed description of the dataset can be found in the Appendix.
II.1 Degree distribution
The probability that a University collaborates with other Universities (i.e., the degree distribution of the Universities) decays as a power law, with . Similarly, Companies follow a power law with . The two distributions can be seen in Fig. 1, where a log–log scale is used in the plot, providing evidence for the scale–free topology barabasi99 of both networks. The degree distribution of the whole FP5 network is also well approximated by a power law with exponent close to almendralPhysA .
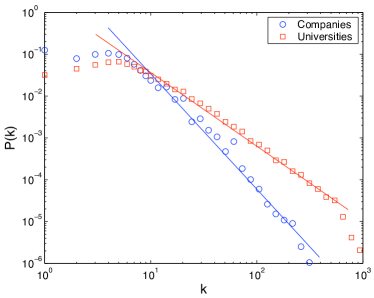
Note that the degree distribution of Universities is described by a power law with , implying that their mean degree grows in time. Indeed the first moment (i.e. mean degree in this case) of a distribution with a power–law tail diverges when its exponent is less than 2. This result suggests that Universities form an accelerated growing network mendes02 , where the total number of edges grows faster than a linear function of the total number of vertices and, consequently, it is verified that .
To elucidate this issue, we computed the average degree during several years to check its tendency. Though we only have the data corresponding to years (table 1), they are enough to confirm the existence of an accelerated growth since the average degree is not constant (46% increase for the network of Universities in the four year period). But if the collaborations grow faster than proportional to the number of participants, it is because they do not emerge by the mere increase of participants. Not only new participants contribute to increase the number of collaborations, but also the old ones, meaning that some form of synergy exists encouraging the creation of new collaborations between Universities.
On the other hand, the average degree of Companies also grows (though significantly slower) during the four year span of the dataset (table 1). However, the fact that suggests that this increase should be transient. Therefore, although the creation of collaborations is encouraged (since when the FP5 was finished the mean number of collaborations had risen from to and some participants had surpassed collaborations) these results reveal that the synergy is more pronounced between Universities. In this sense, the FP5 is less effective in improving the network of Companies and Universities seem to take more advantage of this opportunity to create new collaborations.
Also noticeable in table 1 is the fact that the number of Companies increases faster than the number of Universities (72% and 64% increase respectively in the four year period), indicating another difference in the evolution of both networks.
| Year | Univ–Comp | Univ–Comp | Univ–Comp |
|---|---|---|---|
| 1999 | 3075–4658 | 17.2–6.2 | 0.65–0.58 |
| 2000 | 5377–9359 | 21.9–6.8 | 0.66–0.53 |
| 2001 | 7355–13905 | 27.7–7.9 | 0.67–0.53 |
| 2002 | 8522–16765 | 31.9–8.2 | 0.68–0.59 |
II.2 Shortest paths
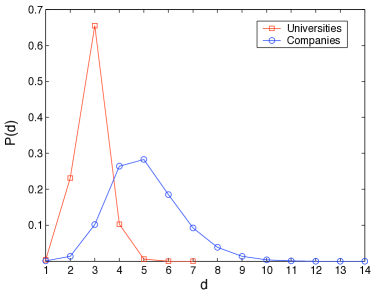
A path between two participants is defined as a sequence of edges which links them, the distance between them being the number of edges in the shortest path. Defining the set of participants which can be linked through a path as a connected component, we find that the largest connected component of Universities spans of the network ( vertices) while for Companies it is made of nodes (). Hence, while almost all Universities are linked in only one component, Companies are more fragmented and one third of them fall in other smaller components (actually, the second biggest component contains only participants). This result shows that Universities are important to compact the network since the largest connected component of the complete network (U+C) comprises of the Companies and of the Universities (i.e. vertices in total). In addition, the largest distance in the network of Universities is and the average distance is whereas, in the case of Companies, the farthest pair is separated by edges and the average distance is randgraph . This can be seen in Fig. 2 where we plot the distance distribution, versus . Hence, also here Universities are essential for Companies since the largest distance in the entire network is only and the average distance is , which implies that, on average, there are only two intermediaries between two participants.
The average distance is a coarse characteristic though. As a finer measure, it is possible to compute the average distance of a vertex of degree to all other vertices in the largest component oliveira04 . In Fig. 3 we plot for both networks on a log–linear scale, where the Y axis means and the X axis is .

Therefore, albeit both networks display the so-called small–world effect strogatz01 , there are important differences. The presence of Universities eases the flow of information since they are much closer to each other than Companies. This could be expected since the main purpose of a company is to satisfy its shareholders, which does not include the spread of information from which competitors can take advantage. But, interestingly, the consequences of this fact go beyond. When Universities are excluded from the projects, Companies become isolated despite Universities are only one third of the participants. Companies tend to form clusters, turning difficult (if not impossible) the communication between them and, consequently, little can be developed or innovated since other results are not available to work with. Thus the natural tendency of Companies to protect their findings would finish killing R+D+I. The presence of Universities contributes to moderate this.
II.3 Betweenness centrality
To further investigate the interplay between the two kinds of participants, we can also measure the betweenness centrality freeman77 in the FP5. The betweenness of vertex measures the extent to which lies on the paths between other participants. It therefore accounts for the influence of a participant between other two distant participants, relating the local structure and the global topology of the network. It is defined as
where is the number of shortest paths between nodes and , is the number of such shortest paths passing through vertex , and the sum is taken over all pairs of vertices and which do not include . The pre-factor, where is the total number of nodes, accounts for normalization, so that .
Since the computation of the betweenness for the whole FP5 is an extremely time-consuming task, we focus our study on one of its subprograms: ‘Promotion of innovation and encouragement of small and medium sized enterprises participation’ (SME), which is formed by research institutions and Companies (see Appendix). Given our ability to split the SME into Universities and Companies, several different situations are considered. The average betweenness of the SME, taken over all its vertices, turns out to be . Considering only those vertices which are Universities, we find that their average betweenness among all other vertices in the SME is . Likewise, we obtain for Companies.
Now, if we only take into account those shortest paths whose endpoints are Companies, the betweenness measures the role Universities play in linking Companies: ; on the other hand, when the endpoints are Universities, the average betweenness of Companies is . Thus, we see that the role Universities play between Companies is more than twice the one played by Companies between Universities. Moreover, given that , we observe again the central function played by research institutions in the FP5 network.
II.4 Clustering coefficient
The clustering coefficient of a vertex is defined as , where is the number of edges connecting its nearest neighbors. It equals for a participant at the center of a completely connected cluster, and for a node whose neighbors are not linked at all. Taking the average of the clustering coefficient, we obtain for Universities and for Companies, which are much higher than the average clustering coefficient of a random graph bollobas85 with the same number of nodes and average degree (namely, ). Moreover, is independent of the number of participants in both cases (see table 1), in contrast with the prediction of a scale–free model barabasi99 where albert02 ; bollobas03 . This high and size–independent average clustering coefficient evidences the organization of Universities and Companies in modules.
However, when we measure the clustering coefficient of a node with links, , for both networks (Fig. 4), we find that it decays as a power law for large . We therefore infer that the two nets have hierarchical modularity, which is characterized by the scaling law , in contrast to some scale–free or modular networks where the clustering coefficient is degree–independent barabasi02 .
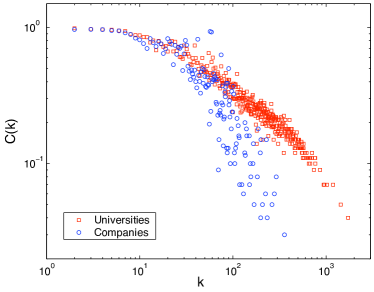
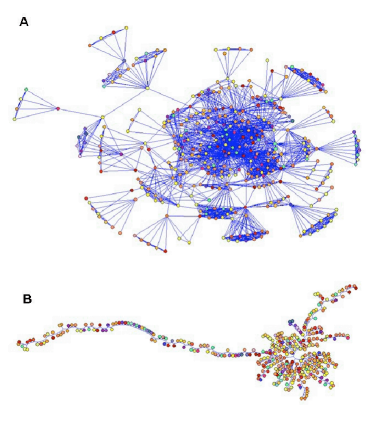
This result suggests that Universities and Companies have an inherent self–similar structure makse05 , being made of many highly connected small modules, which integrate into larger modules, which in turn group into even larger modules (Fig. 5A). Actually, we observe that Universities () and Companies () have , indicating the presence of many totally connected groups. This is due to the fact that most of these entities participate in only one project, having as neighbors other vertices, which in turn are all connected between them by virtue of the participation in the project. Furthermore, given that this result suggests weak geographical constraints barabasi03 , we searched for communities in them newman04pre and found precisely that they were not based on nationality (Fig. 5B), whence, the FP is successfully applying a policy which avoids its segregation by nationality.
II.5 Degree–degree correlation
An interesting question is which vertices pair up with which others. It may happen that vertices connect randomly, no matter how different they are. Usually, however, there is a selective linking, i.e. there is some feature which makes more (or less) likely the connection newman03rev . There is assortative mixing when vertices of similar degree tend to be connected, and disassortative mixing in the opposite case (i.e. when vertices of high degree tend to connect to vertices of low degree) newman02 ; newman03pre .
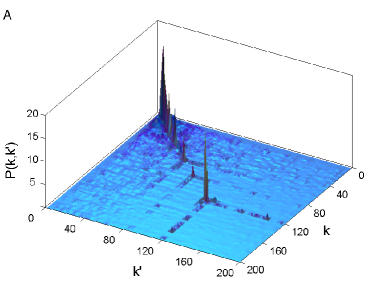
A first approach to elucidate this issue is by means of the joint degree–degree distribution , which gives us the probability of finding an edge connecting vertices of degree and . We see that for Companies the distribution has sharp peaks for (Fig. 6A). This network thus seems to display assortative mixing, i.e. if one chooses at random a vertex of degree then, with considerable probability, it will be connected to vertices of degree . In other words, Companies with similar degree tend to collaborate more frequently than Companies with different degrees.
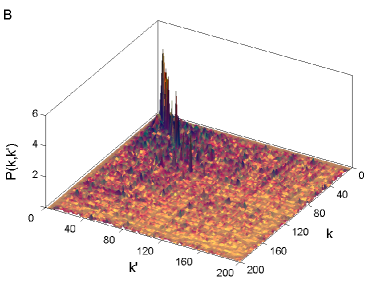
Notice that the fact (mentioned in the previous section) that many entities participate in only one project may, by itself, explain these peaks: If the participants of a certain project have no other projects each of them has degree and each of their neighbors has degree , giving rise to an assortative trend. On the other hand one can also argue that, when a Company has high degree it is due to being involved in many projects. It is then reasonable to assume that nodes with high degree represent large institutions, given that only these can deal with many projects at the same time. That being the case, the observed assortativity means that the spread of information between Companies depends on the institution’s size. On the contrary, for Universities is scattered throughout the plane (Fig. 6B). While there are still peaks along the line , the presence of many others for is clear, suggesting that Universities are less selective in what regards the size of their partners.
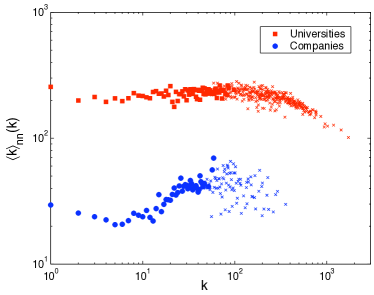
It is important to remark, however, that the joint degree–degree distribution requires many observations in order to obtain good statistics. For example, if we focus our analysis in the range , we need about points, otherwise fluctuations are important and the plot is far from smooth boguna04 . To avoid this problem, one uses the average degree of the nearest neighbors of a vertex of degree , , which is a coarser but less fluctuating measure. To compute it, we find all participants with links and take the average degree of all their neighbors. The results are shown in Fig. 7, and confirm those obtained through the joint degree–degree distributions. To emphasize the presence of the cut–off due to the finite size of the network, the points obtained from less than observations are plotted as crosses (Universities in red and Companies in blue) and the rest of the points as squares (Universities) or circles (Companies). Considering then only the circles and the squares, we confirm that collaborations between Companies are size–dependent (positive slope) whereas those between Universities are not (no slope).
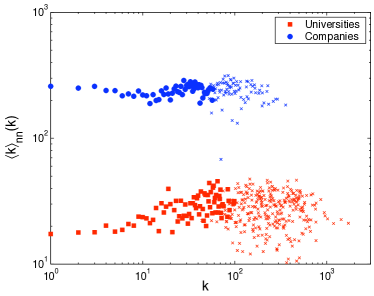
It is also interesting to analyze how Universities and Companies link each other, which can be done as follows. We search for all Companies with links and then compute the average degree of all their neighboring Universities. Note that the former degrees are always calculated in the corresponding network, thus a Company with degree has neighbor Companies, though it may have more links (to Universities) in the complete FP5 network. Analogously, we can find all Universities with links to average the degrees of all neighbor Companies. The results are depicted in Fig. 8 where, as before, it is used a scale. Again, we plot as squares (Universities) or circles (Companies) the points obtained from more than observations to identify the region where the tendency is well defined. We find that, while Companies link to Universities independently of their sizes, Universities with high degree tend to collaborate with large Companies.
Finally, another way to quantify the mixing in the FP5 is by means of the assortativity coefficient newman02 , which is just the Pearson correlation coefficient of the degrees of connected vertices. In this case, we obtain what type of mixing takes place in the network by means of a single number instead of a distribution. If is the probability that a randomly chosen edge has vertices with degree and at either end, the assortativity coefficient takes the following form:
where and . This coefficient verifies that , being positive when the network is assortative and negative when it is disassortative. We find for the network of Companies and for Universities, corroborating an assortative trend usual in social networks newman03pre .
Therefore, Companies and Universities differ in the way they establish collaborations. Companies are organized hierarchically, where positions in that hierarchy are related to the size: The assortative trend in the network of Companies suggests that large corporations are reluctant to choose as partners small companies. Between Universities, however, size is not important and it is common to find a large institution collaborating with a small one. But if we analyze which partners Universities choose among Companies, we check that large institutions in Universities prefer working with large Companies. On the contrary, Companies select their collaborators between Universities regardless of their sizes. We can then conclude that large Companies play indeed a leading role in the FP5 while Universities play the role of bridges between participants which are separated in the hierarchical structure of Companies.
III Conclusion
We have presented here a study of the interplay between research and industry in the scope of the Fifth Framework Programme. Using network theory methods, we perform several measures that allow us to quantify the features of this relationship and assess their potential improvements. Naturally, the FP5 network does not include all interactions between university and industry (such as the recruitment of graduates by companies, the transfer of knowledge through scientific and technical literature or industry conferences). Furthermore, as already mentioned in the introduction, it also neglects the fact that internal connections in an institution (e.g. between different departments) may be absent, which would mean that a node in the studied network would split into disconnected nodes. While these issues may significantly influence the flow of information in the network, addressing all of them requires information that is beyond reach for most researchers at this point. The presented analysis thus represents a starting point for a quantitative understanding of the university–industry interplay network. It is possible, however, to foresee advances in these directions, given the increasing availability of information on how institutions self-organize.
The results point to the central function played by Universities in the FP5 network in reducing the distance between research and applications. Indeed, we show that Universities play a crucial role in connecting the network of Companies, which would otherwise be separated in many small clusters. While the network of Universities is well integrated and established in accordance to what is observed for other social networks, the same doesn’t seem to apply for the Companies network, mainly due to its relatively small largest connected component. Competition is probably the origin of this effect, which is moderated by the presence of Universities. It seems reasonable, then, to conclude that special attention should be devoted to company–company collaborations. Supporting this, is also the fact that new collaborations arise at a higher rate between Universities.
Our observations suggest in addition that Companies and Universities establish collaborations differently: While Companies seem to exhibit a hierarchical structure in terms of their size, Universities are less selective in their collaborations. We also observed that both networks display hierarchical modularity and that communities in the FP5 network are not nation-based. The FP appears then to mix all nationalities of the European Union, thus reaching one of its main goals: Promote the transfer of knowledge throughout Europe.
ACKNOWLEDGMENTS
J.A.A., L.L., and M.A.F.S. acknowledge financial support from the Spanish Ministry of Science and Technology under project number BFM2003-03081 and project FIS2006-08525. J.G.O. acknowledges financial support from FCT Portugal (SFRH/BD/14168/2003). J.F.F.M. was partially supported by projects POCTI (FAT/46241/2002 and MAT/46176/2002) and project DYSONET.
APPENDIX: CLASSIFICATION OF PARTICIPANTS INTO COMPANIES AND UNIVERSITIES
The Framework Programme (FP) sets out the priorities for the European Union’s research and technological development. These priorities are defined following a set of criteria which pursue an increase of the industrial competitiveness and the quality of life for European citizens. A fact which shows the effort made by the European Union to promote this global policy for knowledge is the budget devoted to these programmes. For example, the FP5 (1998-2002) was implemented by means of 13,700 million euros and the FP6 (2002-2006) has assigned a budget of 17,883 million euros.
All projects in the FP5 are organized in eight specific programmes which can be classified as follows. There are five focused Thematic Programmes implementing research, technological development and demonstration activities:
-
•
QOL: Quality of life and management of living resources (2,524 projects).
-
•
IST: User–friendly information society (2,382 projects).
-
•
GROWTH: Competitive and sustainable growth (2,014 projects).
-
•
EESD: Energy, environment and sustainable development (1,772 projects).
-
•
NUKE: Research and Training in the field of Nuclear Energy (1,032 projects).
And there are three Horizontal Programmes to cover the common needs across all research areas:
-
•
INCO: Confirming the international role of Community research (1,034 projects).
-
•
SME: Promotion of Innovation and encouragement of small and medium enterprises participation (142 projects).
-
•
HPOT: Improving human research potential and the socio–economic knowledge base (4,876 projects).
The data to analyze the FP5 as a complex network were obtained from the web pages of CORDIS cordis with a robot implemented in Perl. The result was a database with 15,776 records as follows:
Programme Year Participant1 - Nation - Dedication Participant2 - Nation - Dedication …
The first field refers to the specific programme to which the project belongs and the second field informs us about the year in which it started. The following fields are the participants in the project with their corresponding nationality and dedication (‘research’, ‘education’, ‘industry’…). We then have a bipartite graph albert02 ; mendes02 since there are two kinds of vertices (participants and projects) and each edge links a participant with a project. To obtain the graph with 25,287 participants (nodes) and 329,636 collaborations (edges) used throughout the text, we have only to project it onto the participants.
The names of the participants were not free of typos since we collected them as they were in the web. The consequence of this fact was that sometimes the same participant appeared in two projects with different names and, consequently, it was recorded twice in the data. For instance, ‘François Company of Something, Ltd.’ and ‘Francois Company of SOMETHING LTD’ would be recorded as different. To avoid these duplications, we used a parser covering many possibilities which could lead to false entries. Nevertheless, despite our efforts, not all duplications have been eliminated. However, after a visual inspection of the data, we estimate that the error is below 10%.
To split the participants in Universities and Companies, we considered the organization type reported in the project. This information is encoded in the field ‘Dedication’, where we found 11 levels: ‘Commission External Service’, ‘Commission Service’, ‘Consultancy’, ‘Education’, ‘Industry’, ‘Non Commercial’, ‘Not Available’, ‘Other’, ‘Research’, ‘Technology Transfer’ and .
The level ‘Not available’ means that the FP itself was not able to obtain the information and this absence is shown in this manner. In addition, the level means that no information at all is given, i.e. our robot found nothing (not even ‘Not Available’).
The first step to define only two groups was to reduce the number of levels in ‘Dedication’. We found that eight levels could be merged to define a new one, called ‘Non Companies’. It was not homogeneous since we found consultancies, universities, hospitals, institutes, laboratories, observatories, museums, technological parks even cities. However, they all were participants involved in some type of research for whom results do not necessarily return income. This new level was, basically, the union of ‘Research’ and ‘Education’ since the other six levels appeared few times in the data: ‘Commission External Service’ (4 records), ‘Commission Service’ (8 records), ‘Consultancy’ (49 records), ‘Non Commercial’ (389 records), ‘Technology Transfer’ (1 record) and (1 record). The record with was identified as ‘Non Company’ by direct inspection.
Therefore, all records could be classified in one of the following levels: ‘Non Companies’ (41,317), ‘Industry’ (6,447), ‘Other’ (17,588) and ‘Not Available’ (12,346). The total number of records (77,698) is larger than the number of participants (25,287) since many of them collaborate in several projects. Then, it was necessary to verify if repeated records were always classified in the same level of ‘Dedication’.
We found that many participants were classified in different levels, thus we had to define a set of rules which eliminated this ambiguity. Hence, the following step was to study each level to understand their composition. For every level, we chose 100 records randomly to check by direct inspection their dedication. The result was that all selected records in ‘Industry’ were companies, any in ‘Non Companies’, 95 in ‘Other’ and 55 in ‘Not Available’.
With the former information, we proceeded as follows. We first defined for each participant a vector D={‘Non Companies’, ‘Industry’, ‘Other’, ‘Not Available’}, where the components are the number of times that it is classified in that level. For instance, D={17, 0, 8, 4} means that the participant appears 17 times as ‘Non Company’, 8 as ‘Other’ and 4 as ‘Not Available’. Then, we decided that vectors in the form {a, 0, 0, 0} or {a, 0, 0, d} were Universities and vectors in the form {0, b, c, d}, {0, b, c, 0}, {0, b, 0, d} and {0, b, 0, 0} were Companies. With only these sensible rules, we managed to classify 22,001 participants (87%).
In order to confirm this result and to classify the remaining 3,286 entities, we defined a filter based in keywords relative to the Universities group, such as ‘univer’, ‘schule’, ‘laborato’… When we focused our attention in the group of 22,001 participants classified using ‘Dedication’, we found that those classified as Universities according to the filter were also Universities according to ‘Dedication’. Since the filter was a completely different manner of splitting the dataset, we could use it for the rest of the entries. Note that we only believed the result of the filter if it was University, not if the result was Company. This is reasonable since the filter was designed to identify terms related to Universities, not to Companies.
By means of the filter we classified all participants but 309. To place these entities, we paid attention to which value was higher: ‘Non Companies’ or ‘Industry’, independently of the other two values. If the value ‘Non Companies’ was higher, it was a University, otherwise it was a Company.
References
- (1) D. Amidon, Baltic Dynamics 2004 Conference, Riga (2004).
- (2) L. M. Branscomb, F. Kodama, and R. L. Florida, Industrializing Knowledge: University-Industry Linkages in Japan and the United States (MIT Press, Cambridge, 1999).
- (3) Y. Caloghirou, A. Tsakanikas, and N. S. Vonortas, “University-Industry Cooperation in the Context of the European Framework Programmes”, Journal of Technology Transfer 26, 153 (2001).
- (4) F. Meyer-Krahmer and U. Schmoch,“ Science-based technologies: university-industry interactions in four fields”, Research Policy 27, 835–851 (1998).
- (5) R. Albert and A.-L. Barabási, “Statistical Mechanics of complex networks”, Rev. Mod. Phys. 74, 47–97 (2002).
- (6) R. Guimerà and L. A. N. Amaral, “Functional cartography of complex metabolic networks”, Nature 433, 895–900 (2005).
- (7) H. Jeong, B. Tombor, R. Albert, Z. Oltvai, and A.-L. Barabási, “The large-scale organization of metabolic networks”, Nature 407, 651–654 (2000).
- (8) S. N. Dorogovtsev and J. F. F. Mendes, Evolution of Networks: from Biological Nets to the Internet and WWW (Oxford University Press, Oxford, 2003).
- (9) J. Balthrop, S. Forrest, M. E. J. Newman, and M. M. Williamson, “Technological Networks and the Spread of Computer Viruses”, Science 304, 527–529 (2004).
- (10) Community Research and Development Information Service: http://cordis.europa.eu
- (11) H. Wigzell, “Framework programmes evolve”, Science Editorial 295, 443–445 (2002).
- (12) A.-L. Barabási and R. Albert, “Emergence of Scaling in Random Networks”, Science 286, 509–511 (1999).
- (13) J. A. Almendral, J. G. Oliveira, L. López, J. F. F. Mendes, M. A. F. Sanjuán, Physica A (to be published).
- (14) S. N. Dorogovtsev and J. F. F. Mendes, “Evolution of networks”, Adv. Phys. 51, 1079–1145 (2002).
- (15) Both average distances are approximately the value obtained for a random graph bollobas85 with the same number of nodes and average degree. For Universities is and for Companies is .
- (16) S. N. Dorogovtsev, J. F. F. Mendes, and J. G. Oliveira, ”Degree-dependent intervertex separation in complex networks”, Phys. Rev. E 73, 056122 (2006).
- (17) S. H. Strogatz, “Exploring complex networks”, Nature 410, 268–276 (2001).
- (18) L. C. Freeman, ”A set of measures of centrality based on betweenness”. Sociometry 40, 35-41 (1977).
- (19) B. Bollobas, Random graphs (Academic Press, London, 1985).
- (20) B. Bollobás and O. M. Riordan “Mathematical results on scale-free random graphs”, in Handbook of Graphs and Networks: From the Genome to the Internet (S. Bornholdt and H.G. Schuster, eds.), Wiley-VCH, Berlin, p. 1–34.
- (21) E. Ravasz, A. L. Somera, D. A. Mongru, Z. N. Oltvai, and A.-L. Barabási, “Hierarchical organization of modularity in metabolic networks”, Science 297, 1551–1555 (2002).
- (22) S. Chaoming, S. Havlin, and H. E. Makse, “Self-similarity of complex networks”, Nature 433, 392–395 (2005).
- (23) E. Ravasz and A.-L. Barabási, “Hierarchical organization in complex networks”, Phys. Rev. E 67, 026112 (2003).
- (24) M. E. J. Newman, “Fast algorithm for detecting community structure in networks”, Phys. Rev. E 69, 066133 (2004).
- (25) The algorithm package PAJEK can be found at http://vlado.fmf.uni-lj.si/pub/networks/pajek/
- (26) M. E. J. Newman, “The structure and function of complex networks”, Siam Review 45(2), 167–256 (2003).
- (27) M. E. J. Newman, “Assortative Mixing in Networks”, Phys. Rev. Lett. 89, 208701 (2002).
- (28) M. E. J. Newman, “Mixing patterns in networks”, Phys. Rev. E 67, 026126 (2003).
- (29) M. Boguñá, R. Pastor–Satorras, and A. Vespignani, “Cut-offs and finite size effects in scale-free networks”, Eur. Phys. J. B. 38, 205–210 (2004).