Near infrared spectroscopic search for the close orbiting
planet HD 75289b
Abstract
We present a search for the near infrared spectroscopic signature of the close orbiting extrasolar giant planet HD 75289b. We obtained 230 spectra in the wavelength range µm - using the Phoenix spectrograph at Gemini South. By considering the direct spectrum, derived from irradiated model atmospheres, we search for the absorption profile signature present in the combined star and planet light. Since the planetary spectrum is separated from the stellar spectrum at most phases, we apply a phase dependent orbital model and tomographic techniques to search for absorption signatures.
Because the absorption signature lies buried in the noise of a single exposure we apply a multiline deconvolution to the spectral lines available in order to boost the effective S/N ratio of the data. The wavelength coverage of 80 Å is expected to contain planetary lines, enabling a mean line with S/N ratio of 800 to be achieved after deconvolution. We are nevertheless unable to detect the presence of the planet in the data and carry out further simulations to show that broader wavelength coverage should enable a planet like HD 75289b to be detected with 99.9 per cent (4 ) confidence. We investigate the sensitivity of our method and estimate detection tolerances for mismatches between observed and model planetary atmospheres.
keywords:
Line: profiles – Methods: data analysis – Techniques: spectroscopic – Stars: late-type – Stars: individual: HD 75289 – Stars: planetary systems1 INTRODUCTION
One of the great surprises in the search for worlds orbiting other stars was the discovery of a class of close orbiting Extrasolar Giant Planets (CEGPs). The existence of such objects did not fit with the formation scenarios used to explain the arrangement of planets in our own solar system. Even before the first extrasolar gaseous giants were discovered, core accretion models predicted that they should only form (Pollack, 1984) at distances similar to those of the giant outer planets (Boss, 1995). Here temperatures must be cool enough to enable the formation of an ice (water, methane and ammonia in solid or liquid form) core from the proto-planetary disk before gas accretion onto the core can then take place.
With the announcement of the discovery of the first CEGP orbiting the F8 dwarf 51 Peg (Mayor & Queloz, 1995) at a distance of only 0.05 AU came the realisation that existing theories of planetary formation needed to be revised. Guillot et al. (1996) argued, contrary to conventional belief (Boss, 1995), that gas giant planets could survive in such close proximity, although their formation beyond the ice point was still required. Mechanisms to enable an exchange of angular momentum to take place in a proto-planetary disk are believed to be responsible for the spiralling into and eventual halting of planets in a close orbit (Lin et al., 1996).
Planetary atmospheric physics research in recent years has been motivated by the expectation that radiation processed by a large body close to its parent star should be detectable with modern instrumentation. The first clear detection of sodium in the atmosphere of HD 209458b (Charbonneau et al., 2002) revealed a lower than expected concentration when compared with a cloudless planetary atmosphere. Several explanations for the lack of sodium were put forward, including the possible presence of a high cloud deck. No observations had been able to differentiate between the possibility of no clouds (combined with lower sodium abundance) until recent Spitzer observations of HD 209458b with the low resolution spectrometer IRS (Houck et al., 2004) indicated a spectral feature consistent with a high silicate cloud deck (Richardson et al., 2007).
The reflected light spectroscopic studies carried out by (Collier Cameron et al., 1999; Charbonneau et al., 1999; Collier Cameron et al., 2002; Leigh et al., 2003a, b) and more recent results from MOST photometry (Rowe et al., 2006) place albedo upper limits of 0.1 - 0.25 on the atmospheres of CEGPs. Leigh et al. (2003b) has placed an upper limit of 0.12 on the geometric albedo of HD 75289b, suggesting that if clouds are present at all, they are highly non-reflective. These are somewhat lower than the solar system gas giants, Jupiter, Saturn, Uranus and Neptune, which possess geometric albedos of 0.46, 0.39, 0.60 and 0.58 respectively (Karkoschka, 1994). These observed albedo limits for CEGPs rule out the high silicate cloud investigated in the models of Sudarsky et al. (2000), and contradict more recent Spitzer observations (Richardson et al., 2007).
A number of attempts to model the emergent spectrum of CEGPs have also been made in recent years. Sudarsky et al. (2003) have calculated spectra for planets with a range of orbital separations from the parent star, including the so called class of ‘hot roasters’. These authors also presented spectra in the 0.4 - 5 µm region for specific systems. For the well studied transiting planet, HD 209458b, they found a phase averaged planet-star flux ratio of log. A re-evaluation of the Sudarsky et al. (2003) models by Richardson et al. (2003) which include phase dependent effects have yielded 2.2 µm flux ratios of up to log for a cloudless atmosphere in the case of HD 209458b. Here, the incident radiation is completely absorbed and re-emitted on the day-side of the planet. A more recent study by Barman et al. (2005) (BHA05), which models day-night gradients, has yielded results consistent with previous studies. For no redistribution of heat (i.e. re-emission of radiation on the day side), they find log, while uniform redistribution of the incident radiation yields log at all phases for HD 209458b.
Several pioneering attempts were made to detect CEGPs in the near infrared (NIR) from the ground in the combined star and planet light (Wiedemann et al., 2001; Lucas & Roche, 2002; Snellen, 2005). Success in the IR was achieved with the Spitzer Space Telescope, with detections of a reduction in thermal emission during secondary transits of HD 209458b (G0V) (Deming et al., 2005) and TrES-1 (K0V) (Charbonneau et al., 2005). HD 209458b photometry indicates log at 24 µm while a 2.3 µm ground based measurement yields a value of log, albeit with a large degree of uncertainty (Snellen, 2005; Deming et al., 2006). The TrES-1 photometry (Charbonneau et al., 2005) indicated log at 4.5 µm and log at 8.3 µm. These observations are consistent with the Sudarsky et al. (2003) base model. Deming et al. (2006) found that the CEGP HD 189733b yielded an even higher contrast ratio (log at 24 µm) due to the close orbit and later spectral type of the K2V star. Fig. 8 of Fortney et al. (2006) plots a comparison of observed and predicted star-planet contrast ratios covering the spectral region 3 µm - 30 µm. The HD 209458b and TrES-1 observations are consistent with the models, with a 2.2 µm signal strength of 0.1%, whereas scaling the HD 189733b signal suggests a signal strength as high as 0.2%. Most recently, Harrington et al. (2006) have used high S/N Spitzer photometric observations to directly measure the planetary flux of the CEGP And at 24 µm. They find a phase dependent flux which is consistent with the BHA05 models where heat is not significantly redistributed throughout the atmosphere but re-radiated on the dayside of the planet HD 209458b.
1.1 HD 75289
A companion to the main sequence G0 dwarf HD 75289 was first announced by Udry et al. (2000) following precision radial velocity monitoring with the CORALIE spectrometer at the 1.2-m Euler Swiss telescope. Since its first discovery, Pepe et al. (2002) have published a refinement of the system parameters in light of further observations. A comprehensive list of system parameters have been estimated and tabulated by Leigh et al. (2003b). Subsequent to further refinement of parameters, as a result of a longer timebase of observations, Butler et al. (2006) give an ephemeris of day. This result, with day, is marginally greater than the day estimate of Udry et al. (2000). Butler et al. (2006) estimate an orbital radius semi-major axis of AU while Udry et al. (2000) estimate AU.
| Object | UT start | Exp time per | Number of ABBA | Mean | Comments |
| exposure [s] | sequences | S/N | |||
| 2006 January 15 | |||||
| HD 75289 | 01:46:55 | 120 | 6 | 401 | Seeing = 0.68″ |
| HD 75063 | 02:50:32 | 40 | 2 | 391 | G5V Telluric standard |
| HD 75289 | 03:18:48 | 120 | 12 | 133 | Slit mis-alignment (counts decreasing) |
| HD 75063 | 05:22:47 | 40 | 3 | 398 | |
| HD 75289 | 06:03:57 | 120 | 12 | 380 | Low counts: slit re-alignment in middle of set. |
| HD 75063 | 08:46:42 | 40 | 3 | 515 | |
| 2006 January 16 | |||||
| HD 75063 | 00:48:25 | 40 | 3 | 414 | |
| HD 75289 | 01:14:02 | 160 | 10 | 358 | |
| HD 75063 | 03:32:38 | 40 | 3 | 240 | |
| HD 75289 | 03:59:03 | 160 | 11 | 363 | Software crash at end of sequence: frames rejected |
| HD 75063 | 06:25:46 | 40 | 3 | 385 | |
| HD 75289 | 03:48:51 | 160 | 11 | 337 | |
| HD 75063 | 09:06:56 | 40 | 3 | 405 | |
We have carried out Monte-Carlo simulations to determine the most probable estimates of planetary mass, , and orbital inclination, . An estimate of the orbital inclination provides an estimate for the most probable velocity amplitude of the planetary signal. As described in §4 we can use this value as a guide when searching for a planetary signal. The axial inclination of the system can simply be calculated from the equatorial rotation velocity, , determined from estimates of the stellar radius and rotation period, while sin can be measured directly. We assume that the stellar equator and planetary orbit lie in the same plane in agreement with Rossiter-McLaughlin effect measurements for the HD 209458 (Bundy & Marcy, 2000; Queloz et al., 2000; Winn et al., 2005; Wittenmyer et al., 2005) and HD 189733 (Winn et al., 2006) systems. Monte-Carlo simulations using updated values discussed above and values tabulated in Table 1 of Leigh et al. (2003b) yield a most probable value of . A planetary mass of then follows from the known orbital amplitude of the stellar reflex motion of m s-1.
In light of observational and theoretical results, the adopted theoretical radius determined by (Leigh et al., 2003c) is probably a significant over-estimate. A recent plot (Burrows et al., 2006) of radii determined from all observations of transiting CEGPs indicates . Based on the recent theoretical evolution models from Fig. 3 of Burrows et al. (2006) for CEGP radii, we estimate an approximate radius of .
In this work, we aim to detect the planetary signature of the close orbiting planet HD 75289b. In the NIR, rather than searching for an attenuated copy of the stellar spectrum, we can search for the direct spectrum emerging from the heated atmosphere which is expected to possess temperatures in the range 1000-1200 K (Deming et al., 2005; Charbonneau et al., 2005; Deming et al., 2006). The analysis presented below relies on the use of the predicted high density of absorption lines, due mainly to H2O, to search for the faint planetary signal. As such it has the potential to provide constraints on the reliability of model atmosphere opacities. In §2 we present the method used to detect a NIR planetary signal while §3 outlines the data reduction and analysis of data. We discuss our results in §4 and carry out further simulations in §5 before discussing future prospects for this kind of survey in §6.
2 Detecting a Near Infrared spectroscopic signature
2.1 Phase Function
The method of analysis uses a modification of the matched filter technique first presented in Collier Cameron et al. (1999). This technique has been refined and applied to several systems using optical data (Collier Cameron et al., 2002; Leigh et al., 2003a; Leigh et al., 2003c) including HD 75289b (Leigh et al., 2003b) where an upper limit of log has been determined. Here we seek to apply a similar method to NIR spectra.
In order to extract the planetary signal from a timeseries of spectra, we model the planetary signature as a phase dependent spectrum superimposed on an unvarying stellar spectrum. The time dependent variations of the planet orbiting the star are: (1) the instantaneous Doppler shift of the spectrum due to the relative position of the planet and (2) a phase dependent planet-star flux ratio, , which is dependent on atmospheric physics and heating due to the parent star.
The ephemeris and velocity semi-amplitude, km s-1 (where is the orbital inclination), enable the instantaneous velocity shift of the planetary spectrum relative to the stellar spectrum to be determined at any observation phase. Since the rotation velocity of HD 75289 is only 3.8 km s-1 the planetary signature will be Doppler shifted clear of the stellar lines at all phases except those close to . A clean spectral separation will thus be present at most phases.
Because we observe the combined light from star and planet, the light is dominated by the former, meaning that we must express the planetary signature as a fraction of the stellar signature. The planet-star flux ratio, can be expressed as a function of orbital phase () and wavelength (), such that
| (1) |
The form of this function is similar to that used by in optical studies (e.g. (Collier Cameron et al., 2002)) but with the geometric terms describing the albedo, planetary radius and orbital semi-major axis combined into a single function . The value of can be derived from model spectra at the desired value of and represents the maximum planet-star flux ratio, observed at phase 0.5, when . The phase angle combines the orbital inclination, , and orbital phase effects and is defined as
| (2) |
The phase function may also either be empirically determined or modelled.
For a cloud free model, Marley et al. (1999) showed that planets reflect most efficiently shortward of Å, where photons undergo Rayleigh scattering before being absorbed. Seager et al. (2000) found that the form of the phase function is strongly dependent on the particle size at 5500 Å, with larger particles giving strong back scattering and albedos peaking at values similar to the Jovian planets in out own solar system.
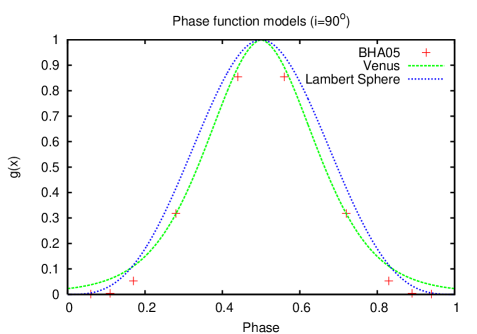
We have investigated the form of the phase function for HD 209458 based on the results of BHA05. Fig. 1 is a plot of for the case where showing the close similarity of the Venus phase function and BHA05 phase functions for = 0.25 - 0.75. Since we are concerned with the detection of the planetary signal and not the characterisation (i.e. we are no attempting to distinguish between phase function forms) in this paper, we have adopted the Venus phase function in subsequent analyses. This function has the advantage of being able to mimic inclination effects through use of the parameter, not possible with our empirical function, and is a valid approximation as our spectra were obtained with phases .
3 Observations & Data Reduction
We present the observations made with the Phoenix spectrograph (Hinkle et al., 2003) at Gemini South on 2006 January 15 & 16. Densely sampled timeseries were recorded using the 256 1024 InSb Aladdin II array. In addition to the HD 75289 spectra, observations of the bright A1 III star, HD 75063, were made to enable careful monitoring of atmospheric absorption features. Because of vignetting and cosmetic issues, the useful region of spectrum was trimmed in the dispersion direction during processing to give a useful area of . The spectral range of 81.74 Å covers the 21807.32 Å to 21889.06 Å (2.18 µm - 2.19 µm) region of the NIR at a spectral resolution of 56 800. With the 1024 pixel array, this gives a mean pixel resolution of 0.096 Å per pixel which is equivalent to a 1.32 km s-1 velocity increment at the central wavelength. The journal of observations is recorded in Table 1.
3.1 Detector
The Aladdin array suffers from a number of significant cosmetic defects. These include a number of dust spots and elongated features. Hot pixels are also present and were flagged during the extraction process to ensure that they were not included. The left side of the detector appears to exhibit sensitivity which alternates between adjacent rows. This stripe pattern produces a ripple at the 4% level but is not present on the right hand portion of the detector.
The characteristics of the Aladdin detector also necessitated an observing strategy to monitor the faint residual charge persistence signature common in this kind of detector when working in the infrared (Solomon, 1999). Observations were thus made by alternating the position of the star on the slit and thus the spectrum on the detector in an ABBA type pattern to allow any persistence signature to be monitored. Each of the 4 sub-exposures in an ABBA sequence comprised a number of further sub-exposures. Short exposure times help to minimise dark current and may help to reduce persistence levels. For 40s exposures, 2x20s exposures were used. Similarly, 120s = 2x60s and 160s = 4x40s. Beletic et al. (2006) has however found that continual flushing of the array can increase the dark current floor, and increase the persistence current.
We could not detect persistence of the HD 75289 spectra which typically peaked at 5000 e-s. The HD 75063 spectra however yielded a maximum of 12500 e-s and did leave a faint persistence trace at a level of 1.6 of the sky background or 0.13% of the peak counts when switching between A and B positions. For HD 75063, telluric lines may shift wavelength throughout the night by a few tens of m s-1 (Gray & Brown, 2006), but this effect translates to a shift of 1/130th of a pixel. Hence the persistence effect when coadding these spectra is negligible. The effect is more crucial, if significant variation in the position of features is expected, such as from an orbiting planet whose signature is Doppler shifted during its orbit. If a signal of similar relative strength to that in the HD 75063 spectra is seen in the HD 75289 spectra, the blurring effect is still expected to be a second order phenomenon and we do not expect to detect such a signature.
3.2 Data Reduction
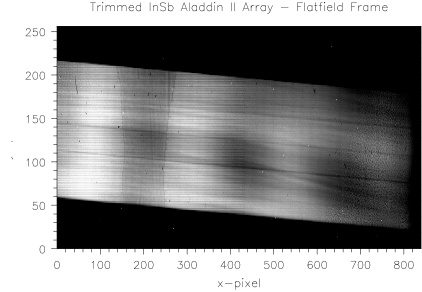
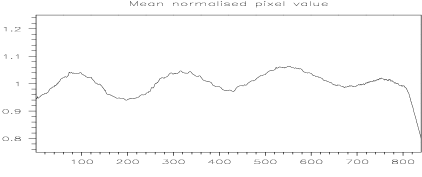
Pixel to pixel variations were removed using flat-field exposures taken with an internal tungsten reference lamp. In order to create a reliable balance frame to remove the pixel sensitivity variations, we divided a Gaussian blurred (using a FWHM of 7 pixels) version of the master flat field image by the original master flat field image. Fig. 2 (top) shows the flatfield image normalised to unity. The large-scale variations at the 5 per cent level shown in Fig. 2 (bottom) are a consequence of broad sensitivity variations on the Aladdin II array. We found that these variations were dependent on the illumination of the array, being both source and time dependent, resulting in an inability to remove the pattern using standard flatfielding techniques. For example, we extracted the flat-field variation with a profile used for extraction of our object frames. The morphology of the flatfield ripples was found to differ from the continuum ripple in the extracted object frame. Similarly, since the ripple pattern was source dependent, we were unable to flatfield the spectra by dividing by the standard star, HD 75063. While the pattern for a given object remained stationary to first order throughout each night of observations, second order time dependent variation was also seen. Nodding the telescope (see below) between two positions on the slit resulted in a drift of the A and B positions of several pixels throughout the night. During extraction we therefore traced each spectrum independently. Since the ripple pattern described above appeared different for HD 75289b than for the flat field, we removed it by fitting splines to the continuum of the extracted spectra.
The worst cosmic ray events were removed at the pre-extraction stage using the Starlink figaro routine bclean (Shortridge, 1993). Instead of making use of the ABBA sequences to reject sky lines by extracting from the A-B and B-A differences (Joyce, 1992), we found that the S/N ratios of the extracted spectra were optimised when the sky background was modelled by fitting polynomials of degree 3 to the pixels either side of the spectral profile at each X-position in each frame. An iterative fitting was used to reject deviant X-position sky fits, thereby rejecting any sky lines. Only a single sky line at Å was present in the data at a level of per cent in the worst spectra (on January 15) and 1 per cent in a typical spectrum.. The spectra were extracted using echomop, the échelle reduction package developed by Mills (1994). The spectra were extracted using echomop’s implementation of the optimal extraction algorithm developed by Horne (1986). echomop propagates error information based on photon statistics and readout noise throughout the extraction process.

3.3 Wavelength calibration
At the time of observations, no arc lamp giving sufficient lines to perform a calibration in the 2.18 µm - 2.19 µmwavelength range was available. We were thus unable to carry out a conventional calibration using the positions of known emission lines. Instead, we used a spectrum generated from a HITRAN line list (Rothman et al., 2005) to identify corresponding features in an observed spectrum of the telluric standard star, HD 75063. We used the simple emission line fitting routine emlt in the Starlink figaro package to fit Gaussians to the inverted spectra in order to identify the positions and width of the lines. The latter were used as uncertainties in the measurements. By fitting a cubic polynomial to the 12 identified telluric lines (Fig. 3), we obtained a wavelength calibration which was subsequently used in our analysis. The of the fit using a cubic polynomial provided improvements by a factor of 31 and 1.8 when compared with a straight line and a quadratic fit respectively. The 0.023 Å rms residual scatter in the fit corresponds to 0.32 km s-1 at the centroidal wavelength of 21484 Å, or 0.06 of a resolution element..

3.4 Extracting the planetary signal
We first constructed a high S/N ratio master stellar spectrum template to accurately subtract the unshifted starlight from each observed spectrum. This has the additional benefit of removing (to first order) the telluric water vapour lines prevalent in this part of the spectrum. By monitoring the strengths of the telluric lines alone, we found, as expected, that they vary in strength throughout the night, generally being stronger when HD 75289 was observed at high airmass. The telluric lines did not all behave in this way however, with some lines weaker than the mean at times while others were stronger. Using a single master frame comprising both stellar and telluric lines left residuals of up to 5- times the expected noise level after subtraction of the starlight from each spectrum.
Instead we made individual use of the bright star, HD 75063, which contains only telluric lines in the observed spectral range of our data. This star was observed at regular intervals on each night of observations. A mean telluric template spectrum was created for each night of observations by aligning and coadding all the HD 75063 spectra observed throughout that night. The telluric spectrum was fitted to each HD 75289 spectrum by taking derivatives of the spectra and using splines to calculate the scale factor at points across the spectra. This process can account for lines which behave independently over the night (i.e. all telluric lines do not necessarily vary in strength by the same factor at any given time) and is described in Collier Cameron et al. (2002) (Appendix A). The procedure provides a spectrum which closely matches the telluric lines for each observed HD 75289 spectrum and is used to divide out these features, leaving only stellar and planetary features.
A master stellar-plus-planet spectrum is then created for each telluric corrected HD 75289 observation, but excluding the current telluric corrected HD 75289 spectrum. Every stellar-plus-planet spectrum is then divided by an aligned and shifted version of the current master stellar-plus-planet spectrum in order to remove the stellar lines. Since a planetary signal is Doppler shifted according to phase relative to the stellar lines only the planetary signature should remain. The master stellar-plus-planet spectrum which is subtracted from each spectrum in turn contains a blurred copy of the planetary signal. This will thus attenuate the planetary signal in the frame on which subtraction is being performed, to some degree. The effect is worst at & where the planet moves very little in velocity space from spectrum to spectrum. The attenuation correction applied to the matched travelling Gaussian used to model the planetary motion when searching for a signal is described in detail in §6 and Appendices D2 & D3 of Collier Cameron et al. (2002).
We found however that further time varying systematic residuals remained in the spectra and believe that these remaining residuals are due to the time varying ripple which we were unable to remove from the spectra at the extraction stage. Since we remove this effect using splines, we expect time varying differences in the fits which do not exactly match the observed changes in the ripple pattern due to finite signal to noise in the data. We therefore implemented a method which removes the residual signal which we treat as pattern noise. This method using principal component analysis is described by Collier Cameron et al. (2002) (Appendix B) and removes time varying patterns at fixed positions in the spectra. When the first few principal components are removed, this has little or no effect on any planetary signal since it changes position from spectrum to spectrum. We discuss the results using this algorithm further in section §4.
3.5 Model spectrum
The residual spectrum will contain a Doppler-shifted copy of the planetary spectrum, which at this stage is still buried in the noise. To reduce the effective noise, we model the planet’s spectrum as the convolution of a Doppler-shifted mean line profile (which we wish to determine) and an absorption line pattern for an irradiated model atmosphere spectrum with parameters equal to those of HD 75289b. Our model spectra were generated using the cloud-free “rainout” method described in BHA05 which improves the earlier models of Barman et al. (2001) (based on the ”AMES-cond” models of Allard et al. (2001)) by iteratively reducing the elemental abundances involved in grain formation at a given layer and recomputing the chemical equilibrium at each new set of stratified elemental abundances. The resulting equilibrium chemistry and opacity sampling after rainout of species is fully self consistent, whereas earlier cond models simply excluded the grain opacities. Thus in the models used in this work, elements which are important in the atmospheres of cool stars such as Ti and V are significantly depleted leading to negligible concentrations of TiO and VO. Day-night temperature gradients were modelled under the assumption that concentric neighbouring rings of different temperature interact very little via radiative transfer processes. For a fuller description of the model opacities and setup see Allard et al. (2001), Barman et al. (2001) and BHA05. The temperatures on the dayside of the planet lead to an atmospheric chemistry dominated by H2, He, H2O and CO (BHA05). The dominant opacities in the 2.18 - 2.19 µm wavelength span of our data however are due to H2O. We derived the necessary list of line positions and depths for least squares deconvolution from a model spectrum before instrumental and stellar line broadening were added to the spectra and for the case when the planet is in conjunction with the star (i.e. at orbital phase 0.5).
In Fig. 4 (top), we plot the model spectrum generated for HD 75289b. The spectrum has been convolved with a Gaussian to mimic the R resolution of the observations and rotationally broadened to 1.482 km s-1 under the assumption that the planet is tidally locked to the star (i.e. sin = ). Fig. 4 also shows a typical HD 75289 spectrum (middle) and HD 75063 spectrum (bottom). The tick marks below then HD 75289b spectrum indicate the theoretical positions of 10 stellar lines (Fe and Si opacities) which are listed in the Vienna Atomic Line Database, VALD (, Kupka et al.1999). Additional opacities not included in VALD can also be seen (see Fig. 4 caption). The HD 75289 spectra are thus clearly dominated by telluric lines.
The mean absorption profile is recovered through use of a least squares deconvolution method first demonstrated by Donati et al. (1997). A list of absorption lines is derived from the model atmosphere (see above) and the depths, before any kind of broadening, are used to optimally weight each line in the observed spectrum. The deconvolution is effectively a sophisticated cross-correlation method which optimally coadds all the aligned absorption profiles while removing any side lobes due to line blending. The resulting profile is a mean absorption line with S/N ratio boosted, thereby improving the chance of detecting weak signals which are dominated by noise. The current version of the code (Barnes et al., 1998) which propagates errors from the input spectra has been used extensively for reflected light searches in the optical by Collier Cameron et al. (1999, 2002) and Leigh et al. (2003a, b). For HD 75289b, we expect 98 planetary absorption features in the wavelength range of our data. The weighted mean normalised depth (Barnes et al., 1998) of these lines relative to the planetary “continuum” is 0.096. The optimal nature of the deconvolution means that all 98 lines in the wavelength range of our observations contribute, but only 8 (indicated by tick marks below the model planet spectrum in Fig. 4) of the lines possess a normalised depth relative to the planetary continuum greater than the mean weighted value of 0.096. Of the 98 lines, 50 possess depths greater than 0.01 of the normalised planetary continuum. Attenuation by a further factor in the combined star+planet spectrum is one of the main parameters which we wish to determine.
From photon statistics ( per spectrum, where = number of electrons), we expect an mean S/N limit in our spectra of for both nights of data. The mean S/N ratios, measured from flat regions in the normalised spectra, were 199 and 268 for the nights of January 15 & 16 respectively. The upper and lower limits represent the minimum and maximum recorded S/N ratio on each night. Slit alignment and tracking problems were the cause of low counts in a number of the January 15 spectra with a minimum S/N = 25 (readout noise = 40 e-) . The gain in S/N of 3.4 for the deconvolved line profile yielded S/N ratios of 797 over the two nights (i.e. minimum S/N 112 and maximum S/N = 1149).
4 Results
4.1 Matched-filter analysis
We model the time-dependent changes in Doppler shift and brightness, in the manner described in §2. This matched-filter enables us to search for features in the timeseries spectra and is described in Collier Cameron et al. (2002) (appendix D). We asses the relative probabilities of the fits to the data by varying and and plotting the improvement in , which is normalised to the best-fitting model. To calibrate any candidate detection, we construct a simulated planet signal of known that is added to the extracted spectra prior to removal of stellar and telluric features and before least squares deconvolution is carried out. By ensuring the fake planet is recovered correctly by our procedures, we can be confident of a calibrated detection in the presence of a genuine planet signal.
The significance of the result is assessed using bootstrap statistical procedures based on the random re-ordering of the data in a way that scrambles phases while preserving the effects of any correlated systematic errors (Collier Cameron et al., 2002). The order of the observations is randomised in a set of 3000 trials which will scramble any true planetary signal while enabling the data to retain the ability to produce spurious detections through the chance alignment of systematic errors. The least squares estimate of log and associated as a function of enable us to plot 68.4, 95.4, 99.0 and 99.9 per cent bootstrap limits on the strength of the planetary signal.
 |
|
 |
|
4.2 Searching for a planetary signal
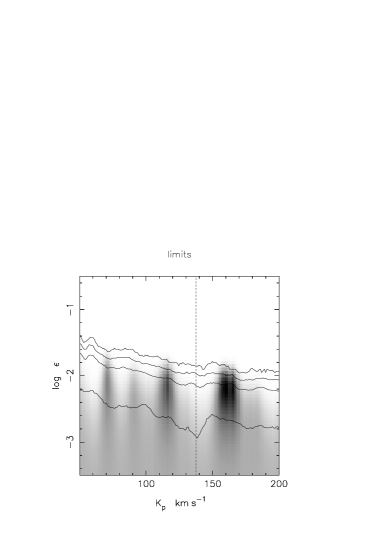
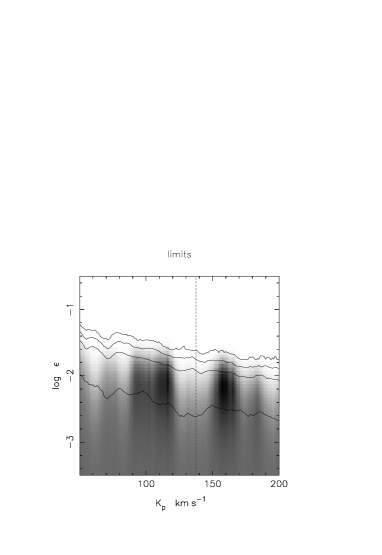
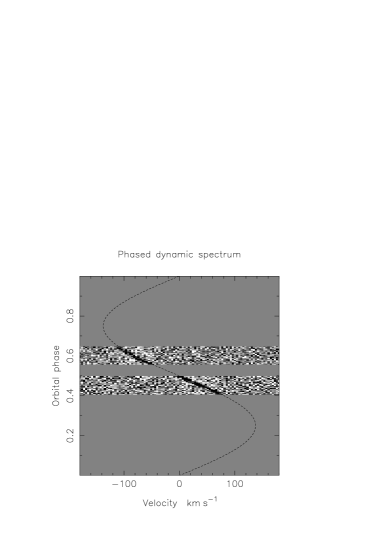
Fig. 5 (left) shows the phased timeseries deconvolved spectra and the resulting map of log vs . The effective wavelength after performing deconvolution is Å. Fig. 5 (right ) shows the relative probability map of the planet-star flux ratio vs . The darkest regions in the map represent the greatest improvement in when fitting the model described in §4.1. We can obtain an estimate of the upper limit (i.e. when ) of the velocity amplitude of the planet. With AU and d, we find km s-1. With the orbital inclination of reported in §1.1, we estimate a most probable velocity amplitude of K̂ km s-1. In Fig. 5 we plot the corresponding motion and recovered position for K̂p (dashed curves and vertical lines respectively) as a visual guide to the reader.
It is possible to see the non-Gaussian systematics in the phase plot in Fig. 5 (top left). We believe that these features are the result of our inability to fully remove the varying telluric signatures and uncharacterised changes in the observed ripple function described in §3.2 . To remove the most significant trends in the timeseries data at fixed positions in wavelength, we used principal component analysis (Collier Cameron et al. (2002), Appendix B). The eigenvalues of the first two principal components indicated a strong contribution while a less strong contribution from the next five components was then followed by a linear decrease in significance. We thus investigated removal of the first two, and the first five components, with the resulting input timeseries for the latter case being significantly cleaner of systematic noise features. When we compare Fig. 5 (bottom right) with Fig. 5 (top right), we see how the km s-1 feature is reduced in significance, leaving several features of comparable strength and low statistical significance. The km s-1 feature only marginally lies in the range of possible values since the uncertainty on our measurement yields an upper (1-) limit of 158.11 km s-1. A planet with this velocity amplitude would imply , indicating a planet likely to show transits, an observation not reported in the literature. The km s-1 feature is of no greater significance and implies an orbital inclination of respectively. This is unlikely to give a detection given the relatively low maximum flux we would receive under the reasonable assumption (Harrington et al., 2006) that heat is not effectively redistributed and the planet is hottest on its dayside. All candidate features however can confidently be rejected on the basis of the observed flux ratios for a number of systems (§1) since the mean log = -2.1 implies a planet significantly hotter than even HD 189733 (see Fig. 8 of Fortney et al. (2006)).
Under the assumption that all candidate features are spurious, the overall level of noise in the data enables us to rule out the presence of a planet at K̂p with log at the 2- level (Fig. 5, top right).
 |
|
 |

|
5 Simulating a planetary signal
In order to assess the feasibility of detecting a planetary signature in the NIR, we have carried out simulations using fake data based on the known physical parameters of HD 75289b. By considering the wavelength coverage possible with current NIR multiorder cross-dispersed échelle technology (i.e. IRCS/Subaru (Kobayashi et al., 2000) and NIRSPEC/Keck 2 (McLean et al., 1998)), we estimate that approximately 50 spectra with R , a mean S/N ratio of 300 and encompassing a wavelength range of 1.90 µm to 2.45 µm could be obtained per 8 hrs of observations (Kobayashi et al., 2000). With a typical spectral coverage of 70% of this range our planetary model atmosphere for HD 75289 yields useful lines with depths between 0.05 and 1.0 of the normalised continuum.
We generated model spectra for a G0V star using ATLAS9 models (Kurucz, 1993) and a HITRAN model of the telluric lines (Rothman et al., 2005). These spectra were combined with our model planetary spectrum assuming an orbital inclination of , a relative maximum planet-star flux ratio of log and a velocity amplitude of km s-1. Gaussian random noise was added to the spectra to simulate a S/N ratio of 300. We assumed observations were taken over two nights with a ten night phase gap. This strategy optimises observations at phases close to , while minimising the timebase.
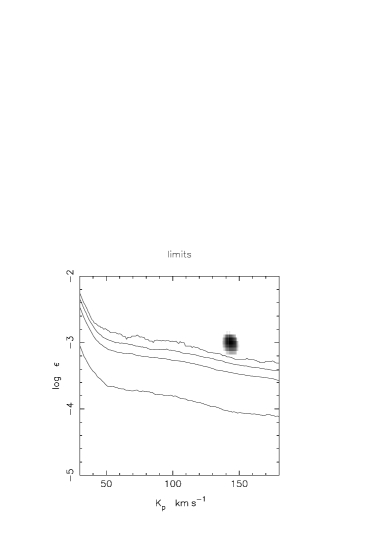
We attempted to recover of the planetary signal in the same way as described in previous sections. The phased timeseries spectra are presented in Fig. 6 (top left), and show a detection well clear of the 99 per cent confidence level (Fig. 6, top right). Since the semi-major axis of the orbit and the period are both known, we can use our estimate of to determine the inclination. Our matched-filter analysis gives km s-1 leading to an inclination determination of 72. Hence we overestimate the inclination by 5. The detection limit at the simulated velocity of the planet is log. Equivalently, at the projected velocity of the planet, we expect to recover the signal at the limiting confidence for data with S/N 200.
We carried out a further test to estimate the feasibility of recovering the planetary signal in the case where the line strengths are incorrect. We assumed that the positions of all lines in our input model planetary spectrum could be incorrect by some fraction. The depth of each line, but not the position, was modified by a Gaussian random fraction of the original strength. We then attempted to recover the planetary signal with the modified line list (used for deconvolution) and found that for data with S/N = 300, we still recover the planet with a 99.9 per cent confidence limit for strengths which have been modified by on average 50 per cent. This simulation essentially mimics the effects of non-optimal extraction of the lines using our deconvolution code. Our ability to recover the planet is more sensitive to incorrect positioning of lines however. We find that a clear 99.9 per cent confidence detection is achieved in the limiting case of randomly re-positioning 15 per cent of the lines before deconvolution. The main reason these mismatches, which we discuss in the next section, is likely the uncertainties in opacities, opacity oscillator strengths and atmospheric physics of the planet. We note that in reality, removal of the telluric lines at the shorter wavelengths of the above range (i.e. 1.90 µm to 2.08 µm) does not affect our ability to make a clear detection.
We also simulated recovery of the planet for a spectral resolution of R . The main advantage of high resolution data would be the increase in depth of the absorption lines relative to the continuum. The results are shown in Fig. 6 (bottom) and show the clear gain attained by doubling the resolution. Our limiting 99 per cent confidence threshold in this instance would enable us to detect a planetary signal at a level of log. The planet is recovered with km s-1, leading to an inclination determination of 69.2. Since a narrower slit will be used to make observations at higher resolution, we may not observe this degree of improvement in reality. Our limiting 99.9 per cent confidence indicates we would still detect the planet with S/N = 95 or approximately 1/4 the number of photons required in the R limiting case. We discuss the prospect of obtaining spectra of this nature in section §6
6 Discussion
The methods employed in this paper provide a very encouraging indication that a planetary signal can potentially be extracted from high resolution timeseries spectra. The fact that we do not detect a signal can be attributed largely to systematic noise introduced from difficulties in consistently normalising each spectrum in our timeseries. This arises largely because of the systematic and varying large scale flat fielding errors associated with the detector employed in the observations as discussed in §3.2.
We have shown that the feature detected in our spectra is unlikely to be a real planetary feature since its strength is much reduced when additional principal components, which describe (systematic) trends in the data, are removed. The eigenvector describing the contribution of principal components shows a very strong contribution from the first 2 components with an exponential decay which levels off after the 7th principal component. At this level, the detected feature becomes consistent with the shot noise in the spectra. The performance of NIR detectors is clearly of great importance if we wish to detect small signals dominated by a nearby bright object. More modern detectors such as the 10242 Aladdin III array used in conjunction with NIRSPEC at Keck 2 (McLean et al., 1998) do not show the characteristics (McLean et al., 2000) of the older Aladdin II array used to secure the data in this work. Future detectors promise even greater stability with Bezawada & Ives (2006) finding 0.05 per cent flatfield stability over a period of one day for a 20482 HAWAII-1RG engineering array.
Current observational evidence for a planetary signal at 2.2 µm therefore remains inconclusive. Initial attempts to search for extrasolar planetary spectra (by the method of difference analysis where the spectrum of the host star seen during eclipse of the planet is subtracted from the spectrum of the combined star and planet, seen out of eclipse) revealed null results. The analysis by Richardson et al. (2003) failed to detect the predicted continuum ‘bump’ at 2.1 - 2.2 µm at a level of log. Snellen (2005) did not detect the eclipse shape from 2.3µm secondary eclipse observations of HD 209458b, but nevertheless the mean drop in flux (based on two measurements) of 0.115 0.139 per cent indicates a planet-star flux ratio of 0.0010 0.0009. While this confirms model predictions for a planet-star flux ratio, Deming et al. (2006) note that the size of the uncertainty does not exclude the blackbody result.
While advances have been made in detecting spectral features in the mid-infrared 7.5 - 13.2µm interval (Richardson et al., 2007; Grillmair et al., 2007) using Spitzer space telescope observations, models would suggest that the higher contrast ratio in the NIR will necessitate the kind of signal enhancement techniques used in this work. It is clear that there is still much to learn about the atmospheres of CEGPs. Both Richardson et al. (2007) and Grillmair et al. (2007) have found that there is little evidence for the H2O opacities present in model spectra. Richardson et al. (2007) however find evidence for silicate clouds in the spectrum of HD 209458b.
The simulations we have carried out in this work make the assumption that the opacities in current models are correct, even if their strengths are not. If many species are omitted or are simply not present in reality, this could have significant impact on the detection method, either for better or worse. As with the Richardson et al. (2003) search for the 2.1 - 2.2 µm bump, our models contain unreliable OH opacities and oscillator strengths and missing CH4 opacities which are seen in T dwarf spectra (Burgasser et al., 2006). This is clearly important when using methods which aim to detect the ‘continuum’ shape, while we found (§5) that incorrect positioning of greater than 15 per cent of lines would affect our ability to make a clear detection. Conversely, competing models could be used to obtain an optimal extraction of the absorption signature of a planetary spectrum. Switching off model opacities for species which are known to have unreliable positions may be necessary to enable recovery of the planetary signal. In the case of a clear detection, it should then also be possible to distinguish between differing phase function models by monitoring the improvement in in our matched filter analysis.
If the albedo spectrum is largely independent of wavelength in the regions where absorbing species do not play a significant role, including 2.2 µm (see Fig. 8 of Sudarsky et al. (2000)), we would expect a very small reflected light component in the NIR, given the upper limits found in the optical. Our data contain only 10 lines arising from the spectrum of HD 75289 itself, with a mean depth 2.7 times the mean depth of the 98 lines we expect to see in the planetary atmosphere. Nevertheless, if the 10 lines are seen as a component reflected from possible clouds in the atmosphere of HD 75289b, we expect little gain in the signal if the upper albedo limit of 0.12 (Leigh et al., 2003b) is taken into account. The maximum reflected light signal in this case is only log, over an order of magnitude less than the NIR log estimate adopted throughout this work.
6.1 Summary
We have presented an analysis and feasibility study for the detection of the NIR spectroscopic signature of the close orbiting extrasolar giant planet, HD 75289b. We do not detect the planet with the present Gemini/Phoenix data but through simulations based upon models and observational constraints we expect that current cross-dispersed spectrographs, such as IRCS/Subaru (Kobayashi et al., 2000) and NIRSPEC/Keck 2 (McLean et al., 1998), operating at resolutions in the region of R are sufficient to obtain a detection with 99.9 per cent confidence. Facilities which could offer higher resolution and broad wavelength coverage will be an enormous benefit. With a large spectral capability, it will be possible to determine the NIR spectral energy distribution in J, H & K regions, complementing observations currently being made at longer wavelengths.
7 Acknowledgments
This paper is based on observations obtained with the Phoenix infrared spectrograph, developed and operated by the National Optical Astronomy Observatory. We would like to thank the anonymous referee for useful comments. JRB was supported by a PPARC funded research grant during the course of this work.
References
- Allard et al. (2001) Allard F., Hauschildt P. H., Alexander D. R., Tamanai A., Schweitzer A., 2001, ApJ, 556, 357
- Barman et al. (2001) Barman T. S., Hauschildt P. H., Allard F., 2001, ApJ, 556, 885
- Barman et al. (2005) Barman T. S., Hauschildt P. H., Allard F., 2005, ApJ, 632, 1132 (BHA05)
- Barnes et al. (1998) Barnes J. R., Collier Cameron A., Unruh Y. C., Donati J. F., Hussain G. A. J., 1998, MNRAS, 299, 904
- Beletic et al. (2006) Beletic J. E., Beletic J. W., Amico P., eds, 2006, Scientific Detectors for Astronomy 2005
- Bezawada & Ives (2006) Bezawada N., Ives D., 2006, in High Energy, Optical, and Infrared Detectors for Astronomy II. Edited by Dorn, David A.; Holland, Andrew D.. Proceedings of the SPIE, Volume 6276, pp. 62760O (2006). High-speed multiple window readout of Hawaii-1RG detector for a radial velocity experiment
- Boss (1995) Boss A. P., 1995, Science, 267, 360
- Bundy & Marcy (2000) Bundy K. A., Marcy G. W., 2000, PASP, 112, 1421
- Burgasser et al. (2006) Burgasser A. J., Geballe T. R., Leggett S. K., Kirkpatrick J. D., Golimowski D. A., 2006, ApJ, 637, 1067
- Burrows et al. (2006) Burrows A., Hubeny I., Budaj J., Hubbard W. B., 2006, ArXiv Astrophysics e-prints
- Butler et al. (2006) Butler R. P., Wright J. T., Marcy G. W., Fischer D. A., Vogt S. S., Tinney C. G., Jones H. R. A., Carter B. D., Johnson J. A., McCarthy C., Penny A. J., 2006, ApJ, 646, 505
- Charbonneau et al. (2005) Charbonneau D., Allen L. E., Megeath S. T., Torres G., Alonso R., Brown T. M., Gilliland R. L., Latham D. W., Mandushev G., O’Donovan F. T., Sozzetti A., 2005, ApJ, 626, 523
- Charbonneau et al. (2002) Charbonneau D., Brown T. M., Noyes R. W., Gilliland R. L., 2002, ApJ, 568, 377
- Charbonneau et al. (1999) Charbonneau D., Noyes R. W., Korzennik S. G., Nisenson P., Jha S., Vogt S. S., Kibrick R. I., 1999, ApJ, 522, L145
- Collier Cameron et al. (1999) Collier Cameron A., Horne K., Penny A., James D., 1999, Nature, 402, 751
- Collier Cameron et al. (2002) Collier Cameron A., Horne K., Penny A., Leigh C., 2002, MNRAS, 330, 187
- Deming et al. (2006) Deming D., Harrington J., Seager S., Richardson L. J., 2006, ApJ, 644, 560
- Deming et al. (2006) Deming D., Richardson L. J., Seager S., Harrington J., 2006, in Arnold L., Bouchy F., Moutou C., eds, Tenth Anniversary of 51 Peg-b: Status of and prospects for hot Jupiter studies Infrared radiation from hot Jupiters. pp 218–225
- Deming et al. (2005) Deming D., Seager S., Richardson L. J., Harrington J., 2005, Nat, 434, 740
- Donati et al. (1997) Donati J.-F., Semel M., Carter B., Rees D. E., Collier Cameron A., 1997, MNRAS, 291, 658
- Fortney et al. (2006) Fortney J. J., Saumon D., Marley M. S., Lodders K., Freedman R. S., 2006, ApJ, 642, 495
- Gray & Brown (2006) Gray D. F., Brown K. I. T., 2006, PASP, 118, 399
- Grillmair et al. (2007) Grillmair C. J., Charbonneau D., Burrows A., Armus L., Stauffer J., Meadows V., van Cleve J., Levine D., 2007, ArXiv Astrophysics e-prints
- Guillot et al. (1996) Guillot T., Burrows A., Hubbard W. B., Lunine J. I., Saumon D., 1996, ApJ, 459, L35+
- Harrington et al. (2006) Harrington J., Hansen B. M., Luszcz S. H., Seager S., Deming D., Menou K., Cho J. Y.-K., Richardson L. J., 2006, Science, 314, 623
- Hilton (1992) Hilton J., 1992, Expanatory supplement to the Aastronomical Almanac. University Science Books, Mill Valley, CA.
- Hinkle et al. (2003) Hinkle K. H., Blum R. D., Joyce R. R., Sharp N., Ridgway S. T., Bouchet P., van der Bliek N. S., Najita J., Winge C., 2003, in Guhathakurta P., ed., Discoveries and Research Prospects from 6- to 10-Meter-Class Telescopes II. Edited by Guhathakurta, Puragra. Proceedings of the SPIE, Volume 4834, pp. 353-363 (2003). Vol. 4834 of Presented at the Society of Photo-Optical Instrumentation Engineers (SPIE) Conference, The Phoenix Spectrograph at Gemini South
- Horne (1986) Horne K. D., 1986, PASP, 98, 609
- Houck et al. (2004) Houck J. R., Roellig T. L., van Cleve J., +32 co-authors 2004, ApJS, 154, 18
- Joyce (1992) Joyce R. R., 1992, in Howell S. B., ed., ASP Conf. Ser. 23: Astronomical CCD Observing and Reduction Techniques Observing With Infrared Arrays. pp 258–+
- Karkoschka (1994) Karkoschka E., 1994, Icarus, 111, 174
- Kobayashi et al. (2000) Kobayashi N., Tokunaga A. T., Terada H., Goto M., Weber M., Potter R., Onaka P. M., Ching G. K., Young T. T., Fletcher K., Neil D., Robertson L., Cook D., Imanishi M., Warren D. W., 2000, in Iye M., Moorwood A. F., eds, Proc. SPIE Vol. 4008, p. 1056-1066, Optical and IR Telescope Instrumentation and Detectors, Masanori Iye; Alan F. Moorwood; Eds. IRCS: infrared camera and spectrograph for the Subaru Telescope. pp 1056–1066
- (33) Kupka, F. and Piskunov, N. and Ryabchikova, T. A. and Stempels, H. C. and Weiss, W. W., 1999, A&Asupp, 138, 119
- Kurucz (1993) Kurucz R. L., 1993, CDROM # 13 (ATLAS9 atmospheric models) and # 18 (ATLAS9 and SYNTHE routines, spectral line database), Cambridge, MA
- Leigh et al. (2003a) Leigh C., Cameron A. C., Horne K., Penny A., James D., 2003a, MNRAS, 344, 1271
- Leigh et al. (2003b) Leigh C., Collier Cameron A., Udry S., Donati J.-F., Horne K., James D., Penny A., 2003b, MNRAS, 346, L16
- Leigh et al. (2003c) Leigh C., Cameron A. C., Guillot T., 2003c MNRAS, 346, 890
- Lin et al. (1996) Lin D. N. C., Bodenheimer P., Richardson D. C., 1996, Nature, 380, 606
- Lucas & Roche (2002) Lucas P. W., Roche P. F., 2002, MNRAS, 336, 637
- Marley et al. (1999) Marley M. S., Gelino C., Stephens D., Lunine J. I., Freedman R., 1999, ApJ, 513, 879
- Mayor & Queloz (1995) Mayor M., Queloz D., 1995, Nature, 378, 355
- McLean et al. (1998) McLean I. S., Becklin E. E., Bendiksen O., Brims G., Canfield J., Figer D. F., Graham J. R., Hare J., Lacayanga F., Larkin J. E., Larson S. B., Levenson N., Magnone N., Teplitz H., Wong W., 1998, in Fowler A. M., ed., Proc. SPIE Vol. 3354, p. 566-578, Infrared Astronomical Instrumentation, Albert M. Fowler; Ed. Design and development of NIRSPEC: a near-infrared echelle spectrograph for the Keck II telescope. pp 566–578
- McLean et al. (2000) McLean I. S., Wilcox M. K., Becklin E. E., Figer D. F., Gilbert A. M., Graham J. R., Larkin J. E., Levenson N. A., Teplitz H. I., Kirkpatrick J. D., 2000, ApJ, 533, L45
- Mills (1994) Mills D., 1994, Technical Report 152, Starlink User Note. Rutherford Appleton Laboratory
- Pepe et al. (2002) Pepe F., Mayor M., Galland F., Naef D., Queloz D., Santos N. C., Udry S., Burnet M., 2002, A&A, 388, 632
- Pollack (1984) Pollack J. B., 1984, ARA&A, 22, 389
- Queloz et al. (2000) Queloz D., Eggenberger A., Mayor M., Perrier C., Beuzit J. L., Naef D., Sivan J. P., Udry S., 2000, A&A, 359, L13
- Richardson et al. (2007) Richardson L. J., Deming D., Horning K., Seager S., Harrington J., 2007, Nature, pp 892–895
- Richardson et al. (2003) Richardson L. J., Deming D., Seager S., 2003, ApJ, 597, 581
- Rothman et al. (2005) Rothman L. S., Jacquemart D., Barbe A., +25 co-authors 2005, Journal of Quantitative Spectroscopy and Radiative Transfer, pp 139–204
- Rowe et al. (2006) Rowe J. F., Matthews J. M., Seager S., Kuschnig R., Guenther D. B., Moffat A. F. J., Rucinski S. M., Sasselov D., Walker G. A. H., Weiss W. W., 2006, ApJ, 646, 1241
- Seager et al. (2000) Seager S., Whitney B. A., Sasselov D. D., 2000, ApJ, 540, 504
- Shortridge (1993) Shortridge K., 1993, in ASP Conf. Ser. 52: Astronomical Data Analysis Software and Systems II The Evolution of the FIGARO Data Reduction System. pp 219–+
- Snellen (2005) Snellen I. A. G., 2005, MNRAS, 363, 211
- Solomon (1999) Solomon S. L., 1999, Ph.D. thesis, University of Rochester, Rochester, NY, US.
- Sudarsky et al. (2003) Sudarsky D., Burrows A., Hubeny I., 2003, ApJ, 588, 1121
- Sudarsky et al. (2000) Sudarsky D., Burrows A., Pinto P., 2000, ApJ, 538, 885
- Udry et al. (2000) Udry S., Mayor M., Naef D., Pepe F., Queloz D., Santos N. C., Burnet M., Confino B., Melo C., 2000, A&A, 356, 590
- Wiedemann et al. (2001) Wiedemann G., Deming D., Bjoraker G., 2001, ApJ, 546, 1068
- Winn et al. (2006) Winn J. N., Johnson J. A., Marcy G. W., Butler R. P., Vogt S. S., Henry G. W., Roussanova A., Holman M. J., Enya K., Narita N., Suto Y., Turner E. L., 2006, ApJ, 653, L69
- Winn et al. (2005) Winn J. N., Noyes R. W., Holman M. J., Charbonneau D., Ohta Y., Taruya A., Suto Y., Narita N., Turner E. L., Johnson J. A., Marcy G. W., Butler R. P., Vogt S. S., 2005, ApJ, 631, 1215
- Wittenmyer et al. (2005) Wittenmyer R. A., Welsh W. F., Orosz J. A., Schultz A. B., Kinzel W., Kochte M., Bruhweiler F., Bennum D., Henry G. W., Marcy G. W., Fischer D. A., Butler R. P., Vogt S. S., 2005, ApJ, 632, 1157