Self assembly of a model multicellular organism resembling the Dictyostelium slime molds
1 Abstract
The evolution of multicellular organisms from monocellular ancestors represents one of the greatest advances of the history of life. The assembly of such multicellular organisms requires signalling and response between cells: over millions of years these signalling processes have become extremely sophisticated and refined by evolution, such that study of modern organisms may not be able to shed much light on the original ancient processes . Here we are interested in determining how simple a signalling method can be, while still achieving self-assembly. In 2D a coupled cellular automaton/differential equation approach models organisms and chemotaxic chemicals, producing spiralling aggregation. In 3D Lennard-Jones-like particles are used to represent single cells, and their evolution in response to signalling is followed by molecular dynamics. It is found that if a single cell is able to emit a signal which induces others to move towards it, then a colony of single-cell organisms can assemble into shapes as complex as a tower, a ball atop a stalk, or a fast-moving slug. The similarity with the behaviour of modern Dictyostelium slime molds signalling with cyclic adenosine monophosphate (cAMP) is striking.
2 Introduction
The myriad shapes and complex adaptations which are observed in modern organisms may suggest that evolution is unbounded in its possibilities: yet several ”simple” machines, e.g. the wheel and the double pulley have no counterpart in the natural world, while the complexity of some natural systems, such as the eye or the brain, remain a source of amazement. Thus it is clear that human intuition about what is ”simple” is different from what is evolutionarily achievable - i.e. what can be built incrementally rather than by design.
The transition from unicellular to multicellular lifeforms is one of the most dramatic changes in evolutionary history (see e.g. Bonner, 1997 and references therein)bonner . The exact trigger for cooperative behaviour is unknown; however, some form of signalling between cells must have been involved. In this paper a model is introduced for investigating by simulation the types of multicellular shapes which could emerge in response to simple signalling.
The emphasis in this work is to explore how simple a morphogenetic system can be that will lead to self assembly, what the mechanism of assembly is, and what morphologies might result. In particular, it does not attempt to model any particular modern organism, and, where choices have to be made, the simplest option is preferred.
3 Accumulation, Spirals and Self-organisation in 2D
The accumulation of Dictyostelium Discoidium (Dd) in the early stages of aggregation can be modelled using a two stage Cellular Automata (CA) /Differential equation (DE) model similar to that suggested by HogewegHog . A detailed description of our implementation, coding and an applet can be found online at www.ph.ed.ac.uk/nania/dicty/dicty.html.
The CA model is based on work by Glazier and Granergg . On a 2D square lattice each amoeba covers multiple sites (with ideal value ) and is assigned a unique identification number . Using multiple sites is essential to allow the amoeba to pass each other and apply pressure. The three types of amoeba (autocycling(a), prestalk(k), prespore(p)) can each be in one of three states (Ready (s=0), Excited(s=1), Refractory(s=-1)). Amoeba are initialised with area at random positions on the latticeHanes . Each lattice site is assigned an energy
| (1) |
where the sum runs over eight nearest neighbours. J() is given in table LABEL:tautable and is the number of sites occupied by the amoeba at (labelled ).
| 0 | a | k | p | |
|---|---|---|---|---|
| 0 | 0 | 2 | 2 | 2 |
| a | 2 | 3 | 4 | 4 |
| k | 2 | 4 | 3 | 4 |
| p | 2 | 4 | 4 | 4 |
The CA is updated by copying the onto a neighbouring site with a probability according to the Metropolis algorithmmetro . An additional term, , described below, is added for Excited amoeba in the presence of cAMP. The “temperature” parameter T controls the mobility of the amoeba.
The CA alone exhibits cell sorting behaviourgg ; Hanes due to differential adhesion of different cell typessteinberg .
Our model varies from previous workHog in that the signalling chemical cAMP is added directly by the amoeba when they are in the excited state, and the time advancement is controlled by the diffusion equation with a term ()to account for the breakdown of cAMP by phosphodiesterase. Thus the concentration of cAMP is given by:
| (2) |
where is the CA state of the amoeba at position .
One complete iteration of the cAMP field takes place for each iteration of the CA.
Dynamics at the amoeba level cycle between the three states: R transforms to E once cAMP concentration integrated over the amoeba exceeds some threshhold . The amoeba remains E for 100s, then becomes F for 500s before returning to R.
Autocycling amoeba are different. They simply emit cAMP once every 600s, and remain F. There is no evidence that such autocycling amoeba exist in nature, and we shall see later that they are unnecessary for explaining the observed dynamics.
3.1 Spiral Formation
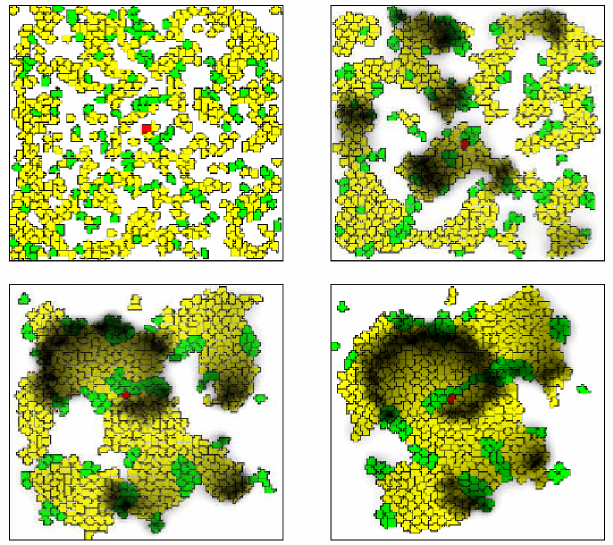
With one autocycler amoeba, 108 pre-stalk and 431 pre-spore cells spiral patterns are formed (Fig.1). Aggregation happens quickly, followed by the generation of a spiral wave initiated by the autocycler. The spiral wave causes the aggregating amoeba to form streams, which coalesce into a single large stream. This is broadly similar to previous workHog . Cell sorting is a slower process, but can be seen in (Fig.1). Gaps between amoeba are important: if the amoeba density is increased to fill all space, no such spirals are formed.
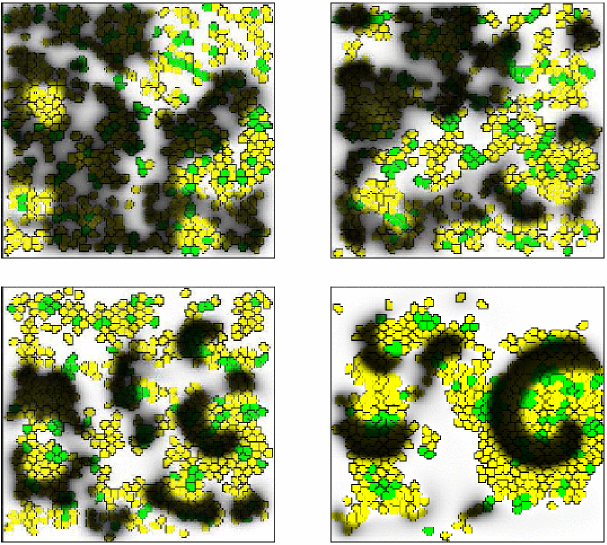
Without the autocycler, the spiral formation can be triggered by occasional, random emissions of cAMP from randomly chosen amoeba. The physical reasoning is that when the amoeba begin to starve, they all emit small amounts of cAMP spontaneously, with no special triggering amoeba to start the process. The results show that initially the noise creates disorder among the amoebas, but after a small amount of time, if a cAMP waves travels around a closed loop, a self sustaining spiral is formed which then controls the aggregation process, Fig.2 This spontaneous formation takes rather longer than the stimulated equivalent, but is equally robust once established.
3.2 Streaming
The formation of streams during aggregation is an interesting property of Dd amoeba. As the cAMP wave propagates along the stream, it travels faster down the centre as the amoeba density is higher in the centre than at the edgesvonOss . This creates a curvature in the wavefront, causing the chemotactically moving amoeba to push towards the centre of the stream, as each wave passes. Diffusion from the edges of the stream excites nearby amoeba which see the strongest gradient of cAMP towards the stream and join. The overall effect is that waves of cAMP make small groups of amoeba form small streams, which attract more amoeba, and the small streams join together to create bigger streams which flow towards the aggregation centre. A further observation is that if the centre of aggregation is a self sustaining spiral, the streams spiral into the aggregation centre, which appears to rotate. This can be seen in Figure 1, where the spiral is rotating in a clockwise direction and the aggregation centre is rotating in the anti-clockwise direction. Figure 2 shows aggregation which has been controlled by the circular waves of cAMP spreading from the auto-cycling amoeba, and in this experiment, the aggregation centre does not appear to be rotating.
3.3 Clumping
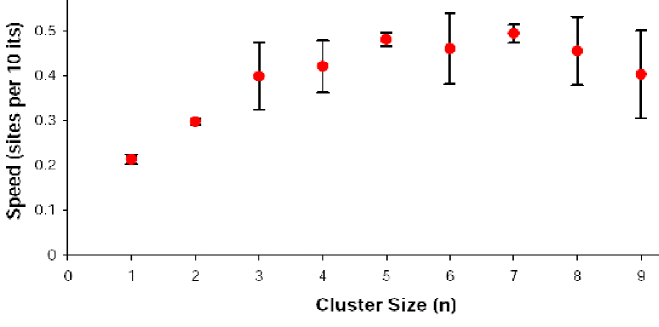
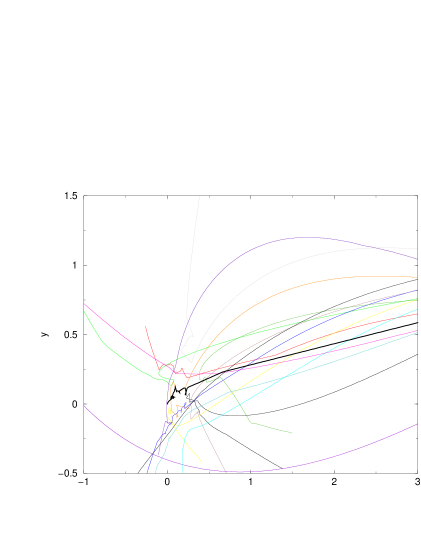
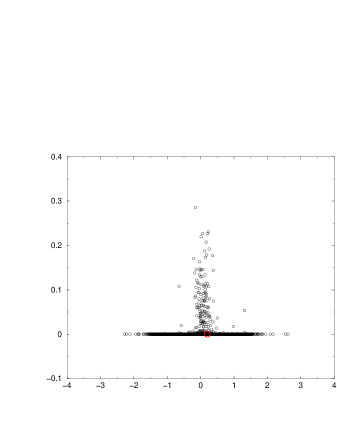
When the amoebas’ resource supply becomes scarce, they need to move to an area with more resources as quickly as they can in order to survive. By grouping together, amoeba travel more quickly than if they move independently. Bonner showed by experiment that this happens in the migrating slug [6]. Figure.3 shows the results of a synthetic experiment to determine how the velocity of a group of amoebas changes with the number of amoeba in the group. We applied a fixed external cAMP gradient and released groups of different sizes to move through chemotaxis. In this experiment, an individual amoeba travels less than half the speed of a larger group, and that for a large n, the speed tends to a constant, which is in accordance with observed experimental resultsInouye .
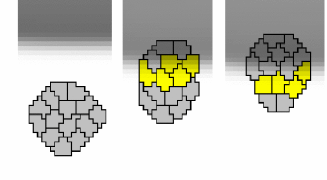
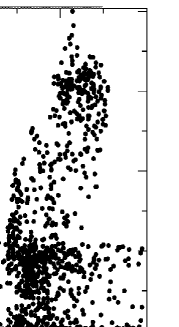
There are several reasons why amoeba move faster in a group, the most dominant effect comes from adhesion between cell membranes. If an amoeba moves independently, it can travel a short distance during its excited period. If this amoeba is surrounded by other amoebas, it gets pulled along by the amoeba moving before it and pushed by the amoeba moving after it, travelling further for each wave of cAMP. This experiment used a static cAMP field to demonstrate the how the pushing and pulling motion and adhesion allow amoeba to travel faster in a group. Other effects arise when waves of cAMP are used. Figure4 shows the motion of a group of amoeba when a wave of cAMP is passed over them. With no cAMP present, they adopt circular shape to minimise the boundary. As a wave of cAMP passes through, the group elongates as the amoeba at the front move up the wave front. This elongation makes the amoeba at the rear of the group move forward to minimise the surface once again.
4 Forming a slug in 3D
To investigate slug formation we coarse-grain the model described above, representing the amoeba as point particles and the cAMP field as an attraction to the pacemaker. This model becomes essentially a molecular dynamics calculation. These are serious simplifications, but as we shall see this model captures the relevant dynamic instabilities which cause particles to form a tower.
The interactions in the model are gravity, the reaction force of the ground, 3-dimensional stochastic noise, viscous damping, interacting amoebas of finite size, and the response to signalling. Gravity provides a constant downward force, and the ground reaction force is perfectly inelastic (if any amoeba attempts to move below z=0, its velocity is set to zero and position to z=0). The stochastic force is drawn randomly from a uniform distribution at each timestep, the damping force is proportional to velocity, and in the opposite direction. The amoebas are described by a Lennard-Jones 11-5 potential, which gives a separation-dependent force with a short-range repulsion and a long-range attraction. This determines the size of the amoebas, makes them slightly sticky when they approach one another and implicitly gives them spherical symmetry. In keeping with our fundamental approach, we regard this as the simplest assumption which is still reasonable. It would certainly be possible to use elliptical amoebas (or some other shape) or a deformable membrane containing incompressible fluid. If our aim were simulation of a specific organism this would be appropriate; however in the hope of obtaining generic trends, we prefer the simpler approach.
The signalling between amoebas and consequent self-propulsion is similarly simple. One amoeba is assumed to start signalling, and all others move towards it. The assumption is that each individual amoeba is motile, either dragging itself along any available surface or propelling itself with flagellae. The specific mechanism is unimportant to the general argument, but the motion is initially confined to the xy direction since the amoebas cannot fly. For states where all the amoebas are packed together (all those investigated here) any self-propulsion upward in the z direction would be either impossible (for a surface amoeba) or counterbalanced by the downward pull of similarly self-propelled amoebas below. More complex signalling, such as the relayed cAMP chemicals emitted by slime molds, has been investigated by previously, producing realistic simulations of actual organisms. Here, again, we seek to find the structures realised by the simplest possible signalling.
The equations of motion are integrated using a velocity verlet algorithm.
The mechanism by which the original amoeba starts to signal is unimportant: in particular we do not propose that there is anything special about it except that it changes to the signalling state. For example, it could even be the first amoeba to die of starvation, and the ”signal” could be the decay products of decomposition. As we shall see, there is nothing in the subsequent behaviour which confers any particular advantage on the signalling amoeba.
Specifically, the force on each amoeba is:
| (3) |
The observed behaviour depends, of course, on the strengths of the various interactions and the number of amoebas. A basic reference shape is a low dome or a sphere, which would be adopted in the absence of signalling by particles interacting via the potential, gravity and stochastic noise alone. These shapes are typical of those adopted by liquid drops, determined by a balance between surface tension and gravity.
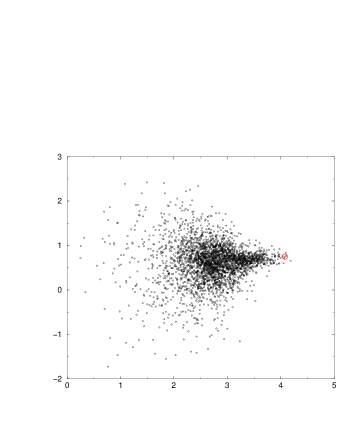
The addition of signalling introduces qualitatively different behaviour. Assuming the signalling amoeba is located somewhere near the centre, the other amoebas stream inward radially, or spirally, if the central amoeba is moving (see figure 1). This motion generates an external pressure on the resulting colony which increases as the amoebas become more tightly packed. Eventually an instability in the third dimension occurs, and the centre of the colony is lifted up. The inward pressure continues and a tower is formed. The signalling amoeba is toward the top of the tower, since it was at the centre of inward motion and therefore near the point of highest pressure where the instability first sets in, it will be one of the first (not necessarily the first) to be uplifted (fig 2).
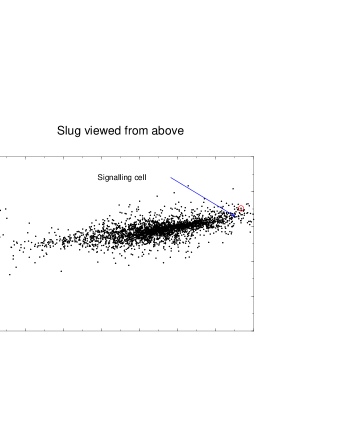
The next phase depends on the number or particles present and the strength of the interamoeba potential. With a few hundred particles the tower of amoebas is stable, with the signalling amoeba ultimately gathering a surrounding blob of amoebas atop a thinner stem (see figure 3). With more particles (a few thousand), the tower grows taller and thinner until ultimately it becomes unstable against toppling over. The toppling instability occurs while the signaller is still near the top (Fig 4), and so the fallen tower has self-organised into a slug shape with the signaller at its head. The amoebas continue to move towards the signaller, pushing it forward and the slug moves off at high coordinated velocity (Fig 5). While some amoebas can get left behind, the slug maintains its multicellular integrity, with the signaller toward the front almost indefinitely.
Thus the effect of signalling is to produce three structures which would not occur for ”inert” amoeba particles: the stem-and-ball, the tower and the slug
4.1 Relevance to Dictyostelium Discoideum
The shapes predicted by our simple model are remarkably similar to those observed in the slime moldsbonbook . The slime mold has fruiting bodies, towers and slugs, of similar general shape to what the model predicts. In fact, real mold shapes are more pronounced than the self assembling shapes we observe, and these shapes are supported by differentiation of amoebas for specialist tasks (stalk and ball) and enhanced by slime excretion. It is interesting, however, that these basic shapes are just those which can self-assemble in response to a simple ”come hither” signal. It is plausible that a primitive single amoeba organism, developing the signalling mechanism, found the self-assembling multicellular shapes evolutionarily advantageous, perhaps in foraging (using the coordinated movement of the slug) or in dispersal (from the fruiting body). If so, adaptations such as differentiation and slime emission which enhance these basic, advantageous shapes could accrue incrementally. It is possible that a suitable genetic analysis might establish whether signalling evolved before slime emission and slime emission before stalk amoeba differentiation. It is also possible that primitive organisms still exist which do not excrete slime and, though ancestral to the slime molds, are not classified with them.
We note that the adaptation to signalling does not confer any advantage to the signalling amoeba in the absence of other amoebas. Shape formation may confer advantages to the colony as a whole, and this group advantage is feeds back as a marginal advantage to the signaller (along with all others in the colony).
5 Previous Dictyostelium Models
A number of previous authors have simulated dictyostelium, and it is interesting to compare our work with them. An important distinction should be drawn; other models assume the feature of modern dictyostelium, and are thus more complex and specific to the system. Much of the modelling is devoted to streaming and spiral formation in the aggregation stagecohen1 ; cohen2 ; dall ; McN ; Pals ; Lev1 ; Lev2 . Our model captures the streaming and cAMP spiral formation with distinct CA amoeba and without requiring autocyclers. Also, many of the previous studies were in 2D: a feature of this work is that the self-assembly of the slug is necessarily 3D. Most notably Palsson (2001) simulated 2D slugs in motion and the aggregation process in 3DPals2 ; Pals3 . As in the present case, they report mound formation without upward chemotaxis, although it appears that in their model the mound formation is driven by reducing surface tension, as do fluid-based modelsbret ; Vasi rather than the dynamical instability which gives rise to our towers (Fig 1). Contrariwise, in the model of Levine et al (1997)Lev2 the three dimensional behavior arises from a probabalistic climbing mechanism: broadly, each amoeba climbs rather than being pushed up. The model of slug motion arising here, of all amoebas pushing forward, is broadly similar to that of Dormann and Weijer (1997, 2002)dorm ; dorm2 .
6 Conclusions
The results obtained using the CA-DE model show a strong similarity to the real Dictyostelium Discoideum, reproducing the streaming behaviour and the spiral patterns during aggregation. The model was then used to examine how the streams form and why the amoeba move faster when in a group than travelling individually. Finally, a result which has not been previously seen, the model was used to show that auto-cycling amoeba are not necessary to trigger the aggregation process.
The full CA-DE model is computationally expensive and could not be extended into three dimensions for the timescales needed to obtain mound and slug formation. Therefore, another simple model has been presented to examine the shapes which can form in response to a simple signal emitted by one amoeba which attracts others. We find that ball-stalk shapes and multiamoeba slugs self-assemble in response to signalling by a single amoeba. In view of the simplicity of our model, it is likely that these simple shapes would be typical of primitive self-assembling organisms, and indeed they do resemble the multiamoeba components of modern slime molds, albeit without slime.
Our model is less complex than previous work, and thus less directly applicable to the details of each aspect of the life cycle of modern slime molds. It does nevertheless capture the streaming, tower building, slug self assembly and slug motion exhibited by these systems in a single simple model. It also suggests a new picture for the mound/tower formation stage, based on dynamic instability due to pressure of incoming amoebas, rather than deliberate climbing or surface tension.
In view of the model simplicity, and lack of any dictyostelium-specific input, we believe we have shown that the shapes and behaviour of dictyostelium, far from being strange and complex, are just what one would expect from a simple, self-assembling system.
References
- (1) JT Bonner: The origins of multicellularity, Integrative Biology 1 27 (1997)
- (2) Hogeweg,P. Computing an Organism: On the Interface Between Informatic and Dynamic Processes; BioSystems 64: 97-109 (2002)
- (3) [3] JA Glazier and F Graner: Simulation of the differential adhesion driven rearrangement of biological cells; Phys. Rev. E vol 47, number 3: 2128-2154 (1993)
- (4) R. Hanes: M.Phys thesis, University of Edinburgh (2006) (available online at www.ph.ed.ac.uk/nania)
- (5) N.Metropolis, AW Rosenbluth, MN Rosenbluth, AH Teller, and E Teller: Equations of State Calculations by Fast Computing Machines. Journal of Chemical Physics, 21 1087, 1953.
- (6) Steinberg M.S. Reconstruction of Tissues by Dissociated Cells; Science 141, 3579 401 (1963)
- (7) K Inouye and I Takeuchi: Analytical Studies on Migrating Movement of the Pseudoplasmodium of Dictyostelium Discoideum; Protoplasma 99 289(1979)
- (8) C Von Oss, AV Panfilov, P Hogeweg, F Siegert and CJ Weijer Spatial Pattern Formation During Aggregation of the Slime Mould Dictyostelium discoideum; J. theor. Biol. 181 203 (1996)
- (9) JT Bonner: The Cellular Slime Molds Princeton NJ: Princeton University Press (2d ed. 1985).
- (10) MH Cohen and A Robertson: Chemotaxis and the early stages of aggregation in cellular slime molds. J. theor. Biol. 31 119 (1971).
- (11) MH Cohen, and A Robertson: Wave propagation in the early stages of aggregation of cellular slime molds. J. theor. Biol. 31 101 (1971).
- (12) JC Dallon and HG Othmer: A Discrete Cell Model with Adaptive Signaling for Aggregation of Dictyostelium discoideum. Phil. Trans. R. Soc. Lond. B 352 391-417 (1997).
- (13) JG McNally, and EC Cox: Geometry and spatial patterns in Polysphondylium pallidum. Devl. Genet. 9 663 (1998).
- (14) E Palsson and EC Cox: Origin and evolution of circular waves and spirals in Dictyostelium discoideum territories. Proc. Natl. Acad. Sci. U.S.A. 93 1151 (1996).
- (15) H Levine The dynamics of Dictyostelium development Physica A 249 53 (1998)
- (16) H Levine, L Tsimring, and D Kessler, Computational modelling of mound development in Dictyostelium Physica D 106 375 (1997).
- (17) E Palsson: A three dimensional model of cell movement in multicellular organisms Future Generation Computer Systems 17 835 (2001)
- (18) E Palsson: The cAMP signaling system in Dictyostelium discoideum. Phd Thesis Princeton University (1996)
- (19) T Bretschneider, B Vasiev, and CJ Weijer, A model for slug movement. J. Theor. Biol. 199 125 (1999)
- (20) B Vasiev, F Siegert, and C.J. Weijer: A hydrodynamic model approach for Dictyostelium mound formation. J. Theor. Biol. 184 441 (1997)
- (21) D Dormann, CJ Weijer, and F. Siegert Twisted scroll waves organize Dictyostelium mucoroides slugs. J.Cell Sci., 110 1831 (1997)
- (22) D. Dormann, and CJ Weijer Waves propagation in dictyostelium slugs. J.Cell Sci., 110, 1831 (2002)