CURRENT NOISE IN QUANTUM POINT CONTACTS
We present measurements of current noise in quantum point contacts as a function of source-drain bias, gate voltage, and in-plane magnetic field. At zero bias, Johnson noise provides a measure of the electron temperature. At finite bias, shot noise at zero field exhibits an asymmetry related to the 0.7 structure in conductance. The asymmetry in noise evolves smoothly into the symmetric signature of spin-resolved electron transmission at high field. Comparison to a phenomenological model with density-dependent level splitting yields quantitative agreement. Additionally, a device-specific contribution to the finite-bias noise, particularly visible on conductance plateaus (where shot noise vanishes), agrees quantitatively with a model of bias-dependent electron heating.
The experimental discovery nearly two decades ago of quantized conductance in quantum point contacts (QPCs) suggested the realization of an electron waveguide. Pioneering measurements of noise in QPCs almost a decade later observed suppression of shot noise below the Poissonian value due to Fermi statistics, as predicted by mesoscopic scattering theory . Shot noise has since been increasingly recognized as an important probe of quantum statistics and many-body effects , complementing dc transport. For example, shot-noise measurements have been exploited to directly observe quasiparticle charge in strongly correlated systems , as well as to study interacting localized states in mesoscopic tunnel junctions and cotunneling and dynamical channel blockade in quantum dots.
Paralleling these developments, a large literature has emerged concerning the appearance of an additional plateau-like feature in transport through a QPC at zero magnetic field, termed 0.7 structure. Experiment and theory suggest that 0.7 structure is a many-body spin effect. Its underlying microscopic origin remains an outstanding problem in mesoscopic physics. This persistently unresolved issue is remarkable given the simplicity of the device.
In this article, we review our recent results on current noise in quantum point contacts—including shot-noise signatures of 0.7 structure and effects of in-plane field —and present new results on a device-specific contribution to noise that is well described by a model that includes bias-dependent heating in the vicinity of the QPC. Notably, we observe suppression of shot noise relative to that predicted by theory for spin-degenerate transport near at , consistent with previous work . The suppression near evolves smoothly with increasing into the signature of spin-resolved transmission. We find quantitative agreement between noise data and a phenomenological model for a density-dependent level splitting , with model parameters extracted solely from conductance. In the final section, we investigate a device-specific contribution to the bias-dependent noise, particularly visible on conductance plateaus (where shot noise vanishes), which we account for with a model of Wiedemann-Franz thermal conduction in the reservoirs connecting to the QPC.
DC transport
Measurements are presented for two QPCs defined by split gates on heterostructures grown by molecular beam epitaxy. For QPC 1(2), the two-dimensional electron gas [2DEG] 190(110) nm below the heterostructure surface has density and mobility . Except where noted, all data are taken at the base temperature of a cryostat, with electron temperature of 290 mK. A magnetic field of 125 mT, applied perpendicular to the plane of the 2DEG, was used to reduce bias-dependent heating (see section below). Each QPC is first characterized at both zero and finite using dc transport measurements. The differential conductance (where is the current and is the source-drain bias) is measured by lock-in technique with an applied excitation at 430 Hz . The -dependent ohmic contact and reservoir resistance in series with the QPC is subtracted.
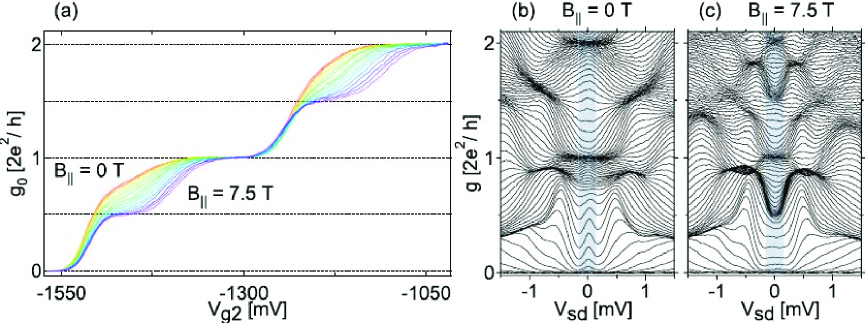
Figure 1 shows conductance data for QPC 1 [see micrograph in Fig. 2(a)]. Linear-response conductance as a function of gate voltage , for to 7.5 T in steps of 0.5 T, is shown in Fig. 1(a). The QPC shows the characteristic quantization of conductance in units of at , and the appearance of spin-resolved plateaus at multiples of at . Additionally, at , a shoulder-like 0.7 structure is evident, which evolves continuously into the spin-resolved plateau at high .
Figures 1(b) and 1(c) show as a function of for evenly spaced settings at and 7.5 T, respectively. In this representation, linear-response plateaus in Fig. 1(a) appear as accumulated traces around at multiples of for , and at multiples of for . At finite , additional plateaus occur when a sub-band edge lies between the source and drain chemical potentials . The features near (V) at cannot be explained within a single-particle picture . These features are related to the 0.7 structure around and resemble the spin-resolved finite bias plateaus at for T .
Current noise
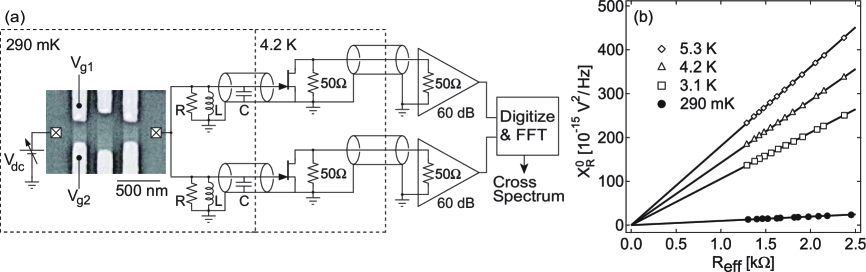
The QPC current noise is measured using a cross-correlation technique to suppress amplifier voltage noise [see Fig. 2(a)]. Two parallel channels amplify the voltage fluctuations across a resistor-inductor-capacitor resonator that performs current-to-voltage conversion near the resonant frequency of 2 MHz. Each channel consists of a transconductance stage using a high electron mobility transistor (HEMT) cooled to 4.2 K, followed by amplification at room temperature. The amplified noise signals from both channels are sampled simultaneously by a digitizer, and their cross-spectral density calculated by fast-Fourier-transform.
Thermal noise and calibration
Measurement of Johnson (thermal) noise allows calibration of and the geometric mean of the voltage gain in the amplification channels, both needed to extract bias-dependent QPC noise. The calibration procedure illustrated in Fig. 2(b) stems from the relation valid at , where is the cross-spectral density on resonance and is the effective resistance from the HEMT gates to ground. is measured from the half-power bandwidth of the cross-spectral density . At elevated refrigerator temperatures , where electrons are well thermalized to a calibrated thermometer, a measurement of as a function of (tuned through ) allows a calibration of , which is found to be . This value of is then used to determine from the same measurement at base temperature.
Bias-dependent noise
To characterize QPC noise at finite bias, we define the excess noise, , where is the total QPC current noise spectral density. Note that is the noise in excess of rather than and thus differs from excess noise as discussed in Refs. 3 and 32. In the absence of and telegraph noise as well as bias-dependent electron heating, originates from the electron partitioning at the QPC.
Experimental values for are extracted from simultaneous measurements of , and using the relation
| (1) |
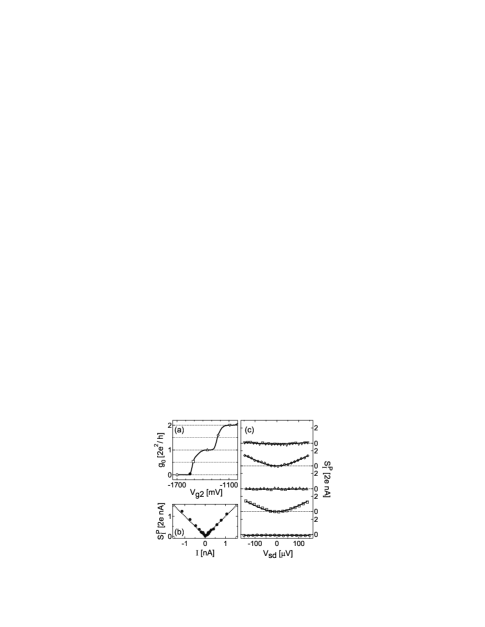
With an integration time of 60 s, the resolution in is , corresponding to full shot noise of . as a function of dc current for QPC 1 with gates set to very low conductance () [Fig. 3(b)] exhibits full shot noise, , demonstrating an absence of and telegraph noise at the noise measurement frequency .
Figure 3(c) shows in the range to [shaded regions in Figs. 1(b) and 1(c)], at and settings corresponding to open markers in Fig. 3(a). Similar to when the QPC is fully pinched off, vanishes on plateaus of linear conductance. This demonstrates that bias-dependent electron heating is not significant in QPC 1. In contrast, for and , grows with and shows a transition from quadratic to linear dependence . The linear dependence of on at high bias further demonstrates the absence of noise due to resistance fluctuations. Solid curves superimposed on the data in Fig. 3(c) are best-fits to the form
| (2) |
with the noise factor as the only free fitting parameter. Note that relates to , in contrast to the Fano factor , which relates to . This fitting function is motivated by mesoscopic scattering theory , where transport is described by transmission coefficients ( is the transverse mode index and denotes spin) and partition noise originates from the partial transmission of incident electrons. Within scattering theory, the full expression for is
| (3) |
where is the Fermi function in the source (drain) lead. Equation (2) follows from Eq. (3) only for the case of constant transmission across the energy window of transport, with . Furthermore, for spin-degenerate transmission, vanishes at multiples of and reaches the maximal value 0.25 at odd multiples of . Energy dependence of transmission can reduce the maximal value below 0.25, as discussed below.
While Eq. (2) is motivated by scattering theory, the value of extracted from fitting to Eq. (2) simply provides a way to quantify experimentally for each . We have chosen the bias range for fitting to minimize nonlinear-transport effects while extending beyond the quadratic-to-linear crossover in noise that occurs on the scale .
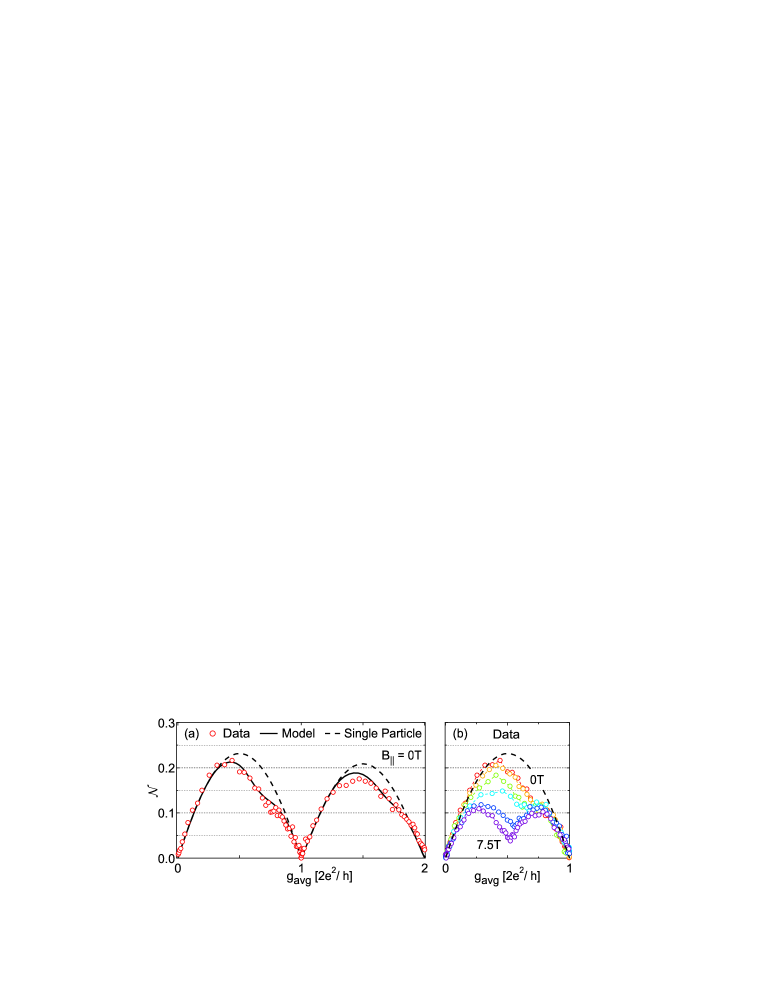
The dependence of on conductance at is shown in Fig. 4(a), where is extracted from measured at 90 values of . The horizontal axis, , is the average of the differential conductance over the bias points where noise was measured. has the shape of a dome, reaching a maximum near odd multiples of and vanishing at multiples of . The observed deviates from the spin-degenerate, energy-independent scattering theory in two ways. First, there is a reduction in the maximum amplitude of below . Second, there is an asymmetry in with respect to , resulting from a noise reduction near the 0.7 feature. A similar but weaker asymmetry is observed about . The reduction in the maximum amplitude can be understood as resulting from an energy dependence of transmissions ; the asymmetry is a signature of 0.7 structure, as we now discuss.
0.7 structure
We investigate further the relation between the asymmetry in and the 0.7 structure by measuring the dependence of on . As shown in Fig. 4(b), evolves smoothly from a single asymmetric dome at to a symmetric double dome at . The latter is a signature of spin-resolved electron transmission. Notably, for between 0.7 and 1 (in units of ), is insensitive to , in contrast to the dependence of near .
We compare these experimental data to the shot-noise prediction of a phenomenological model for the 0.7 anomaly. This model, originally motivated by dc transport data, assumes a lifting of the twofold spin degeneracy of mode by an energy splitting that grows linearly with 1D density (with proportionality ) within that mode. Here, and , where is the source(drain) chemical potential and is the electron effective mass. Parameters of the phenomenological model are extracted solely from conductance. The lever arm converting to energy (and hence ) as well as the transverse mode spacing are extracted from transconductance data [Fig. 5(a)] . Using an energy-dependent transmission for a saddle-point potential , the value (potential curvature parallel to the current) is found by fitting linear conductance below (below for the second mode), and is obtained by fitting above , where (within the model) the splitting is largest [see Fig. 5(b)]. We find is and for the first (second) mode. Note that the splitting is two orders of magnitude smaller than the direct Coulomb energy of electrons spaced by . Using these parameters, is calculated using Eq. (3), and is then extracted by fitting to Eq. (2). The calculated values of at are shown along with the experimental data in Fig. 4(a). For comparison we include calculation results accounting for energy-dependent transmission without splitting (). The overall reduction of arises from a variation in transmission across the bias window (comparable to ), and is a single-particle effect. On the other hand, asymmetry of about and requires nonzero .
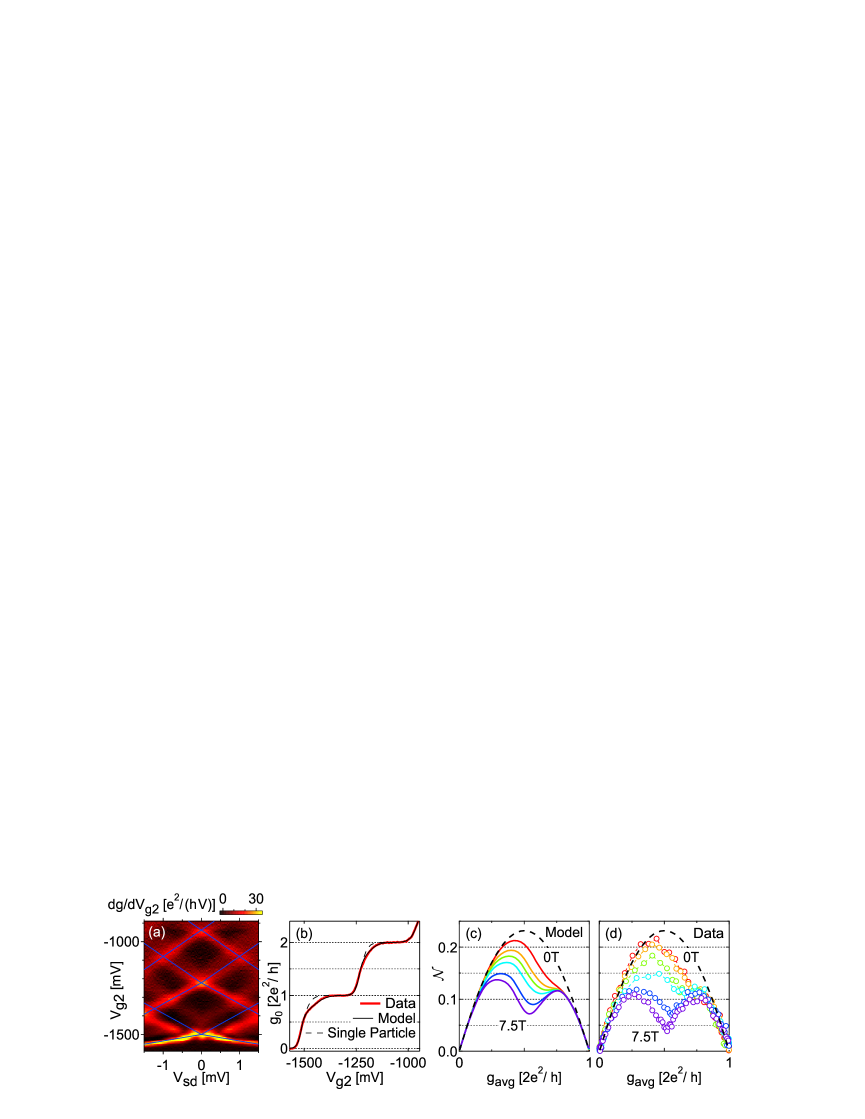
Magnetic field is included in the model by assuming a g-factor of 0.44 and adding the Zeeman splitting to the density-dependent splitting, maintaining the parameters obtained above. Figure 5(c) shows calculated at corresponding to the experimental data, reproduced in Fig. 5(d). Including the magnetic field in quadrature or as a thermally weighted mixture with the intrinsic density-dependent splitting gives essentially indistinguishable results within this model. Model and experiment show comparable evolution of with : the asymmetric dome for evolves smoothly into a double dome for 7.5 T, and for conductance , the curves for all fields overlap closely. Some differences are observed between data and model, particularly for . While the experimental double dome is symmetric with respect to the minimum at , the theory curve remains slightly asymmetric with a less-pronounced minimum. We find that setting the g-factor to in the model reproduces the measured symmetrical double dome as well as the minimum value of at . This observation is consistent with reports of an enhanced g-factor in QPCs at low density .
Recent theoretical treatments of 0.7 structure have also addressed its shot-noise signature. Modelling screening of the Coulomb interaction in the QPC, Lassl et al. qualitatively reproduce the -dependent . Jaksch et al. find a density-dependent splitting in density-functional calculations that include exchange and correlation effects. This theory justifies the phenomenological model and is consistent with the observed shot-noise suppression. Using a generalized single-impurity Anderson model motivated by density-functional calculations that suggest a quasi-bound state , Golub et al. find quantitative agreement with the -dependent .
Bias-dependent electron heating
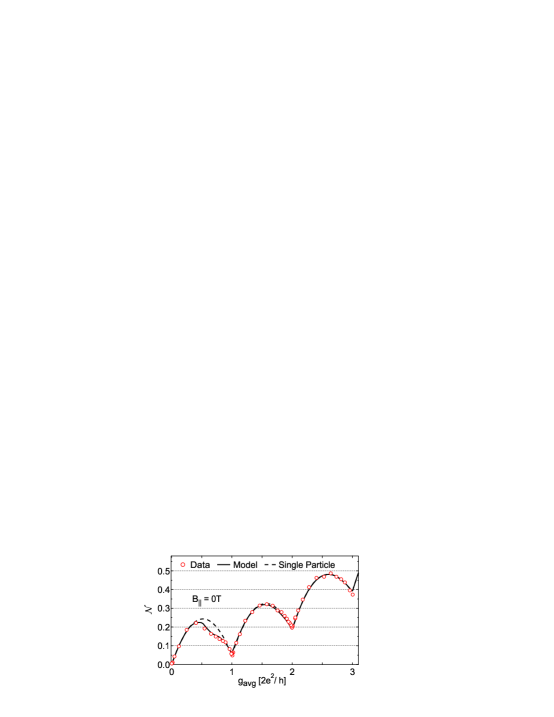
In contrast to QPC 1, noise data in QPC 2 show evidence of bias-dependent electron heating. Figure 6 shows at over the first three conductance steps, extracted from fits using Eq. (2) to data over the range at 50 gate voltage settings. As in Fig. 4(a), a clear asymmetry in the noise factor is observed, associated with enhanced noise reduction near . For this device, remains finite on conductance plateaus, showing super-linear dependence on plateau index. This is consistent with bias-dependent thermal noise resulting from electron heating. Following Ref. 4, we incorporate into our model the bias-dependent electron temperature , where is the parallel conductance of the reservoirs connecting to the QPC. This expression models diffusion by Wiedemann-Franz thermal conduction of the heat flux on each side of the QPC and of Joule heating in the reservoirs, assuming ohmic contacts thermalized to the lattice at . In the absence of independent measurements of reservoir and ohmic contact resistances, we treat as a single free parameter.
Theoretical curves including effects of bias-dependent heating are obtained from fits to Eq. (2) of calculated . Parameters and for the first three modes (in increasing order) are extracted from conductance data. To avoid complications arising from a zero-bias anomaly present in this device, is extracted from the splitting of the first sub-band edge in the transconductance image , rather than from linear conductance. Other parameters are extracted in the same way as for QPC 1. As shown in Fig. 6, quantitative agreement with the data is obtained over the three conductance steps with .
In conclusion, we have presented measurements of current noise in quantum point contacts as a function of source-drain bias, gate voltage, and in-plane magnetic field. We have observed a shot-noise signature of the 0.7 structure at zero field, and investigated its evolution with increasing field into the signature of spin-resolved transmission. Comparison to a phenomenological model with density-dependent level splitting yielded quantitative agreement, and a device-specific contribution to bias-dependent noise was shown to be consistent with electron heating.
Acknowledgments
We thank H.-A. Engel, M. Heiblum, L. Levitov, and A. Yacoby for valuable discussions, and S. K. Slater, E. Onitskansky, N. J. Craig, and J. B. Miller for device fabrication. We acknowledge support from NSF-NSEC, ARO/ARDA/DTO, and Harvard University.
References
References
- [1]
- [2] B. J. van Wees et al., Phys. Rev. Lett. 60, 848 (1988).
- [3] D. A. Wharam et al., J. Phys. C 21, L209 (1988).
- [4] M. Reznikov et al., Phys. Rev. Lett. 75, 3340 (1995).
- [5] A. Kumar et al., Phys. Rev. Lett. 76, 2778 (1996).
- [6] R. C. Liu et al., Nature 391, 263 (1998).
- [7] G. B. Lesovik, Pis’ma Zh. Eksp. Teor. Fiz. 49, 513 (1989) [JETP. Lett. 49, 592 (1989)].
- [8] M. Büttiker, Phys. Rev. Lett. 65, 2901 (1990).
- [9] Ya. M. Blanter and M. Büttiker, Phys. Rep. 336, 1 (2000); Ya. M. Blanter, cond-mat/0511478.
- [10] T. Martin in Nanophysics: Coherence and Transport, Les Houches Session LXXXI, eds. H. Bouchiat et al. (Elsevier, Amsterdam, 2005), cond-mat/0501208.
- [11] R. de-Picciotto et al., Nature 389, 162 (1997); M. Reznikov et al., Nature 399, 238 (1999).
- [12] L. Saminadayar et al., Phys. Rev. Lett. 79, 2526 (1997).
- [13] X. Jehl et al., Nature 405, 50 (2000).
- [14] S. S. Safonov et al., Phys. Rev. Lett. 91, 136801 (2003).
- [15] E. Onac et al., Phys. Rev. Lett. 96, 026803 (2006).
- [16] S. Gustavsson et al., Phys. Rev. B 74, 195303 (2006).
- [17] Y. Zhang et al., cond-mat/0703419.
- [18] K. J. Thomas et al., Phys. Rev. Lett. 77, 135 (1996).
- [19] A. Kristensen et al., Phys. Rev. B 62, 10950 (2000).
-
[20]
D. J. Reilly et al., Phys. Rev. B 63, 121311(R) (2001); D. J. Reilly et al., Phys. Rev. Lett.
89, 246801 (2002). - [21] S. M. Cronenwett et al., Phys. Rev. Lett. 88, 226805 (2002).
- [22] W. D. Oliver, Ph.D. Dissertation, Stanford University, 2002.
- [23] L. P. Rokhinson et al., Phys. Rev. Lett. 96, 156602 (2006).
- [24] C. K. Wang and K.-F. Berggren, Phys. Rev. B 54, 14257(R) (1996).
- [25] H. Bruus et al., Physica E 10, 97 (2001).
- [26] Y. Meir et al., Phys. Rev. Lett. 89, 196802 (2002).
- [27] K. A. Matveev, Phys. Rev. Lett. 92, 106801 (2004).
- [28] A. Ramšak and J. H. Jefferson, Phys. Rev. B 71, 161311(R) (2005).
- [29] D. J. Reilly, Phys. Rev. B 72, 033309 (2005); D. J. Reilly et al., Physica E 34, 27 (2006).
- [30] L. DiCarlo et al., Phys. Rev. Lett. 97, 036810 (2006).
- [31] L. DiCarlo et al., Rev. Sci. Instrum. 77, 073906 (2006).
- [32] M. Avinun-Kalish et al., Phys. Rev. Lett. 92, 156801 (2004).
- [33] P. Roche et al., Phys. Rev. Lett. 93, 116602 (2004).
- [34] L. P. Kouwenhoven et al., Phys. Rev. B 39, 8040(R) (1989).
- [35] Y. Chen and R. A. Webb, Phys. Rev. B 73, 035424 (2006).
- [36] N. K. Patel et al., Phys. Rev. B 44, 13549 (1991).
- [37] M. Büttiker, Phys. Rev. B 41, 7906(R) (1990).
- [38] A. Lassl et al., Phys. Rev. B 75, 045346 (2007).
- [39] P. Jaksch et al., Phys. Rev. B 74, 235320 (2006).
- [40] T. Rejec and Y. Meir, Nature 442, 900 (2006).
- [41] A. Golub et al., Phys. Rev. Lett. 97, 186801 (2006).