Rotation and activity of pre-main-sequence stars
Abstract
Rotation and activity are key parameters in stellar evolution and can be used to probe basic stellar physics. Here we present a study of rotation (measured as projected rotational velocity ) and chromospheric activity (measured as H equivalent width) based on an extensive set of high-resolution optical spectra obtained with the MIKE instrument on the 6.5 m Magellan Clay telescope. Our targets are 74 F–M dwarfs in the young stellar associations Chamaeleontis, TW Hydrae, Pictoris, and Tucana-Horologium, spanning ages from 6 to 30 Myr. While the H equivalent widths for most F and G stars are consistent with pure photospheric absorption, most K and M stars show measurable chromospheric emission. By comparing H equivalent width in our sample to results in the literature, we see a clear evolutionary sequence: Chromospheric activity declines steadily from the T Tauri phase to the main sequence. Using activity as an age indicator, we find a plausible age range for the Tuc-Hor association of 10–40 Myr. Between 5 and 30 Myr, we do not see evidence for rotational braking in the total sample, thus angular momentum is conserved, in contrast to younger stars. This difference indicates a change in the rotational regulation at 5–10 Myr, possibly because disk braking cannot operate longer than typical disk lifetimes, allowing the objects to spin up. On timescales of Myr there is some evidence for weak rotational braking, possibly due to stellar winds. The rotation-activity relation is flat in our sample; in contrast to main-sequence stars, there is no linear correlation for slow rotators. We argue that this is because young stars generate their magnetic fields in a fundamentally different way from main-sequence stars, and not just the result of a saturated solar-type dynamo. By comparing our rotational velocities with published rotation periods for a subset of stars, we determine ages of Myr and Myr for the Cha and TWA associations, respectively, consistent with previous estimates. Thus we conclude that stellar radii from evolutionary models by Baraffe et al. (1998) are in agreement with the observed radii within %.
1 Introduction
About a decade ago, only a few nearby low-mass stars with ages between 5 and 30 Myr were known. Therefore, our knowledge about stellar evolution in this pre-main-sequence (and post-T Tauri) phase depended largely on interpolating between the well-studied clusters at ages Myr, e.g. the Orion nebula cluster (ONC), IC 348, and NGC 2264, and benchmark zero age main sequence (ZAMS) clusters with ages between 30 and 100 Myr, e.g. the Pleiades, IC 2391, and Per. In the last ten years, however, several nearby and young stellar associations have been discovered, which provide us with the target samples for in-depth studies of the stellar properties in this critical age range. Most objects in these associations are spread over large areas of the sky, and have been identified primarily based on satellite all-sky survey data from ROSAT, IRAS, or Hipparcos (e.g. Kastner et al., 1997; Mamajek et al., 1999; Barrado y Navascués et al., 1999; Zuckerman & Webb, 2000; Torres et al., 2000; Zuckerman et al., 2001).
This paper concentrates on the Chamaeleontis cluster (hereafter Cha, age 6 Myr), the TW Hydra (TWA, 8 Myr), Pictoris Moving Group (BPMG, 12 Myr), and Tucana-Horologium (TH, Myr) associations (see Zuckerman & Song, 2004, for a review). As these associations are all located within 100 pc of the sun, and for all of them, a significant population of low-mass stars has been identified within the past few years, they are ideal for probing stellar evolution from the T Tauri phase to the main sequence. Two stellar properties that are believed to undergo significant changes in this age range are magnetic activity and rotation, which are the main focus of this paper.
Magnetic activity is a collective term for all phenomena caused by the operation of the stellar dynamo, including photospheric spots, chromospheric flares and plages, and coronal emission. It is observed mainly in the X-rays in the case of coronal activity and in optical emission lines for chromospheric processes. According to our current understanding, main-sequence, sun-like stars generate large-scale magnetic fields by means of an -type dynamo, which operates in the transition layer between convective zone and radiative core (see Schrijver & Zwaan, 2000, and references therein). This type of dynamo is driven by the rotation of the star, and hence a strong rotation-activity correlation is observed for solar-type stars with ages 100 Myr, initially found by Skumanich (1972) and subsequently confirmed by numerous studies (e.g. Patten & Simon, 1996; Terndrup et al., 2000; Barnes, 2001). The correlation, observed both with coronal and chromospheric activity indicators, is usually seen as a linear increase of activity indicators with increasing rotation rate, followed by a saturation of the activity at high rotation rates. Young T Tauri stars, however, are fully convective, and thus cannot harbor a solar-type dynamo. As they evolve to the main-sequence, a change in the magnetic field generation and, as a consequence, in the magnetic activity properties and their connection to stellar rotation can be expected.
The rotation of stars themselves changes critically in the pre-main-sequence phase. As the stars contract hydrostatically to the ZAMS, their rotation rates increase as a consequence of angular momentum conservation. In the first few Myrs of their evolution, the stars are believed to lose significant angular momentum due to magnetic interaction with their circumstellar environments (see Herbst et al., 2007, for a review), either by magnetic coupling between star and disk – a process often referred to as ‘disk locking’, see for example Koenigl (1991); Edwards et al. (1993) – or by an accretion powered stellar wind (Matt & Pudritz, 2005). Once the disk is gone and the accretion has stopped, angular momentum removal is mainly controlled by stellar winds generated by magnetic activity. On the main-sequence, rotational braking by winds leads to a decline of both rotation and potentially (via a rotationally driven dynamo, see above) magnetic activity (Skumanich, 1972; Barnes, 2001). In summary, observational studies of magnetic activity, rotation, and their interrelationship can probe fundamental changes in stellar physics occurring between and 100 Myr.
In this paper we present a study of rotation and activity in young stars with ages between 6 and 30 Myr, based on an extensive set of high-resolution spectra. By comparing the results from the associations listed above with literature data for younger and older clusters, we investigate the pre-main-sequence evolution of these properties. For the first time, we analyze a comprehensive set of H line measurements together with spectroscopic rotational velocities for a large sample of objects in our four target regions. In some sense, this is complementary to the work by de la Reza & Pinzón (2004), who published a rotation/activity study for TWA, BPMG, and TH based on and X-ray data.
In a previous paper, we investigated disk accretion for these associations based on the same multi-epoch dataset (Jayawardhana et al., 2006). Our cleaned target sample for the current paper is introduced in §2. In §3, we present our observations, the data reduction and spectral analysis, as well as a detailed assessment of the measurement uncertainties. Subsequently, we investigate H emission (§4) and rotational velocities (§5) as a function of age and mass. In §5.3 we focus on the rotation/activity connection. By comparing with previously measured rotation periods, we obtain constraints on stellar radii for a subset of the targets (§6). We summarize our results in §7.
2 Target selection and properties
This study is based on multi-epoch spectra of about 100 likely members of the four associations listed in §1. From the total sample, we excluded objects identified as accretors in Jayawardhana et al. (2006), because accretion affects emission lines and thus makes it difficult to assess chromospheric activity reliably. In Jayawardhana et al. (2006), the main criterion to distinguish between accretors and non-accretors is the linewidth of the H emission feature. As thresholds we adopted 10 Å for the equivalent width (EW) and 200 km s-1 for the 10% width. We used the shape of H and additional emission lines like He 6678 Å as complementary probes for accretion. Four objects (two in Cha, two in TWA) are classified as accretors because their linewidths exceed both thresholds and they show He 6678 Å in emission. One additional object, Cha 11, has very broad H as well. Although the EW is below 10 Å, we classified it as an accretor based on a strong red-shifted absorption feature in H, a clear indication of infalling material. In total, five accreting objects were excluded from the rotation/activity analysis in this paper.
Similarly, we excluded known unresolved binaries, since binarity might introduce additional line broadening. Many known binaries in these associations are listed by Zuckerman & Song (2004), a few more have been identified in separate papers, e.g. the close AO-resolved binary TWA 5A (Brandeker et al., 2006). Additionally, the A-stars Pic and TWA 11A as well as the subgiant HD 1555A were removed from the object list. The final cleaned target list comprises 74 stars.
The spectral types for our sources have been collected from Zuckerman & Song (2004) and de la Reza & Pinzón (2004). In a few cases where spectral types are missing in the literature, we obtained an approximate spectral type by simply comparing the appearance of the spectrum with other stars from our sample. For plotting purposes, we convert spectral types to a linear numerical scale, where one unit corresponds to one subclass, and zero is assigned to O0 stars. Spectral type F0 then corresponds to 30 while M0 corresponds to 60.
Our targets span the spectral type range from F5 to M3. The distribution of spectral types favours late-type objects, as the sample includes 36 M- and 19 K-stars. Spectral types are not equally distributed in all four associations: With one exception, all objects in Cha and TWA are K/M-stars. In the two older groups BPMG and TH, however, the distribution is balanced with more F/G-type objects. Effective temperatures have been derived by fitting models to the observed spectra, and the detailed results from this analysis will be published in a forthcoming paper (Mentuch et al., in prep.). In this paper, we make use of these to determine in §5.3.
The magnetic field generation and, as a consequence, magnetic activity and possibly rotation depend critically on the stellar internal structure. For pre-main-sequence stars, it is particularly important to clarify if they are still fully convective or if they already have developed to a solar-like structure with a radiative core and a convective envelope. As outlined in §1, a radiative core is mandatory for the operation of a transition zone, solar-type dynamo, while in fully convective objects alternative dynamo mechanisms are at work. The age at which a radiative core appears is mass-dependent: While solar-mass stars are only fully convective for 1-3 Myr, stars with 0.5 need 10-20 Myr to develop a radiative core. Objects with masses below 0.35 are fully convective throughout their evolution.
We used the theoretical evolutionary tracks by Chabrier & Baraffe (1997) and D’Antona & Mazzitelli (1994, updated version 1998) to assess the internal structure of our targets. In the three youngest associations, Cha, TWA, and Pic, all objects with masses are not anymore fully convective, according to the models, where the depth of the convection zone increases towards higher masses. For TH, the mass limit between radiative and fully convective is roughly at 0.3-0.4, i.e. comparable to the main sequence. Converted to spectral types, this implies that all objects in our sample with spectral types earlier than M0-M2 already have a radiative core. In TH, this applies to all objects earlier than M3. All these limits are subject to uncertainties due to model inconsistencies, age spread, and uncertainties in the mass/temperature/spectral type conversion.
This essentially means that almost all our targets in Cha and TWA are still fully convective or just at the limit to develop a (small) radiative core, while in Pic, six out of 16 objects are clearly already in their radiative evolution. In TH, with its large fraction of K/G/F stars, almost all objects have a substantial radiative core according to the models (i.e. basically a solar-like internal structure); only the three M3 stars may still be fully convective. We will use these considerations as a guideline when discussing evolution in magnetic activity and rotation.
3 Observations, spectral analysis, uncertainties
3.1 Observation and Data Reduction
The observations were taken on 12 nights distributed over four observing runs between December 2004 and July 2005, using the echelle spectrograph MIKE at the Magellan Clay 6.5 m telescope on Las Campanas, Chile. In total, the dataset comprises of high-resolution spectra with each star from our sample being observed on average over 6 times. The availability of multi-epoch data for each star allows for a reliable assessment of variability in the emission lines and provides us with high redundancy in the measurements. For more details about the observing runs, see the log in Jayawardhana et al. (2006). In addition to our target stars, we observed a sample of slowly rotating standard stars covering the spectral range from F8 to M2 from the list of Nidever et al. (2002).
MIKE is a double echelle slit spectrograph, consisting of a blue and a red arm. In this study, we only make use of the red part, with spectral coverage from 4 900 to 9 300 Å. With a 035 slit width and no binning, our spectra have a resolution of 60 000. Depending on the brightness of the target, the integration time was up to 30 min. To accommodate for the slanted spectra and the wavelength dependence of this tilt, we developed a customized software package in ESO-MIDAS for data reduction. The details of this reduction procedure will be discussed in a forthcoming paper (Brandeker et al., in prep.).
3.2 Spectral Analysis
As an indicator of chromospheric magnetic activity, we measured the EW of the H feature at 6 562.8 Å in the multi-epoch spectra in our sample. Depending on the spectral type and the level of chromospheric activity, H is seen either as emission or absorption in our spectra. The EWs are obtained by integrating the H line after continuum subtraction; absorption is defined as positive EW, emission as negative. The continuum is approximated by a linear fit to data points in small regions to the immediate right and left of the feature. These continuum defining regions are between 6 Å and 10 Å in width, which corresponds to 200 to 450 data points in the spectra.
We determined the projected rotational velocity by creating a template from spinning up a slowly rotating standard star of similar spectral type to the target star. The differences in spectral types between target and standard were usually less than two subclasses. The templates are created in 1 km s-1 increments; we adopted as the value which produces the best fit between target and template. This procedure was carried out in three spectral regions for every available spectrum of a given star, with the average value taken to be the final of the target star. The three spectral regions used for the fit have a width of 30 Å and are centered at 5310, 6250, and 6815 Å. They are chosen to avoid emission features and transition regions between different orders of the spectra. Since our earliest spectral type standard is an F7 star, we are unable to obtain measurements for stars that have spectral types significantly earlier than this. The availability of multi-epoch spectra allows us several independent measurements per star for both H EW and . The standard deviation from the average provides an estimate of the consistency of our results and the variability in H. All average H EW and measurements are listed in Tables 1-4.
3.3 Error Analysis
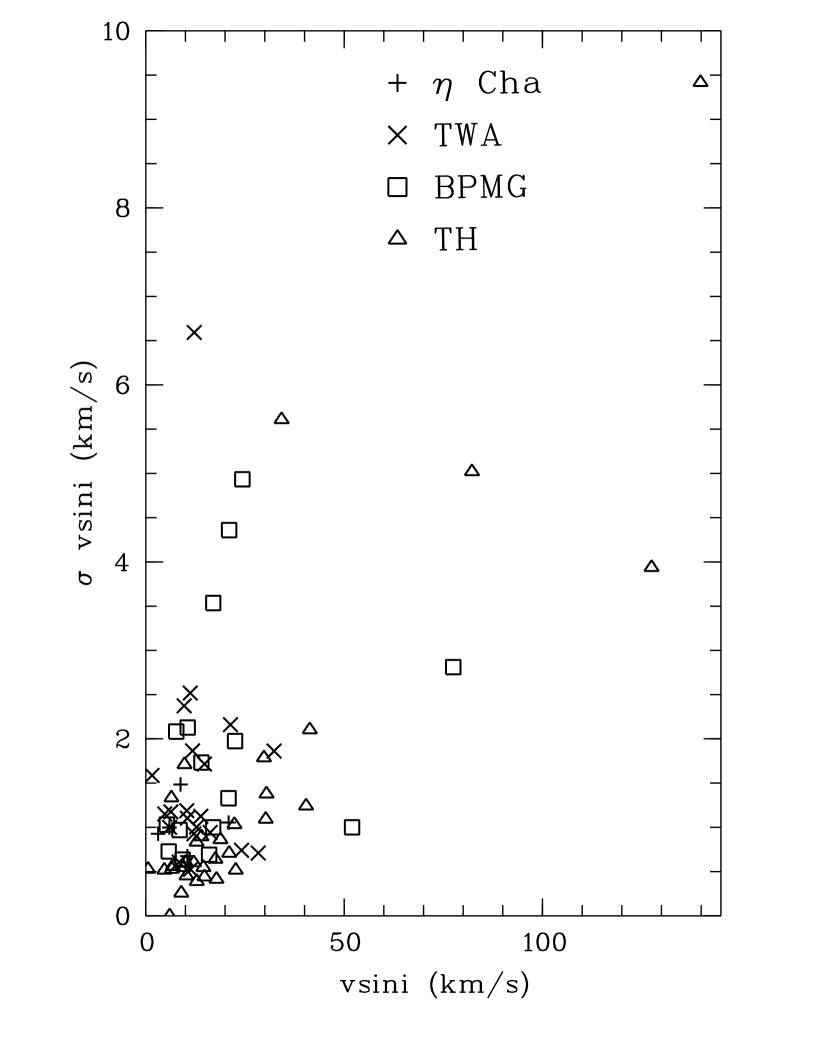
Strong emphasis was placed on the reliability of the rotational velocities. Particularly, we are interested to find the lower limit in for which our results are trustworthy. We analyze the reliability and the accuracy of our measurements in a variety of ways. As explained in §3.2, we measure in three different wavelength bins in each available spectrum of our multi-epoch dataset, giving us at least 3 and on average 15 independent measurements per target. The value adopted for the star is the average over these individual measurements. From the individual measurements for each star we also obtain the standard deviation (of the average EW), a measure for the spread in our datapoints for a given star, and thus a probe for the internal consistency of the method. Fig. 1 shows the standard deviation versus the average value of for all objects. As can be seen in the figure, is less than 2.5 km s-1 for the majority of our objects, confirming the reliability of our method. Only 4 out of 74 stars, or 5%, have standard deviations exceeding 5 km s-1. Thus, a conservative estimate of the internal accuracy in our values is km s-1. We adopt this as a preliminary lower limit. The standard deviation is used in the remainder in the paper as the uncertainty in individual measurements.
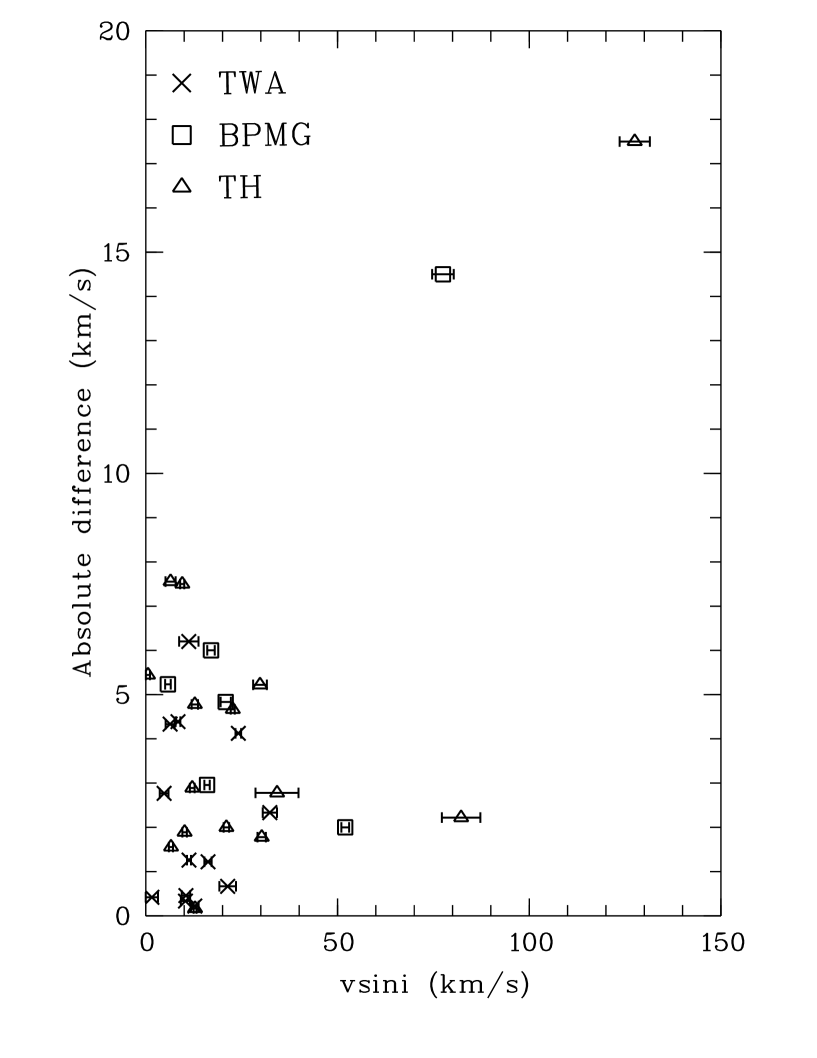
In the next step, we compare the measured with published values, if available. As shown in Fig. 2, the majority of our values are within 8 km s-1 of those obtained from the literature. The two stars for which the difference between the measured and literature measurements exceed this amount are HIP 2729 and PZ Tel, which are both fast rotators with exceeding 60 km s-1. Although the absolute difference between literature and our for both of these stars is large, the relative uncertainty is comparable to the slower rotating objects in the sample. Thus, the comparison with the literature confirms the validity of our measurements. Since this comparison encompasses both the errors in our own values and the errors in the literature values (which are at least 3 km s-1, see Reid (2003)), we find that the absolute average uncertainty in our measurements is comparable to the internal accuracy, which has been found to be 5 km s-1 (see above). Thus, we can safely trust all values down to at least 5 km s-1.
Finally, we explore the reliability of the method by using a standard star (called A in the following) to measure the of another standard (called B) of similar spectral type that has been spun-up to a determined value. That way, we produce a template with known rotational velocity, for which we can test the accuracy. This assumes that our standards are slow rotators with rotational velocities well below our detection limit. Standard B is spun-up in steps of 1 km s-1 between 0 and 10 km s-1. We repeat the measurements reversing the roles of the standards, i.e. switching A and B. These sets of measurements are done for four pairs, representing cases in which we have more than one standard star per spectral type. This produces eight different pairings of standards with the same spectral type. In six of these pairings, the measured approaches zero when the imposed approaches zero, demonstrating that in these cases our method produces highly accurate measurements of . In two pairings, however, the measured levels off at 5 km s-1 for imposed km s-1. The best explanation for this result is that in these cases the standard A has a that is 5 km s-1 greater than that of standard B, and thus we are never able to measure values lower than 5 km s-1. This is evidence for non-negligible rotational velocities in some of our standards, which is probably the dominant source of uncertainty in our measurements. The test shows, however, that these uncertainties are unlikely to exceed 5 km s-1, thus confirming the lower reliability limit for our method. In the following, we treat all values lower than 5 km s-1 as upper limits. We note that this affects only five objects.
We estimate the uncertainty in the measurements of H equivalent width to be on average 0.2 Å. This estimate was arrived at by determining the average value of equivalent width obtained from regions of the continuum close to H that do not contain visible emission or absorption features. As can be seen in Tables 1–4, the standard deviation in the average H EW, calculated over the multi-epoch data, is in many cases clearly higher than the measurement error, indicating significant variability (see §4.2).
4 Magnetic activity
Magnetic activity and its interplay with rotation is a complex problem, as it depends on stellar age, mass, interior structure, and possibly interactions with disks in the early evolution. To disentangle the different processes, we will start in this section by analyzing H EW as a function of age and mass, We note that many of our targets have been identified in X-ray surveys, thus the selection might be biased towards more active objects. Therefore, in the discussion of activity, we prefer to use criteria based on the upper limit of activity in our sample rather than the lower limit, since the latter one might be biased.
4.1 Evolution of chromospheric activity
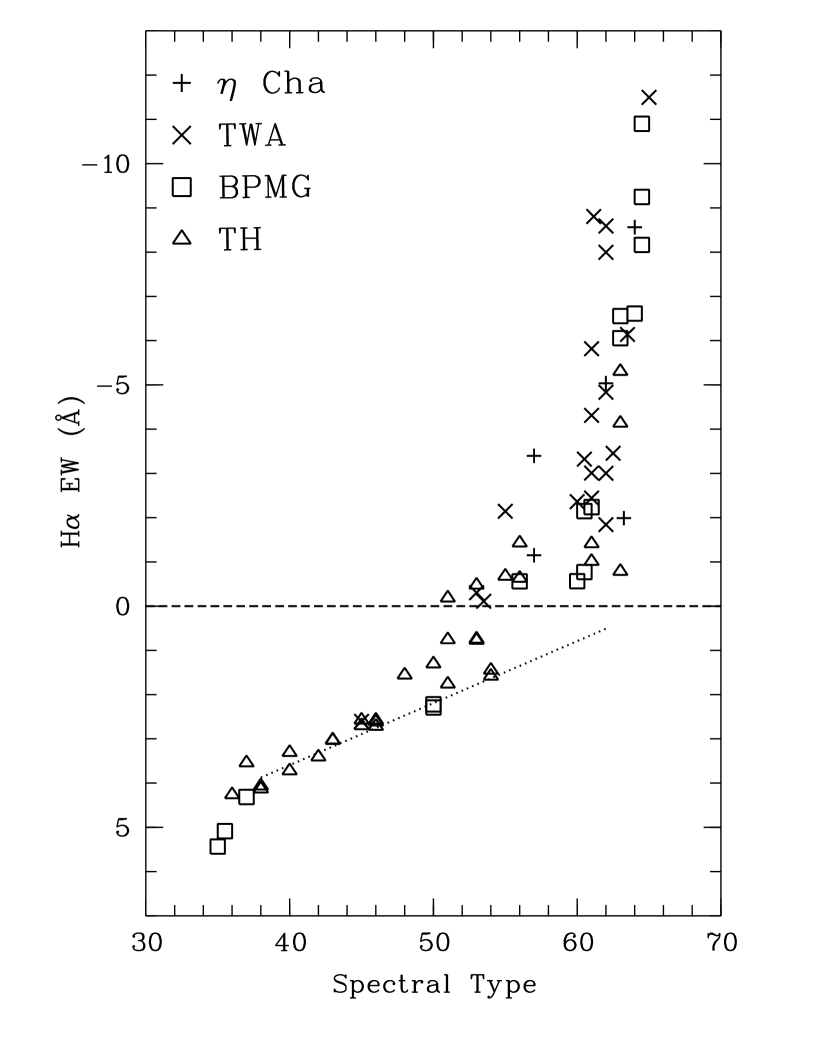
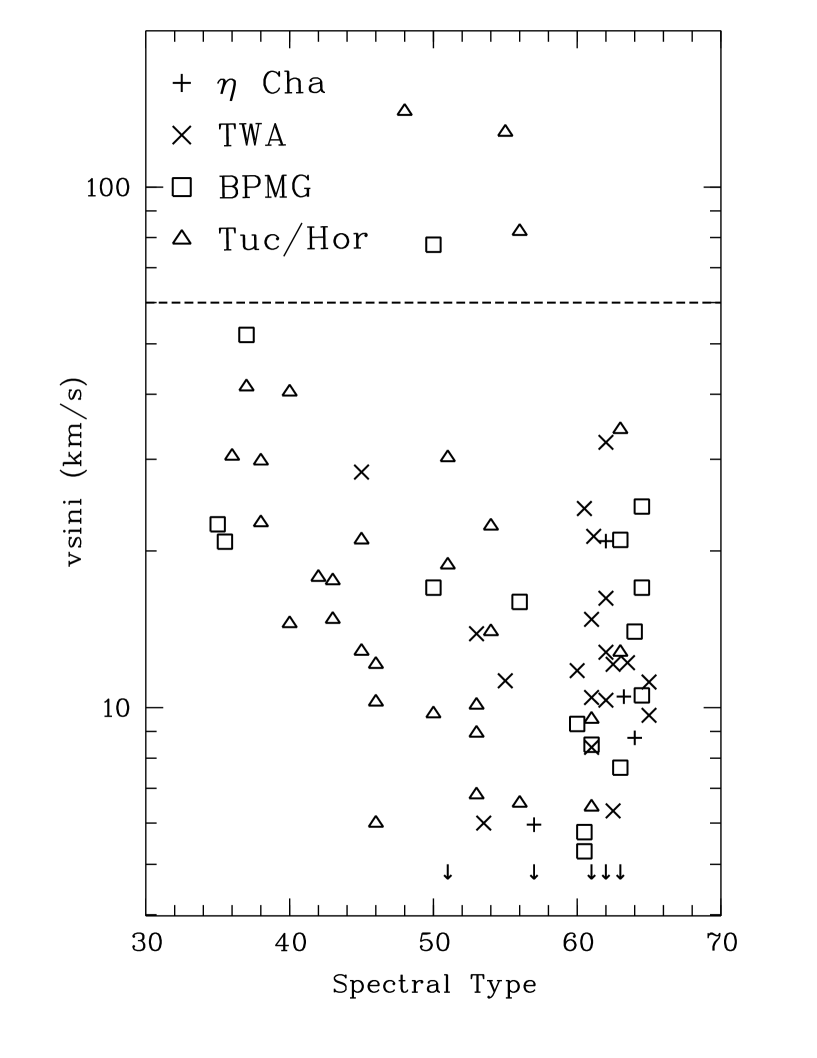
The H feature is used routinely as an indicator of chromospheric activity, originating from photoionization and collisions in the hot chromosphere. A main tool to investigate the chromospheric activity is to plot H EW vs. effective temperature, in our case represented by the spectral type. This plot is shown in Fig. 3 for our young targets.
Two main features are obvious from this figure: a) There is apparently no difference in the distribution of datapoints for our four target regions, spanning an age range from 6 to 30 Myr. This is further strengthened by the fact the the distribution of EWs are statistically indistinguishable in the four regions. Thus, the activity levels in the four associations are faily similar, as far as we can tell with our data (see below), although their ages are somewhat different. b) H EWs are a strong function of spectral type. While mid F-type stars exhibit H absorption of Å, the feature switches to emission at K2–K4 spectral types. Around M0, corresponding to masses of 0.7–0.8 M⊙ (Baraffe et al., 1998), there is a clear ‘knee’ in the distribution; at the same time, the spread in EW increases, and the stars reach emission levels between 0 and Å at early/mid M spectral types.
The strong change of H EW with spectral type does not only reflect a change in chromospheric activity, as the EW is additionally affected by the drop in the continuum level with stellar luminosity and the photospheric absorption in H, which is about zero for M dwarfs and increases towards earlier spectral types. The combined effects of photospheric continuum drop and H absorption are estimated from the H EW for our standard stars, which we already used as rotational velocity templates and which are selected to be non-active (see Nidever et al., 2002). A linear fit to their EW as a function of spectral type is shown in Fig. 3 as a dotted line; the object-to-object scatter around this line is typically Å. We note that this dashed line is consistent with the EWs of non-active stars in the Hyades and in the field for late K and early M spectral types (Herbst & Miller, 1989; Reid et al., 1995), and with published EW for field F and G dwarfs (Peat, 1964; Strauss & Ducati, 1981). It is also in line with theoretical predictions for H EW without chromosphere from Cram & Mullan (1985). Thus, this line is an estimate for the pure photospheric contribution to the H EW.
As can be seen in the figure, the dotted line follows the lower envelope of the EW for our young target stars between F8 and M2. All EWs for spectral types earlier than G8 are in agreement with the dotted line and thus pure photospheric values; thus, these stars do not show measurable chromospheric activity. Starting at spectral type G8, the EWs measured for our targets show increasing excess with respect to the photospheric values, indicating a contribution from magnetic activity. As pointed out by Cram & Mullan (1979), the onset of chromospheric activity will first tend to deepen the absorption feature by as much as 0.5–1 Å in relatively cool and thin chromospheres, where line formation is dominated by photoionization and not by collisions. This effect is not seen in our data, no object shows significantly more absorption than the photospheric values. Thus, objects in transition between essentially non-active chromospheres to the collision-dominated regime are rare. The maximum level of magnetic activity and the fraction of active objects increases rapidly from early K to mid M spectral types.
These results can be compared to studies of older and younger objects in a similar spectral range. We use three criteria:
A) The spectral type (or color) at which H changes from absorption to emission. This value was introduced by Hawley et al. (1999) as an indicator of stellar age, as it is steadily shifting to later spectral types as the objects get older. In our sample, the transition is at spectral types K2–K4, but it is only accurately defined for objects in TH. As summarized in Fig. 5 of Hawley et al. (1999), the transition occurs at early M types in the Hyades (age 0.5–1 Gyr), at late K types in the Pleiades (age 125 Myr), and at mid K types in IC 2602/2391 (age 30–40 Myr). For objects in the 1–5 Myr age range (i.e. younger than our sample), the transition occurs at spectral types earlier than K0 (Dahm, 2005) – in fact, objects without H in emission are very rare at these ages (Poncet et al., 1998). Thus, the stars in TH fit nicely in the evolutionary sequence defined in the literature, indicating a steady decline of activity in the pre-main-sequence evolution. Using this criterion as an age indicator, we find that ages in the TH association are most likely between 10 and 40 Myr, confirming previous estimates by Torres et al. (2000) and Song et al. (2004).
B) The fraction of K and M type objects with H emission. In our sample, practically all K/M objects are above the photospheric values, indicating activity, which is also the case for (non-accreting) stars younger than 6 Myr. A close to 100% fraction of active stars is also seen in pre-main-sequence clusters like IC 2602/2391 with ages of 30–40 Myr (Stauffer et al., 1997b). In contrast, only a small fraction of active stars is seen in the Hyades at an age of 0.5–1 Gyr (%, Reid et al., 1995) and in the old field population (%, Herbst & Miller, 1989). Criterion B thus confirms the drop in activity for objects older 30 Myr, but some of this effect might be due to the selection bias in our sample towards highly active objects (see above).
C) The maximum level of activity in M type objects. M stars are the most active objects in our sample with EW ranging from zero to 11–12 Å. To avoid being biased too much by a few extremely active objects, we do not take into account the most active 10% of the objects and thus obtain Å in our sample. We note that this value is mostly determined by objects in the three younger regions. For comparison, the same procedure gives Å for objects younger than 6 Myr (e.g. Dahm, 2005), Å in the Pleiades, and Å in the Hyades (Terndrup et al., 2000). Again this criterion confirms a decline of activity, which is particularly significant between 30 and 100 Myr.
From all three tests, a clear evolutionary sequence is apparent. Our targets are significantly more active than objects in the Pleiades, Hyades, and older samples. Thus, there is a clear decline of chromospheric activity from 30 Myr to 100 Myr and beyond. This decline leads to a reduction of the activity level in all spectral types, which includes the complete disappearance of measurable chromospheric emission at earlier spectral types. As the objects age from 30 Myr to 1 Gyr, the spectral range of non-active objects extends to later spectral types. Eventually, among evolved main-sequence stars only a fraction of M-type objects can maintain chromospheric activity. The best interpretation of this behavior is a mass dependence in the lifetime of active chromospheres: According to the numbers given above, the timescale on which the chromosphere provides significant H emission are Myr for F and G stars, 10–100 Myr for K stars, and Myr for M stars. A similar decline of activity can probably also be seen in the flare frequencies (see §4.2)
Maybe the best approach to explain this result is based on the different internal structure of the stars in our sample: While the F and G stars already have substantial radiative cores, most M stars are still fully convective. It is conceivable that once a rotationally driven dynamo is able to operate at the transition between convective and radiative zone, angular momentum loss through stellar winds quickly shuts down the magnetic activity. Thus, the connection between dynamo activity and rotation could potentially be the origin of the quick disappearance of the activity for early-type objects. An alternative explanation for the decline of chromospheric activity on the pre-main-sequence might be that the change in the interior structure alters the properties of the magnetic surface field. This in turn might lead to a change in the dominating mechanism responsible for the heating of the chromosphere, which will then affect the H emission.
As already mentioned above, we do not see significant differences between the four associations covered with our sample. However, the spectral type coverage in the four regions is different, and thus it is not possible to carry out a more rigorous comparison of the four regions using the three criteria defined above. In TH, for example, the number of M-type objects is very low, hampering a reliable assessment of the fraction of active objects and their maximum activity level. On the other hand, the younger groups Cha, TWA, and BPMG lack objects to spectral types between G5 and K5, compromising an analysis for the onset of activity in those regions. Thus, from our data alone we cannot definitely rule out activity evolution between 6 and 30 Myr. When comparing our data with younger objects, however, we see evidence for activity evolution on this timescale, in the sense that the transition to emission occurs at somewhat earlier spectral types in T Tauri stars. Taken together, the analysis in this section indicates that chromospheric activity steadily declines as the stars evolve from the T Tauri phase to the main sequence.
4.2 Variable chromospheric activity
Since we have more than one epoch for most of our targets, we are able to probe variability in the H emission. Because both photospheric H absorption and bolometric luminosity are not expected to change significantly (i.e. more than a few percent) for these objects, variability in H EW basically traces changes in the level of chromospheric emission. For a few objects in the youngest regions, weak levels of episodic accretion cannot be excluded and might contribute somewhat to the variability (see Jayawardhana et al., 2006).
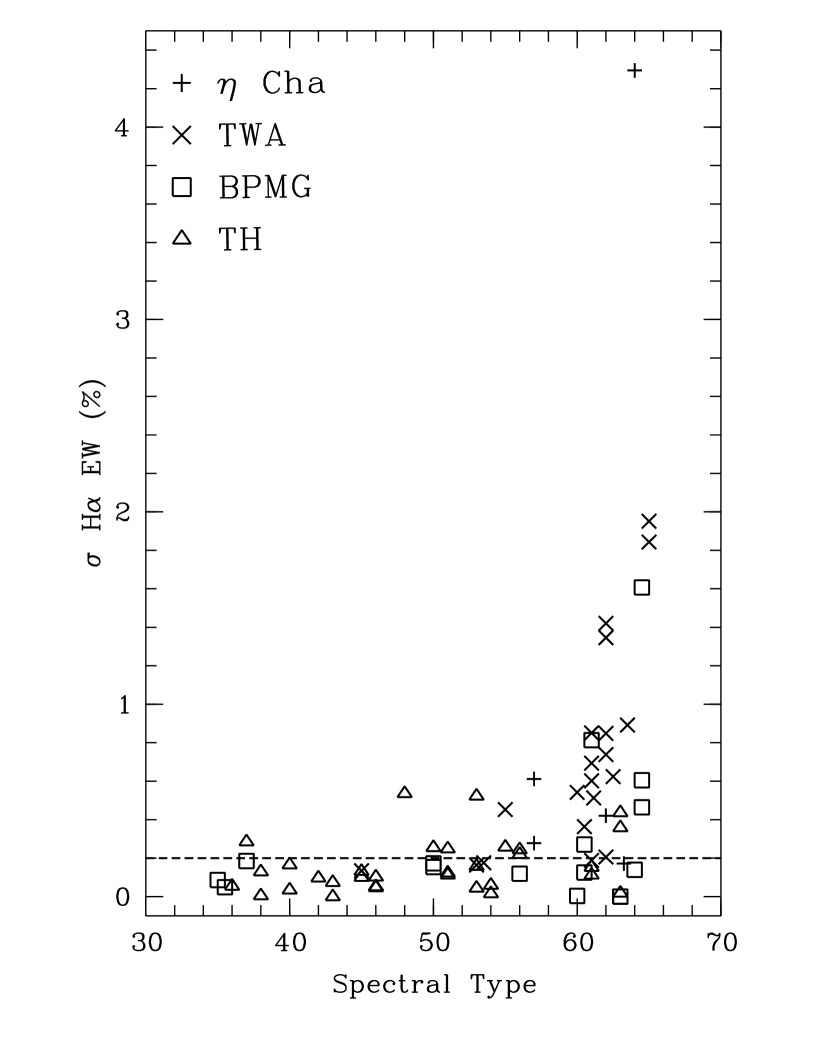
The primary estimate of variability is the standard deviations in our EW time series. In Fig. 4 (left panel) we plot the absolute values of H EW vs. spectral type. The dashed line marks the measurement uncertainty. As can be seen from this plot, many objects with late spectral types show significantly higher H variations than expected from the formal error, indicating variability in activity. Interestingly, the onset of measurable variability occurs at early K spectral types, where H changes from absorption to emission. This confirms that the variations can indeed be attributed to chromospheric activity – stars without measurable activity and thus only photospheric H do not show variability. The plot shows no significant difference between the four groups, indicating that the level of variability does not strongly change between 6 and 30 Myr.
H emission originates from active regions in the chromosphere, which are typically not uniformly distributed. Thus, one main cause of the H variations is rotational modulation. Additionally, the light curves can be affected by flare activity and overall changes in the activity level, e.g. due to an activity cycle. Our time sampling makes it difficult to distinguish between these three scenarios. In most cases, we have only one spectrum per night per target; the longest time baseline is eight months. Rotational changes occur on timescales of the rotation periods, which are typically a few days for our targets. These changes are periodic, but with our sparse sampling we are not able to recover the periods. General activity level changes are a long-term phenomenon, and thus might introduce a gradual trend in our time series. Isolated flare events would be detectable, but only if they are clearly stronger than all other sources of variability. If several flares are present in our time series, it would again be difficult to identify the source of variability.
We checked all H EW time series for signs of isolated flare events. Since the typical flare length in the optical wavelength range is at most a few hours, a flare would appear as a single H measurement with significantly stronger emission than all other datapoints in this particular time series. As a clear flare event, we accept a positive 3 outlier in the time series. It turns out that none of our objects exhibits such an event, although about 10 of them show 2 outliers (for example, the active stars TWA 10 and AU Mic in BPMG). Thus, strong, isolated flares are rare in our sample. As already mentioned, flares last typically 1–2 h in the optical (Guenther & Ball, 1999). Given our conservative detection limit, however, we would detect them only in the first 10–20 min, when their effect is most pronounced. In total, we have about 400 spectra, which thus cover about 100 h. Therefore, the flare frequency derived from our spectra is . Assuming a flare duration of h, this corresponds to a flare rate of %.
There are few reliable statistical constraints on (average) flare frequencies in the optical. Guenther & Ball (1999) derive rates of chromospheric flares for non-accreting T Tauri stars (ages Myr) and ZAMS stars (ages Myr) based on multi-epoch multi-object spectroscopy, applying a similar criterion as we have used, but for H instead of H. They find flare frequencies of 0.06 for T Tauri and 0.006 for ZAMS stars, concluding that the average flare frequency drops by a factor of ten as the stars evolve from 2 to 50 Myr. Our result of is clearly lower than the value derived for T Tauri stars, which might indicate that our targets are in an intermediate evolutionary stage between T Tauri phase and ZAMS in terms of their flare activity.
5 Stellar rotation
Stellar rotation is known to be a function of mass, age, and magnetic activity. These dependences will be discussed separately in the following subsections, with the goal of disentangling the involved processes.
5.1 Rotation vs. spectral type
Rotation is known to change as a function of stellar mass, mainly because the efficiency of angular momentum removal depends on magnetic activity, which in turn depends, as discussed in §4.1, on stellar mass. In Fig. 5 we plot versus spectral type, which we use as an indicator of stellar mass. Early K spectral type roughly corresponds to 1 M⊙, early M to 0.5 M⊙ (Baraffe et al., 1998). The majority of the objects have rotational velocities below 60 km s-1, the four exceptions, % of our total sample, are PZ Tel and in BPMG and HIP 108422, HIP 2729, and CD-53544 in TH. Objects with km s-1 are called ultrafast rotators in the following.
The overall appearance of this plot is comparable to distributions in young clusters. In the ONC, for example, typical values for for G–M spectral types are in the range of 12–30 km s-1, while higher mass stars tend to rotate somewhat faster (Rebull et al., 2002). For F–M spectral types, velocities 60 km s-1 are in general rare (5–10%, Sicilia-Aguilar et al., 2005), consistent with our dataset. The distributions in ZAMS clusters like the Pleiades (Terndrup et al., 2000) or IC 2391/2602 shows the same phenomenological appearance. In these clusters, the number of ultrafast rotators might be somewhat higher (%), as expected as a consequence of pre-main-sequence contraction and thus rotational acceleration (see §5.2).
For the early-type stars in our sample both the upper and the lower limit of the distribution decline steadily with spectral type. Excluding the ultrafast rotators, the upper limit decreases from km s-1 at F5 to km s-1 at K5, while the lower limit drops from 25 km s-1 to the detection limit of 5 km s-1 in the same spectral range. A similar trend is seen in the Pleiades (Queloz et al., 1998; Terndrup et al., 2000). There are at least two possible explanations:
a) The timescale on which the rotation of the stars is braked as a consequence of star-disk interaction (see §5.2), depends on spectral type, in the sense that early type objects loose their disks faster than later types. Evidence for mass-dependent disk lifetimes has been found recently (Carpenter, et. al., 2006; Scholz et al., 2007), but further tests are needed to clarify the impact on rotational evolution.
b) The effect can also be understood as a consequence of a change in the stellar interior structure: As already discussed in §2 and §4.1, all objects earlier than M0 in our sample do have a radiative core and thus are able to operate a solar-type dynamo. For these objects, a deep convection zone enables efficient angular momentum removal due to stellar winds and/or disk-locking (Schrijver & Zwaan, 2000). At any given age Myr, stars with spectral types K have deeper convection zones than F–G stars (D’Antona & Mazzitelli, 1994). Thus, as we approach later spectral types and the convection zones in the stars become progressively deeper, the rotational braking becomes more effective, resulting in reduced rotational velocities, as seen in Fig. 5.
5.2 Rotational evolution in the pre-main-sequence phase
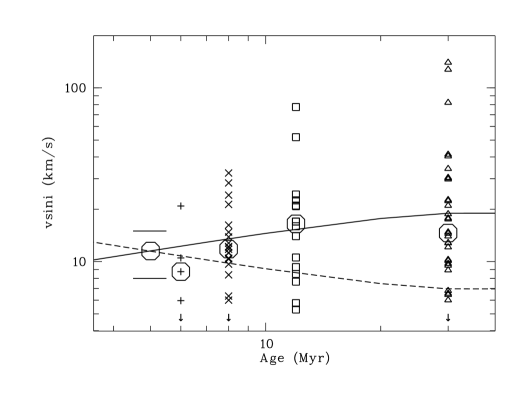
To examine the evolutionary effects more in detail, we plot vs. age in Fig. 6. In the upper panel, we show only the four associations. As can be seen in the plot, the upper limit in increases with age; the ultrafast rotators are only seen in older associations. This trend, however, might be a result of small number statistics. We compared the distributions of using a double-sided Kolmogoroff-Smirnoff test. Specifically, we tested the null hypothesis ‘the distribution in two associations is the same’. It was found that with two exceptions all possible combinations of Cha, TWA, BPMG, and TH give likelihoods for the validity of the null hypothesis larger than 25%. When comparing TWA with older associations there is some marginal evidence for statistical differences, with false alarm probabilities of 6.2% (BPMG) and 6.3% (TH). In general, however, the four datasets are fairly similar. This is consistent with the results of Stassun et al. (1999), who find similar distributions for the ONC (1 Myr) and the Pleiades (125 Myr). Thus, the overall distribution of rotational velocities does not appear to change significantly in the pre-main-sequence phase. Please note that this does not necessarily imply consistency with conservation of angular momentum throughout the pre-main-sequence phase, as the objects undergo a strong contraction (see below for a more detailed assessment).
A large scatter of rotation rates is seen at all ages. While the projection factor , age spread, and uncertainties all contribute to the scatter, the major reason for the large spread of the distribution is probably the spread in the initial rotation periods. In clusters with ages of 1–2 Myr, the periods range from fractions of a day to d (Herbst et al., 2007), corresponding to rotational velocities ranging from km s-1 to km s-1. Moreover, the distribution (as well as the distribution of ) is highly asymmetric, hampering a rigorous statistical analysis. To mitigate this problem when investigating the rotational evolution we work in the following with typical (median) values for a given age, rather than with individual datapoints. Please note that by averaging over the rotational velocities in one particular group, we loose any information about the spectral type dependence of the rotation, which has been discussed in §5.1.
In Fig. 6, we overplot the median values for each association as large octagons. We will compare these median with simple models for the rotational evolution. As starting value for the models, we used the typical of 8–15 km s-1 (average 11.5 km s-1) at Myr given by Rebull et al. (2004). To take into account the pre-main-sequence contraction, we use radii from Chabrier & Baraffe (1997) for a stellar mass of 0.8 M⊙, which is typical for our sample.
In the upper panel of Fig. 6, we plot the expected rotational evolution for two extreme cases, constant angular momentum with a solid line (model A) and constant angular velocity with a dashed line (model B). In this approach, we follow Rebull et al. (2004) who have done a similar comparison for stars with ages from 1–10 Myr. In model B, the period is constant, as expected in a scenario with ideal ‘disk-locking’, and thus . Model A, on the other hand, shows purely the spin-up due to contraction and thus . While both models are in good agreement with observations until ages of Myr, only model A is clearly consistent with the median at 30 Myr. Model B, however, gives too low values for ages 10 Myr; it truncates the distribution at the 20% quartile in BPMG and at the 10% quartile in TH. Thus, from 10 to 30 Myr the objects show rotation rates rather consistent with conservation of angular momentum than with constant rotation period. Thus, the dominating effect for the rotational evolution in this time window is spin-up due to the pre-main-sequence contraction. This result is robust against uncertainties in the stellar radii, because only the ratio of radii is used in the calculation.
In strong contrast to our finding, for ages Myr the rotational evolution closely follows the track for constant angular velocity, as concluded by Rebull et al. (2004). There is growing evidence for a strong rotational braking in the first few Myr, most likely produced by interaction with accretion disks (e.g. Herbst et al., 2002; Rebull et al., 2006) and preventing the stars from spinning up by essentially locking the rotation period (e.g. Rebull et al., 2002; Tinker et al., 2002; Herbst & Mundt, 2005). Our results now demonstrate that while the period may be locked until ages of Myr, in the following Myr the stars spin up without clear evidence for rotational braking. Thus, rotational acceleration (measured in period) becomes significant at ages of 5–10 Myr – which is consistent with the typical lifetime of circumstellar disks (Haisch et al., 2001). Specifically, it has been shown that many of the youngest stars in our sample (in Cha and TWA) are affected by inner disk clearing measured from mid-infrared excess (Haisch et al., 2005; Jayawardhana et al., 1999), while the oldest objects (in TH) do not show any evidence for disks at mid-infrared wavelengths (Mamajek et al., 2004). Thus, the change of the rotational regulation at 5–10 Myr coincides with the disappearance of the inner disks. It has to be emphasized, however, that all these considerations only apply to the typical evolution. For individual objects, the period-locking timescale can vary by a lot – possibly due to different disk lifetimes.
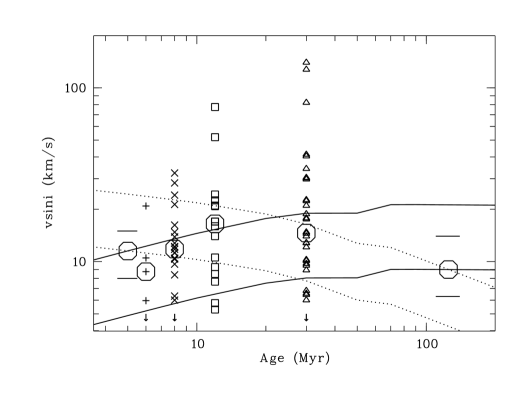
To follow the evolution to the main sequence, we compared our dataset with the rotational velocity data in the Pleiades. In the lower panel of Fig. 6, we plot the median for F to M stars (large octagon) together with the quartile values (horizontal bars). These numbers have been taken from Queloz et al. (1998) (their Fig. 6, averaged over all masses). In this plot we show for each model two evolutionary tracks, the first starts at 6 Myr and calculates forward in time (as in the upper panel), the second starts at 125 Myr and calculates backwards. Solid lines show again model A, i.e. conservation of angular momentum without any rotational braking. The tracks from model A are barely consistent with the observational data. When started at 5 Myr, the predicted median in the Pleiades is 21 km s-1 and thus too high; when started at 125 Myr, they give a median of 5 km s-1 at 5 Myr, which is clearly too low. Thus, rotational braking is likely involved in the evolution to the ZAMS.
On the main-sequence, rotation is mainly braked by angular momentum losses due to stellar winds, where the standard rotational braking law has been found to be (Skumanich, 1972; Barnes, 2001). Model C, shown in dotted lines, assumes angular momentum losses according to the Skumanich law, again calculated in both directions. The tracks from model C, however, are clearly not in agreement with the observations. When calculated forward, the predicted median for the Pleiades is well below the detection limit. Conversely, for 5 Myr the model gives an unrealistically high median. Thus, Skumanich braking appears to be too strong. We can reproduce the evolution either by using an exponent of to instead of in the braking law, by using an exponential braking law with or by switching on the braking at about half way through the pre-main-sequence evolution. The latter scenario is not implausible, as most objects in the considered mass range develop a radiative core and thus the pre-requisite to operate a solar-type dynamo after about 30 Myr, see §1.
Thus, our comparison with models gives the following results: a) On timescales of Myr, weak rotational braking, possibly due to a Skumanich-type activity-rotation connection, is required to find a good match to the observations. b) From 5–30 Myr the rotational evolution is fully consistent with angular momentum conservation; effects of possible rotational braking are too weak to affect the distribution significantly. Again it should be emphasised that these results do only apply to the total sample. In §5.1 we do find that rotational velocities depend on spectral type for objects earlier than M2. Thus, for objects with ages between 5 and 30 Myr, stellar mass is the major factor which determines the rotation, rather than age.
In the previous sections we have already made connections between rotation and activity, to explain the evolution and mass-dependence of H emission and rotational velocities. The obvious next step is to investigate directly possible correlations between rotation and activity, which is the focus of the next subsection.
5.3 The rotation-activity connection
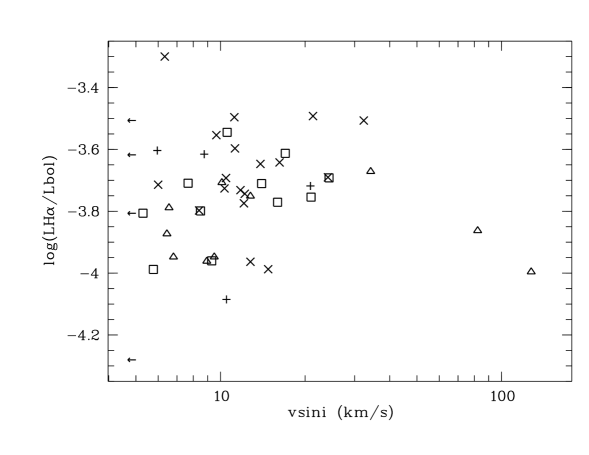
In order to obtain a physically meaningful picture of a possible connection between rotation and activity, we derived relative H luminosities (i.e. ) from the measured H EW. We focused on the objects with clear chromospheric H emission, and therefore excluded stars with spectral type earlier than K2 (see §4.1). In a first step, we corrected the EW for photospheric absorption, using the correlation between photospheric H absorption and spectral types derived in §4.1 from non-active reference stars (see dotted line in Fig. 3). Objects with corrected EW Å and thus insignificant chromospheric emission were excluded. The continuum at the wavelength of H was estimated using the STARdusty1999 model spectra, which are based on the NextGen models refreshed with new water and TiO opacities (Allard et al., 2000). We measured the continuum flux at 6562 Å for effective temperatures ranging from 3 000 to 5 000 K and by approximating the spectrum around H with a linear fit. This value was divided by the bolometric luminosity for the respective effective temperature. As a result, we obtain scaling factors as a function of effective temperature to convert the H EW to . Please note that this conversion depends neither on the radii of the objects nor on the distances, which are poorly constrained for many of our targets. The effective temperatures for our targets will be published in a forthcoming paper, see §2.
Fig. 7 shows the relative H luminosities as a function of . Please note that by excluding non-active (earlier type) objects, the clear majority of the objects in the plot is fully convective. While the lower activity limit in this plot is a detection limit, the upper limit is reliably determined and can be compared with published samples. In our sample, we obtain , excluding the datapoint for TWA 10, which possibly is affected by a flare event (see §4.2). For the mass range of our sample, this value is roughly comparable with the upper limit in the Pleiades (Hodgkin et al., 1995), but clearly higher than in the Hyades (, Stauffer et al., 1997a), again indicating a decline of the general activity with age, as already discussed in §4.1.
As can be seen in Fig. 7, the upper limit of the range in activities is mostly flat. Thus, activity is not strongly correlated with mass for 5 km s. This holds even when we only consider objects with radiative core and thus the potential to operate a solar-type, rotationally driven dynamo. It is also important to note that the distribution of rotational velocities for the non-active stars (not contained in Fig. 7) is indistinguishable from the active stars; they cover the full range from to 100 km s-1, with a accumulation between 10 and 20 km s-1. Moreover, among the four slowest rotators in our sample with km s-1 (shown as upper limits in Fig. 7), there is only one object with an activity level significantly below the range of datapoints for the faster rotators. Thus, by and large the rotation-activity correlation derived from H emission is flat in our sample.
These results can be compared phenomenologically with rotation-activity studies based on X-ray data. de la Reza & Pinzón (2004) find that stars in TWA, BPMG, and TH are roughly comparable to T Tauri stars in the ONC in terms of their X-ray properties. The activity in the ONC has been studied in detail in the COUP project (e.g. Flaccomio et al., 2003; Stassun et al., 2004). Both in the COUP data and in the sample of de la Reza & Pinzón (2004), there is no strong correlation between and rotation period. The rotation/activity relationship appears to be flat over a wide range of periods, interpreted as saturation with some indication for supersaturation, i.e.a decline of activity for the fastest rotators. This is very similar to what we observe in H. The two ultrafast rotators in Fig. 7 appear to have below average activity levels, which might be interpreted as supersaturation. The two additional ultrafast rotators not plotted in Fig. 7 have no measurable activity level, thus confirming this trend. However, since we have only very few datapoints at high rotational velocities, this should be treated with caution. Still, it is interesting to note that the four ultrafast rotators are objects with radiative core, maybe implying that supersaturation might be associated to the presence of a solar-type dynamo.
It is well established that field stars show a mostly linear relationship between rotation and relative X-ray luminosity (Randich, 2000). In young open clusters like IC 2391, IC 2602, and the Pleiades with ages ranging from 30 to 150 Myr, an intermediate situation is seen, with many objects in the saturated regime and an additional linear part (e.g. Patten & Simon, 1996). A hint of a linear relation might also be seen in the sample of post T Tauri Lindroos stars with ages between 10 and 100 Myr analyzed by Huélamo et al. (2004). Linear correlations between X-ray flux and rotation rate have additionally been found for young stars in Taurus (Stelzer & Neuhäuser, 2001). Stassun et al. (2004) argued that the linear part of the rotation/activity correlation in the ONC may be hidden in the objects for which no periods have been measured. However, studies of magnetic activity at very young ages are problematic, because accretion additionally affects both X-ray and H luminosities, which in principle requires the strict separation of accretors from non-accretors. Our H luminosity vs. plot does not reveal a strong indication for a linear regime in the rotation/activity relationship. The linear part cannot be hidden at low and thus undetectable rotational velocities, as it has recently been found for field M stars (Reiners, 2007), because even the slowest rotators in our sample show the same range of activity levels (with one exception, see above). In summary, it is still not clear if the linear part of the rotation/activity correlation is already established at ages Myr.
In this context it is interesting to note that the rotation/activity relation of young stars is similar to very low mass (VLM) objects with masses 0.3 M⊙. It is known that the rotational velocity at which saturation is reached drops quickly with decreasing object mass (Pizzolato et al., 2003), with the result that most VLM objects appear in the saturated regime (Delfosse et al., 1998; Mohanty & Basri, 2003). As a consequence, the Skumanich type braking law breaks down (Sills et al., 2000), and a weak exponential braking law is expected with (Barnes, 2003b). Such weak rotational braking is indeed required to model the rotational evolution in the VLM regime on timescales of 100–1 000 Myr (Scholz & Eislöffel, 2004, 2005).
In the canonical picture of the rotation/activity connection, the solar-type dynamo strongly depends on rotation, causing a linear relationship at low and moderate activity levels. The saturation effect is usually interpreted as an activity level where the stellar surface is covered by magnetic flux tubes and no further enhancement of activity (and rotational braking) is possible – thus the term ‘saturation’. (It is unlikely that this corresponds to a surface completely covered with starspots, given the fact that many ‘saturated’ stars show strong photometric modulations due to rotation and thus have only a partially filled surface.) Both VLM objects and very young stars, however, are fully convective and thus cannot harbor a solar-type dynamo, which operates at the transition between convective and radiative zone (see §1). The kind of alternative dynamo that produces their magnetic activity, and how it depends on rotation, is still a matter of debate (see e.g. Durney et al., 1993; Chabrier & Küker, 2006; Donati et al., 2006). But it is at least questionable to assume that the picture of the rotation/activity connection used for evolved solar-type stars can simply be extended to young stars and very low mass objects. For these types of objects ‘saturation’ can have two meanings: a) They are saturated and do not follow the Skumanich law, because they rotate too fast to be in the linear regime, as it is assumed in the standard paradigm. b) Their ‘saturation’ is the consequence of a magnetic field generation fundamentally different from solar-type stars.
In the second case, ‘saturation’ is not merely the consequence of fast rotation, but a more fundamental sign of a change in the magnetic field generation (and thus the word ‘saturation’ might be misleading). This idea has been proposed as an interpretation of rotation and activity data for open cluster stars by Barnes (2003a, b). Basically, the Barnes scheme suggest that the rotation/activity properties can be understood only in terms of the magnetic field generation: Fully convective objects in the saturated or supersaturated regime (on the ‘C-sequence’ in the nomenclature of Barnes (2003a)) do not harbor a solar-type magnetic dynamo and thus do not follow the Skumanich type rotational braking law. As the stars evolve from the T Tauri phase to the ZAMS (and develop a radiative core), the fraction of objects on the C-sequence drops quickly and reaches values % at the age of the Hyades. While the quantitative predictions of the Barnes (2003a) scheme may not be convincing in all cases, the qualitative picture is consistent with the current rotation/activity data for the pre-main-sequence evolution.
Many of our target stars in Cha, TWA, BPMG, and TH are too old to be fully convective (see §2). Depending on their mass, they have developed radiative cores with substantial radii already. Thus, they present an interesting test case for magnetic field evolution. The fact that they show rotation/activity properties similar to younger stars (and to fully convective VLM objects) might indicate that it takes at least 30 Myr until the solar-type dynamo dominates the magnetic activity and rotational braking. This is supported by the weak rotational braking on the pre-main sequence found in §5.2. Future investigations of the magnetic field properties of pre-main-sequence stars as a function of age hold great potential to clarify these issues.
6 Constraints on ages and radii: Rotation periods vs.
By combining our measured with previously published rotational periods, we can derive stellar radii (times the unknown projection factor ) as , and compare these to evolutionary models, to constrain the age. This gives an age estimate independent of other indicators such as the lithium abundance and color-magnitude diagram constraints, although all these estimates are dependent on the particular evolutionary model used. The estimated thus test the self-consistency of the models.
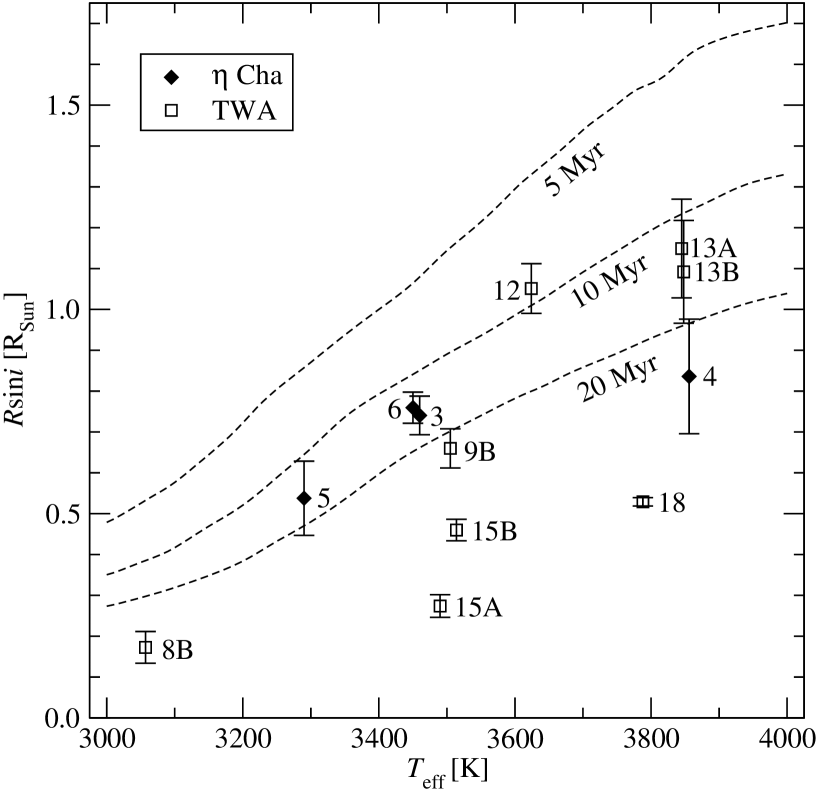
Because of the unknown projection factor , a statistical sample is needed to derive the true . Unfortunately, since our targets are widely distributed in the sky, monitoring campaigns to find photometric periods are time consuming, and only a small subset of our sample has photometric periods measured. In total, 16 periods have been measured in Cha (Lawson et al., 2001) and TWA (Lawson & Crause, 2005). Of those, 13 are M dwarfs, out of which 12 have above our detection threshold. In Fig. 8 we plot against effective temperature for those 12 targets, together with radius isochrones from models by Baraffe et al. (1998). The errors in the are entirely dominated by errors in .
Although the statistical sample (12) may seem small, we are helped by the fact that the probability density distribution for the projection factor of a random orientation favors close to edge-on geometries (see, e.g., Appendix A in Brandeker et al. (2006)):
| (1) |
Assuming a single age and the evolutionary models by Baraffe et al. (1998), equation (1) can be used to find a maximum-likelihood estimate for the age. To take into account the estimated measurement error , and to mitigate the singularity at , we assume the measured to be an outcome of a stochastic variable , where is the projection factor distributed according to equation (1), is normally distributed with zero mean and variance , and is the model radius for a star of age and effective temperature . The probability distribution of is obtained by numerical integration,
| (2) | |||||
and the maximum likelihood by finding the maximum of the likelihood function
| (3) |
To estimate conservative confidence intervals for this estimate, we integrate the probability density function to get the cumulative probability function . We then find the age limits and such that the probabilities
| (4) | |||||
| (5) |
where is the significance and the probability function is
| (6) |
Using the above relations we find the implied ages of Cha and TWA to be Myr and Myr, respectively, where the quoted confidence interval is of 95% significance. These ages are slightly higher than, but consistent with, estimates from literature (6 Myr for Cha and 8 Myr for TWA), indicating that the model radii with 95% confidence are good to within 15%.
7 Summary
Rotation and activity are important parameters in the stellar pre-main-sequence evolution, because they trace changes of interior structure and magnetic fields as well as the dissipation of circumstellar disks. We present a spectroscopic study of rotation (measured as ) and chromospheric activity (measured as H EW) for a sample of 74 young stars with spectral types F5–M5 in stellar associations with ages from 6 to 30 Myr. More than half of the objects are still fully convective, while the remaining fraction has already developed a radiative core. The analysis is based on an extensive set of multi-epoch high-resolution spectra obtained with the 6.5 m Clay Magellan telescope. We achieve a rotational velocity accuracy of km s-1. In the following, we summarize our results:
-
1.
The range and distribution of H EWs do not depend significantly on age in the considered age range; instead they are a strong function of spectral type (and thus stellar mass). Mid F to early K type stars have H in absorption, while most later type objects show emission. Until early K types, the H EW are mostly consistent with pure photospheric absorption, while for later spectral types chromospheric emission dominates.
-
2.
The spectral type at which H goes into emission in our sample is clearly earlier than in older clusters Pleiades and Hyades, but later than in very young T Tauri stars. This indicates a mass dependence in the lifetime of active chromospheres. Using this as an age criterion, as suggested by Hawley et al. (1999), we find that the plausible age of TH is in the range between 10 and 40 Myr.
-
3.
The chromospheric activity measured in H clearly declines as a function of age from T Tauri stars (1–5 Myr) to post T Tauri stars in our sample (6–30 Myr) to ZAMS objects (50–100 Myr).
-
4.
Many objects with spectral types later than early K show measurable variability in H EW on timescales of weeks and months, which can be attributed to chromospheric processes.
-
5.
Most objects in our sample have projected rotational velocities between 5 and 60 km s-1. Additionally, four ultrafast rotators with between 70 and 130 km s-1 are seen, all in BPMG and TH. The maximum and minimum of the range decreases between spectral types mid F to early K, indicating a dependence of rotation braking on the depth of the convection zone.
-
6.
The average rotational evolution between 5 and 30 Myr is consistent with angular momentum conservation. It does not agree well with constant angular velocity i.e. ‘period-locking’. This is the opposite of what has been observed for ages 1–5 Myr (Rebull et al., 2004) and indicates a change in the rotational regulation at ages of 5–10 Myr, coinciding with the average lifetime of (inner) disks. This may be interpreted with a scenario where the rotation is regulated by disk interaction at early ages, while they are free to spin up after the disks have disappeared.
-
7.
By comparing our data with rotational velocities in the Pleiades, we see some evidence for weak rotational braking on timescales of Myr. This might be an exponential or a Skumanich type rotational braking due to stellar winds (), which is switched on after the objects have developed radiative cores, i.e. after Myr.
-
8.
The rotation-activity relation, using , appears flat and thus ‘saturated’ in our sample. The maximum level of is , more or less independent of rotational velocity. There is no clear sign of a linear rotation/activity correlation at low .
-
9.
The rotation-activity relation of stars with ages Myr is similar to fully-convective very low mass objects. The flat rotation/activity relation and the weak wind braking seen in these two object classes may not be due to ‘saturation’ of a solar-type rotationally driven dynamo, as suggested in the standard picture. Instead, the magnetic fields in these young objects are probably generated in a fundamentally different way from those in main-sequence stars.
-
10.
By comparing our rotational velocities with rotation periods from the literature, we find ages of Myr and Myr for Cha and TWA, respectively, consistent with previous estimates from other methods. This agreement indicates that the stellar radii for M dwarfs from models by Baraffe et al. (1998) are good within 15%.
References
- Allard et al. (2000) Allard, F., Hauschildt, P. H., & Schwenke, D. 2000, ApJ, 540, 1005
- Baraffe et al. (1998) Baraffe, I., Chabrier, G., Allard, F., & Hauschildt, P. H. 1998, A&A, 337, 403
- Barnes (2001) Barnes, S. A. 2001, ApJ, 561, 1095
- Barnes (2003a) —. 2003a, ApJ, 586, L145
- Barnes (2003b) —. 2003b, ApJ, 586, 464
- Barrado y Navascués et al. (1999) Barrado y Navascués, D., Stauffer, J. R., Song, I., & Caillault, J.-P. 1999, ApJ, 520, L123
- Brandeker et al. (2006) Brandeker, A., Jayawardhana, R., & Najita, J. 2003, AJ, 126, 2009
- Brandeker et al. (2006) Brandeker, A., Jayawardhana, R., Khavari, P., Haisch, Jr, K. E., & Mardones, D. 2006, ApJ, 652, 1572
- Carpenter, et. al. (2006) Carpenter, J. M., Mamajek, E. E., Hillenbrand, L. A., Meyer, M. R. 2006, ApJ, 651, 49
- Chabrier & Baraffe (1997) Chabrier, G., & Baraffe, I. 1997, A&A, 327, 1039
- Chabrier & Küker (2006) Chabrier, G., & Küker, M. 2006, A&A, 446, 1027
- Cram & Mullan (1985) Cram, L. E., & Mullan, D. J. 1985, ApJ, 294, 626
- Cram & Mullan (1979) Cram, L. E., & Mullan, D. J. 1979, ApJ, 234, 579
- Dahm (2005) Dahm, S. E. 2005, AJ, 130, 1805
- D’Antona & Mazzitelli (1994) D’Antona, F., & Mazzitelli, I. 1994, ApJS, 90, 467
- de la Reza & Pinzón (2004) de la Reza, R., & Pinzón, G. 2004, AJ, 128, 1812
- Delfosse et al. (1998) Delfosse, X., Forveille, T., Perrier, C., & Mayor, M. 1998, A&A, 331, 581
- Donati et al. (2006) Donati, J.-F., Forveille, T., Cameron, A. C., Barnes, J. R., Delfosse, X., Jardine, M. M., & Valenti, J. A. 2006, Science, 311, 633
- Durney et al. (1993) Durney, B. R., De Young, D. S., & Roxburgh, I. W. 1993, Sol. Phys., 145, 207
- Edwards et al. (1993) Edwards, S., Strom, S. E., Hartigan, P., Strom, K. M., Hillenbrand, L. A., Herbst, W., Attridge, J., Merrill, K. M., Probst, R., & Gatley, I. 1993, AJ, 106, 372
- Flaccomio et al. (2003) Flaccomio, E., Damiani, F., Micela, G., Sciortino, S., Harnden, Jr., F. R., Murray, S. S., & Wolk, S. J. 2003, ApJ, 582, 398
- Guenther & Ball (1999) Guenther, E. W., & Ball, M. 1999, A&A, 347, 508
- Haisch et al. (2001) Haisch, K. E., Lada, E. A., & Lada, C. J. 2001, ApJ, 553, L153
- Haisch et al. (2005) Haisch, Jr., K. E., Jayawardhana, R., & Alves, J. 2005, ApJ, 627, L57
- Hawley et al. (1999) Hawley, S. L., Reid, I. N., Gizis, J. E., & Byrne, P. B. 1999, in ASP Conf. Ser. 158: Solar and Stellar Activity: Similarities and Differences, ed. C. J. Butler & J. G. Doyle, 63–+
- Herbst et al. (2002) Herbst, W., Bailer-Jones, C. A. L., Mundt, R., Meisenheimer, K., & Wackermann, R. 2002, A&A, 396, 513
- Herbst et al. (2007) Herbst, W., Eislöffel, J., Mundt, R., & Scholz, A. 2007, in: Protostars and Planets V, B. Reipurth, D. Jewitt, and K. Keil (eds.), University of Arizona Press, Tucson, 297
- Herbst & Miller (1989) Herbst, W., & Miller, J. R. 1989, AJ, 97, 891
- Herbst & Mundt (2005) Herbst, W., & Mundt, R. 2005, ApJ, 633, 967
- Hodgkin et al. (1995) Hodgkin, S. T., Jameson, R. F., & Steele, I. A. 1995, MNRAS, 274, 869
- Huélamo et al. (2004) Huélamo, N., Fernández, M., Neuhäuser, R., & Wolk, S. J. 2004, A&A, 428, 953
- Jayawardhana et al. (2006) Jayawardhana, R., Coffey, J., Scholz, A., Brandeker, A., & van Kerkwijk, M. H. 2006, ApJ, 648, 1206
- Jayawardhana et al. (1999) Jayawardhana, R., Hartmann, L., Fazio, G., Fisher, R. S., Telesco, C. M., & Piña, R. K. 1999, ApJ, 521, L129
- Kastner et al. (1997) Kastner, J. H., Zuckerman, B., Weintraub, D. A., & Forveille, T. 1997, Science, 277, 67
- Koenigl (1991) Koenigl, A. 1991, ApJ, 370, L39
- Lawson & Crause (2005) Lawson, W. A., & Crause, L. A. 2005, MNRAS, 357, 1399
- Lawson et al. (2001) Lawson, W. A., Crause, L. A., Mamajek, E. E., & Feigelson, E. D. 2001, MNRAS, 321, 57
- Luhman & Steeghs (2004) Luhman, K. L., & Steeghs, D. 2004, ApJ, 609, 917
- Mamajek et al. (1999) Mamajek, E. E., Lawson, W. A., & Feigelson, E. D. 1999, ApJ, 516, L77
- Mamajek et al. (2004) Mamajek, E. E., Meyer, M. R., Hinz, P. M., Hoffmann, W. F., Cohen, M., & Hora, J. L. 2004, ApJ, 612, 496
- Matt & Pudritz (2005) Matt, S., & Pudritz, R. E. 2005, ApJ, 632, 135
- Mohanty & Basri (2003) Mohanty, S., & Basri, G. 2003, ApJ, 583, 451
- Nidever et al. (2002) Nidever, D. L., Marcy, G. W., Butler, R. P., Fischer, D. A., & Vogt, S. S. 2002, ApJS, 141, 503
- Patten & Simon (1996) Patten, B. M., & Simon, T. 1996, ApJS, 106, 489
- Peat (1964) Peat, D. W. 1964, MNRAS, 128, 435
- Pizzolato et al. (2003) Pizzolato, N., Maggio, A., Micela, G., Sciortino, S., & Ventura, P. 2003, A&A, 397, 147
- Poncet et al. (1998) Poncet, A., Montes, D., Fernandez-Figueroa, M. J., & Miranda, L. F. 1998, in ASP Conf. Ser. 154: Cool Stars, Stellar Systems, and the Sun, ed. R. A. Donahue & J. A. Bookbinder, 1772–+
- Queloz et al. (1998) Queloz, D., Allain, S., Mermilliod, J.-C., Bouvier, J., & Mayor, M. 1998, A&A, 335, 183
- Randich (2000) Randich, S. 2000, in ASP Conf. Ser. 198: Stellar Clusters and Associations: Convection, Rotation, and Dynamos, ed. R. Pallavicini, G. Micela, & S. Sciortino, 401–+
- Rebull et al. (2006) Rebull, L. M., Stauffer, J. R., Megeath, S. T., Hora, J. L., & Hartmann, L. 2006, ApJ, 646, 297
- Rebull et al. (2004) Rebull, L. M., Wolff, S. C., & Strom, S. E. 2004, AJ, 127, 1029
- Rebull et al. (2002) Rebull, L. M., Wolff, S. C., Strom, S. E., & Makidon, R. B. 2002, AJ, 124, 546
- Reid (2003) Reid, N. 2003, MNRAS, 342, 837
- Reid et al. (1995) Reid, N., Hawley, S. L., & Mateo, M. 1995, MNRAS, 272, 828
- Reiners (2007) Reiners, A., 2007, A&A, accepted, astro-ph/0702634
- Scholz & Eislöffel (2004) Scholz, A., & Eislöffel, J. 2004, A&A, 421, 259
- Scholz & Eislöffel (2005) —. 2005, A&A, 429, 1007
- Scholz et al. (2007) Scholz, A., Jayawardhana, R., Wood, K., Meeus, G., Stelzer, B., Walker, Ch., O’Sullivan, M., 2007 ApJ, in press, astro-ph/0701703
- Schrijver & Zwaan (2000) Schrijver, C. J., & Zwaan, C. 2000, Solar and Stellar Magnetic Activity (Solar and stellar magnetic activity / Carolus J. Schrijver, Cornelius Zwaan. New York : Cambridge University Press, 2000. (Cambridge astrophysics series ; 34))
- Sicilia-Aguilar et al. (2005) Sicilia-Aguilar, A., Hartmann, L. W., Szentgyorgyi, A. H., Fabricant, D. G., Fűrész, G., Roll, J., Conroy, M. A., Calvet, N., Tokarz, S., & Hernández, J. 2005, AJ, 129, 363
- Sills et al. (2000) Sills, A., Pinsonneault, M. H., & Terndrup, D. M. 2000, ApJ, 534, 335
- Skumanich (1972) Skumanich, A. 1972, ApJ, 171, 565
- Song et al. (2004) Song, I., Zuckerman, B., & Bessell, M. S. 2004, ApJ, 614, L125
- Stassun et al. (2004) Stassun, K. G., Ardila, D. R., Barsony, M., Basri, G., & Mathieu, R. D. 2004, AJ, 127, 3537
- Stassun et al. (1999) Stassun, K. G., Mathieu, R. D., Mazeh, T., & Vrba, F. J. 1999, AJ, 117, 2941
- Stauffer et al. (1997a) Stauffer, J. R., Balachandran, S. C., Krishnamurthi, A., Pinsonneault, M., Terndrup, D. M., & Stern, R. A. 1997a, ApJ, 475, 604
- Stauffer et al. (1997b) Stauffer, J. R., Hartmann, L. W., Prosser, C. F., Randich, S., Balachandran, S., Patten, B. M., Simon, T., & Giampapa, M. 1997b, ApJ, 479, 776
- Stelzer & Neuhäuser (2001) Stelzer, B., & Neuhäuser, R. 2001, A&A, 377, 538
- Stelzer et al. (2000) Stelzer, B., Neuhäuser, R., & Hambaryan, V. 2000, A&A, 356, 949
- Strauss & Ducati (1981) Strauss, F. M., & Ducati, J. R. 1981, A&AS, 44, 337
- Terndrup et al. (2000) Terndrup, D. M., Stauffer, J. R., Pinsonneault, M. H., Sills, A., Yuan, Y., Jones, B. F., Fischer, D., & Krishnamurthi, A. 2000, AJ, 119, 1303
- Tinker et al. (2002) Tinker, J., Pinsonneault, M., & Terndrup, D. 2002, ApJ, 564, 877
- Torres et al. (2000) Torres, C. A. O., da Silva, L., Quast, G. R., de la Reza, R., & Jilinski, E. 2000, AJ, 120, 1410
- Zuckerman & Song (2004) Zuckerman, B., & Song, I. 2004, ARA&A, 42, 685
- Zuckerman et al. (2001) Zuckerman, B., Song, I., Bessell, M. S., & Webb, R. A. 2001, ApJ, 562, L87
- Zuckerman & Webb (2000) Zuckerman, B., & Webb, R. A. 2000, ApJ, 535, 959
| Star | H EW | H EW | Spectral Type aaZuckerman & Song (2004) | ||
|---|---|---|---|---|---|
| Cha 3 | -1.99 | 0.17 | 10.50 | 0.67 | M3.25bbLuhman & Steeghs (2004) |
| Cha 4 | -3.40 | 0.61 | 5.96 | 1.00 | K7aaZuckerman & Song (2004) |
| Cha 5 | -8.57 | 4.29 | 8.75 | 1.48 | M4bbLuhman & Steeghs (2004) |
| Cha 6 | -5.04 | 0.42 | 20.89 | 1.05 | M2aaZuckerman & Song (2004) |
| Cha 10 | -1.15 | 0.28 | 5.0 | 0.93 | K7aaZuckerman & Song (2004) |
Note. — The name of the star, H equivalent width, standard deviation in the H equivalent width, , and standard deviation in are provided. A positive H EW denotes absorption.
| Star | H EW | H EW | Spectral Type | ||
|---|---|---|---|---|---|
| TWA 2a | -1.84 | 0.21 | 12.78 | 1.00 | M2ebbde la Reza & Pinzón (2004) |
| TWA 3b | -6.14 | 0.89 | 12.20 | 6.59 | M3.5bbde la Reza & Pinzón (2004) |
| TWA 7 | -5.82 | 0.85 | 5.0 | 1.59 | M1aaZuckerman & Song (2004) |
| TWA 8a | -8.00 | 1.42 | 5.0 | 1.15 | M2bbde la Reza & Pinzón (2004) |
| TWA 8b | -13.3 | 1.84 | 11.20 | 2.52 | M5ccSpectral type approximated by visual comparison with other stars in this group. |
| TWA 9a | -2.14 | 0.45 | 11.26 | 0.53 | K5bbde la Reza & Pinzón (2004) |
| TWA 9b | -4.31 | 0.60 | 8.39 | 0.61 | M1bbde la Reza & Pinzón (2004) |
| TWA 10 | -13.6 | 9.63 | 6.33 | 1.18 | M2.5aaZuckerman & Song (2004) |
| TWA 11b | -3.45 | 0.62 | 12.11 | 0.93 | M2.5bbde la Reza & Pinzón (2004) |
| TWA 12 | -4.83 | 0.85 | 16.22 | 0.94 | M2bbde la Reza & Pinzón (2004) |
| TWA 13a | -3.01 | 0.69 | 10.46 | 1.10 | M1ebbde la Reza & Pinzón (2004) |
| TWA 13b | -3.00 | 0.74 | 10.33 | 1.19 | M2ebbde la Reza & Pinzón (2004) |
| TWA 15a | -8.81 | 0.51 | 21.33 | 2.16 | M1.15bbde la Reza & Pinzón (2004) |
| TWA 15b | -8.59 | 1.35 | 32.33 | 1.86 | M2bbde la Reza & Pinzón (2004) |
| TWA 18 | -3.32 | 0.36 | 24.12 | 0.74 | M0.5bbde la Reza & Pinzón (2004) |
| TWA 19a | 2.60 | 0.13 | 28.35 | 0.71 | G5bbde la Reza & Pinzón (2004) |
| TWA 21 | -0.11 | 0.18 | 6.00 | 1.00 | M1bbde la Reza & Pinzón (2004) |
| TWA 22 | -11.5 | 1.95 | 9.67 | 2.37 | M5aaZuckerman & Song (2004) |
| TWA 23 | -2.44 | 0.19 | 14.78 | 1.72 | M1aaZuckerman & Song (2004) |
| TWA 24s | -0.30 | 0.16 | 13.87 | 1.13 | K3aaZuckerman & Song (2004) |
| TWA 25 | -2.36 | 0.54 | 11.78 | 1.86 | M0aaZuckerman & Song (2004) |
Note. — See notes for Table 1 for column heading explanation.
| Star | H EW | H EW | Spectral TypeaaZuckerman & Song (2004) | ||
|---|---|---|---|---|---|
| AO Men | -0.56 | 0.12 | 15.96 | 0.69 | K6/7 |
| AU Mic | -2.24 | 0.81 | 8.49 | 0.97 | M1 |
| HD 164249 | 5.43 | 0.09 | 22.50 | 1.97 | F5V |
| HD 181327 | 5.09 | 0.05 | 20.83 | 1.33 | F5.5 |
| HD 35850 | 4.31 | 0.18 | 52.00 | 1.00 | F7 |
| PZ Tel | 2.29 | 0.17 | 77.50 | 2.81 | K0Vp |
| V343 Nor | 2.22 | 0.15 | 17.00 | 1.00 | K0V |
| GJ 3305 | -2.15 | 0.27 | 5.30 | 1.03 | M0.5 |
| GJ 799n | -10.9 | 1.61 | 10.56 | 2.13 | M4.5e |
| GJ 799s | -9.25 | 0.61 | 17.00 | 3.54 | M4.5e |
| HIP 23309 | -0.77 | 0.13 | 5.77 | 0.73 | M0.5 |
| HIP 23418A | -6.55 | 0.00 | 7.67 | 2.08 | M3V |
| HIP 23418B | -6.06 | 0.00 | 21.00 | 4.36 | M3bbSpectral type approximated by visual comparison with other stars in this group. |
| HIP 112312 | -6.61 | 0.14 | 14.00 | 1.73 | M4e |
| HIP 112312B | -8.16 | 0.46 | 24.33 | 4.93 | M4e |
| HIP 12545 | -0.56 | 0.00 | 9.30 | 0.64 | M0 |
Note. — See notes for Table 1 for column heading explanation.
| Star | H EW | H EW | Spectral Type aaZuckerman & Song (2004) | ||
|---|---|---|---|---|---|
| CD -53544 | -1.43 | 0.24 | 82.22 | 5.02 | K6Ve |
| CD -60416 | -0.48 | 0.04 | 10.11 | 0.60 | K3/4 |
| CPD -64120 | -0.19 | 0.12 | 30.22 | 1.09 | K1Ve |
| GSC 8056-0482 | -5.31 | 0.44 | 34.22 | 5.61 | M3Ve |
| GSC 8491-1194 | -4.14 | 0.36 | 12.78 | 0.83 | M3Ve |
| GSC 8497-0995 | -0.63 | 0.22 | 6.56 | 0.53 | K6Ve |
| HIP 107345 | -1.41 | 0.15 | 6.44 | 1.33 | M1 |
| HIP 1993 | -1.01 | 0.11 | 9.50 | 0.55 | M1 |
| HIP 2729 | -0.68 | 0.26 | 127.5 | 3.94 | K5V |
| HIP 3556 | -0.79 | 0.02 | 5.0 | 0.52 | M3 |
| HD 13183 | 2.70 | 0.13 | 21.00 | 0.71 | G5V |
| HD 13246 | 4.13 | 0.13 | 29.78 | 1.79 | F8V |
| HD 8558 | 2.62 | 0.10 | 12.11 | 0.60 | G6V |
| HD 9054 | 0.76 | 0.11 | 5.0 | 0.53 | K1V |
| HIP 105388 | 2.58 | 0.10 | 12.83 | 0.39 | G5V |
| HIP 107947 | 4.26 | 0.05 | 30.42 | 1.38 | F6V |
| HIP 108422 | 1.55 | 0.54 | 139.8 | 9.42 | G8V |
| HIP 1113 | 2.57 | 0.05 | 6.00 | G6V | |
| HIP 1481 | 4.06 | 0.00 | 22.67 | 0.52 | F8/G0 |
| HIP 16853 | 3.41 | 0.10 | 17.80 | 0.41 | G2V |
| HIP 21632 | 3.02 | 0.00 | 17.53 | 0.64 | G3V |
| HIP 22295 | 3.54 | 0.29 | 41.33 | 2.10 | F7V |
| HIP 30030 | 3.31 | 0.17 | 40.40 | 1.24 | G0 |
| HIP 30034 | 1.30 | 0.26 | 9.73 | 1.71 | K2V |
| HIP 32235 | 2.72 | 0.05 | 10.25 | 0.45 | G6V |
| HIP 33737 | 0.77 | 0.52 | 8.93 | 0.26 | K3V |
| HIP 490 | 3.72 | 0.03 | 14.50 | 0.55 | G0V |
| HIP 9141 | 3.03 | 0.07 | 14.78 | 0.44 | G3/5V |
| TYC 5882-1169 | 0.74 | 0.16 | 6.80 | 0.56 | K3/4 |
| TYC 7065-0n | 1.45 | 0.02 | 22.33 | 1.03 | K4V |
| TYC 7065-0s | 1.58 | 0.06 | 14.00 | 0.89 | K4bbSpectral type approximated by visual comparison with other stars in this group. |
| TYC 7600-0 | 1.76 | 0.25 | 18.80 | 0.86 | K1 |
Note. — See notes for Table 1 for column heading explanation.