Optical Imaging and H i Synthesis Observations
of the Dwarf Irregular Galaxy ESO 364-G029
As part of an effort to enlarge the number of well-studied Magellanic-type galaxies, we obtained broadband optical imaging and neutral hydrogen radio synthesis observations of the dwarf irregular galaxy ESO 364-G029. The optical morphology characteristically shows a bar-like main body with a one-sided spiral arm, an approximately exponential light distribution, and offset photometric and kinematic centers. The H i distribution is mildly asymmetric and, although slightly offset from the photometric center, roughly follows the optical brightness distribution, extending to over Holmberg radii (where mag arcsec-2). In particular, the highest H i column densities closely follow the bar, one-arm spiral, and a third optical extension. The rotation is solid-body in the inner parts but flattens outside of the optical extent. The total H i flux Jy km s-1, yielding a total H i mass (for a distance Mpc) and a total H i mass-to-blue-luminosity ratio (distance independent). The H i data suggest a very complex small-scale H i structure, with evidence of large shells and/or holes, but deeper observations are required for a detailed study. Follow-up observations are also desirable for a proper comparison with the Large Magellanic Cloud, where despite an optical morphology very similar to ESO 364-G029 the H i bears little resemblance to the optical.
Key Words.:
Galaxies: individual: ESO 364-G029 – Galaxies: irregular – Galaxies: photometry – Galaxies: kinematics and dynamics – Galaxies: structure – Galaxies: ISM1 Introduction
In the currently popular bottom-up galaxy and structure formation scenarios, studies of gas-rich low-metallicity dwarf galaxies are invaluable, as these objects must have dominated the Universe in the past (e.g. White & Frenk 1991; Kauffmann et al. 1993; Cole et al. 1994; but see also Chiu et al. 2001). They are also expected to be more uniformly distributed than their larger counterparts (e.g. Dekel & Silk 1986) and may in fact still be the most common type of object in the Universe (e.g. Mateo 1998; Im et al. 1999; Driver 1999).
The Magellanic-type spirals (Sm; with rotational symmetry and some spiral structure) and Magellanic irregulars (Im; asymmetric with no spiral structure) are at the transition between fully fledged spirals and true dwarf irregulars (de Vaucouleurs 1956, 1959). With respect to the latter two groups of galaxies, Sm and Im galaxies have intermediate physical properties such as rotation velocity, nuclear concentration, colour, and neutral hydrogen content. Although the prototype of the class, the Large Magellanic Cloud (LMC; classified as SB(s)m in NED111NASA/IPAC Extragalactic Database.), is amongst the best studied galaxies (e.g. Westerlund 1997; van der Marel et al. 2002; Kim et al. 2003; Brüns et al. 2005; van der Marel 2006 and references therein), the general properties of Magellanic systems are surprisingly poorly known. The classical reference on the subject remains that of de Vaucouleurs & Freeman (1972). Odewahn (1991, 1994) provides more modern studies and argues that it is a misconception to consider the LMC and other galaxies like it as irregular. Magellanic-type galaxies are characterized by an asymmetric spiral arm connected at one end to a high surface brightness bar. The bar center is often offset from the center of the galaxy as defined by the outer optical isophotes, and the arm normally has a clumpy appearance, presumably due to triggered star formation. The arm can sometimes be followed completely around the galaxy and, in some cases, small “embryonic” arms are present at the ends of the bar (de Vaucouleurs 1955).
Various simulations have shown a that one-armed morphology can develop from a strong tidal encounter with a companion (e.g. Byrd et al. 1986; Howard & Byrd 1990). The models generally predict only a short-lived one-armed spiral structure, implying that a companion galaxy should generally be present close to any Magellanic galaxy. Using a sample from the Third Reference Catalog of Bright Galaxies (de Vaucouleurs et al. 1991, hereafter RC3), Odewahn (1994) demonstrated that close companions are indeed observed in almost every case. As for the LMC itself, its interaction with both the Milky Way and the Small Magellanic Cloud (SMC) is most likely at the origin of its one-arm structure and large-scale disturbed morphology (e.g. Putman et al. 1998, 2003 and references therein).
| Quantity | Value | R. |
| Morphological type | IB(s)m | 1 |
| Right ascension (J2000) | 1 | |
| Declination (J2000) | 1 | |
| Galactic longitude | 1 | |
| Galactic latitude | 1 | |
| Heliocentric radial velocity | km s-1 | 2 |
| (from H i measurements) | km s-1 | 3 |
| Scale length () | 3 | |
| Radius ( mag ) | 2 | |
| 3 | ||
| Radius ( mag ) | 3 | |
| Inclination | 2 | |
| Axial ratio ( mag ) | 2 | |
| 3 | ||
| Asymmetry | 3 | |
| Position angle ( mag ) | PA | 2 |
| PA | 3 | |
| Central surface brightness | mag | 3 |
| Apparent total mag | mag | 2 |
| mag | 3 | |
| Corrected apparent mag | mag | 2 |
| mag | 3 | |
| Corrected absolute mag | mag | 2 |
| mag | 3 | |
| Distance | Mpc | 2 |
| Mpc | 3 | |
| Mpc | 4 | |
| Scale | kpc | 2 |
| kpc | 3 | |
| kpc | 4 | |
| Total H i mass | 3 | |
| H i mass-to-blue-luminosity ratio | 3 |
The kinematics of the warp in the H i distribution of the Magellanic-type galaxy NGC~3109 and the nearby Antlia dwarf galaxy also suggests that the galaxies had a mild interaction about 1 Gyr ago (Barnes & de Blok 2001). Based on the morphology and kinematics, Bush & Wilcots (2004) draw a similar conclusion for the neighbours NGC~4618 and NGC~4625. However, not all Magellanic-type galaxies have an obvious neighbour for a recent interaction. Bekki & Chiba (2006) suggest that the morphologies of these apparently isolated galaxies may be explained by a recent interaction with an (optically) invisible companion. The H i survey performed by Doyle et al. (2005), however, shows that evidence for the existence of these “dark galaxies” is marginal.
In order to address the asymmetry issue, Wilcots & Prescott (2004) performed an H i survey of a sample of 13 Magellanic spiral galaxies with apparent optical companions. In their study, they find that only four of these have confirmed H i-detected neighbours. Their study also indicates that the presence of companions near NGC~2537 and UGC~5391 has no effect on the morphology of these galaxies, and that Magellanic spirals are no more asymmetric than a random sample in the field. The latter conclusion is supported by H i observations of the interacting Magellanic spirals NGC~4618 and NGC~4625 (Bush & Wilcots 2004). On the other hand, in their H i study of (possibly) interacting Magellanic galaxies in the M81 group, Bureau et al. (2004) find no large-scale tidal feature and no intergalactic H i cloud near the Magellanic dwarf M81dwA, and remark that this galaxy could be a tidal dwarf galaxy (rather than a perturbed “regular” dwarf), resulting from the debris of a past encounter with Holmberg~II.
Magellanic dwarf galaxies are also known to contain a large number of shells and holes in their interstellar medium. These structures are created by winds and supernova explosions of the most massive stars in star forming regions. Unlike in spiral systems, these structures are long-lived in dwarf galaxies, due to solid-body rotation and a lack density of waves. Well-known dwarfs exhibiting shells and holes include the LMC (SB(s)m; Kim et al. 1998), IC~2574 (SAB(s)m; Walter & Brinks 1999) and Holmberg~II (Im; Puche et al. 1992; but see also Rhode et al. 1999; Bureau & Carignan 2002).
A significant amount of neutral hydrogen is known to be present beyond the optical extent of Magellanic-type galaxies, often up to 2–3 Holmberg radii (e.g. NGC~925; Pisano et al. 1998; Pisano & Wilcots 2000; DDO~43; Simpson et al. 2005), occasionally reaching up to 6 Holmberg radii (NGC~4449; Hunter et al. 1998). The H i distribution of several Magellanic dwarfs is known to exhibit further irregularities, such as H i loops surrounding the galaxy (NGC~4618; Bush & Wilcots 2004) and external spurs or blobs (e.g. NGC~5169; Mühle et al. 2005; UGCA~98; Stil et al. 2005). An S-shaped distortion in the H i velocity field, possibly indicating counterrotation, has been observed in NGC~4449 (Hunter et al. 1998) and DDO~43 (Simpson et al. 2005).
The asymmetries and irregularities in the H i distribution of Magellanic-type galaxies are often associated with a high star formation rate, such as for IC~10 (e.g. Wilcots & Miller 1998; see also Thurow & Wilcots 2005). Using H observations, Wilcots & Thurow (2001) find that, in several regions of the Magellanic spiral NGC~4214, the velocity of the ionized gas is km s-1 higher than that of the H i, indicating massive star formation. The study of NGC~4449 by Hunter et al. (2000) compares H, H2, H i and near-infrared emission, and suggests that the different regions of this galaxies are in different stages of star formation.
As part of an effort to increase the number of Magellanic dwarfs with
detailed observations, we focus in this paper on the relatively nearby
Magellanic dwarf irregular galaxy ESO 364-G029
(PGC~018396).
ESO 364-G029 was first reported by Holmberg et al. (1978), who classified it as a
“dwarf irregular or emission nebulae” using the ESO (B) Atlas.
By combining optical data from the UK Schmidt plates with Parkes H i
observations, Longmore et al. (1982) concluded that ESO 364-G029 is a dwarf irregular
galaxy, although Karachentseva & Karachentsev (2000) designate the object as “dwarf irregular or
reflection nebula” in their optical search for nearby dwarf galaxy
candidates in the Southern hemisphere.
ESO 364-G029 was identified (and rejected) as a possible companion of
the nearby dwarf galaxy NGC~2188 by Domgörgen et al. (1996).
Zimmermann et al. (2001) reported a possible X-ray counterpart to ESO 364-G029 using
ROSAT data.
ESO 364-G029 appears in a handful of other surveys, such as the Nearby Optical
Galaxies Catalogue (Giuricin et al. 2000), the Catalog of Nearby Galaxies
(Karachentsev et al. 2004), the HIPASS222H i Parkes
All-Sky Survey:
http://www.atnf.csiro.au/research/multibeam/release/ . catalogue
(Huchtmeier et al. 2001; Meyer et al. 2004; Koribalski et al. 2004), and the surveys for optical/H i
counterparts of Paturel et al. (2005) and Doyle et al. (2005).
Although the general properties (such as luminosity and H i content) of
ESO 364-G029 are reasonably well constrained by the above-mentioned surveys, the
detailed morphology and kinematics of the galaxy were not studied in detail
previously.
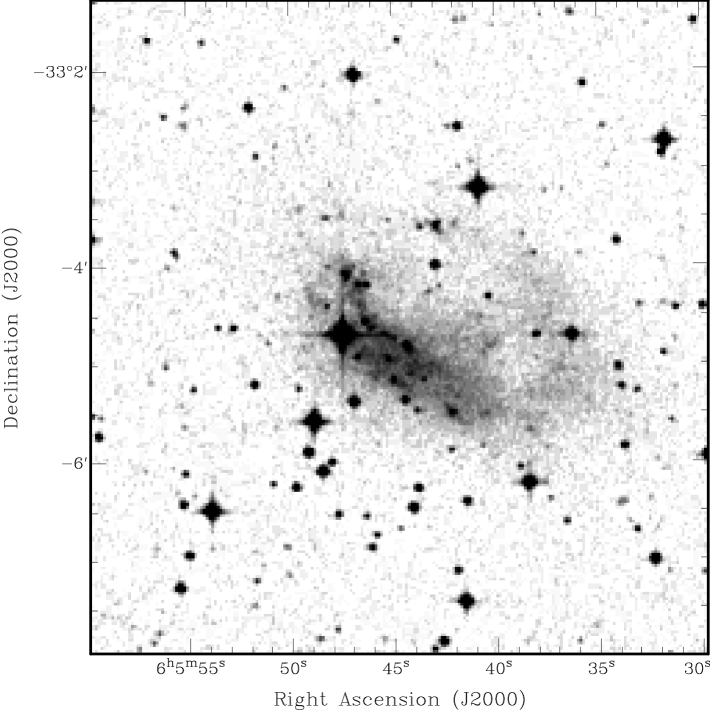
General properties of ESO 364-G029 are listed in Table 1 and an
optical image from the Digitized Sky Survey (DSS) is shown in
Figure 1.
This paper is organized as follows. Optical observations and surface photometry of ESO 364-G029 are presented in § 2 while H i spectral line-imaging is discussed in § 3. In § 4 we constrain the distance to ESO 364-G029. The discussion in § 5 focuses on a comparison with the LMC, the importance of interactions, and the possible presence of H i shells and holes in ESO 364-G029. Finally, our main conclusions are briefly summarized in § 6.
2 Optical Data
2.1 Observations and Data Reduction
Optical imaging observations were obtained on the nights of 9–11 April 1997 using the 1-m telescope of Siding Spring Observatory (SSO) in Australia. A total of broadband images combining short and long exposures were obtained in the , and Cousins filter bands. A thinned TEK CCD with 15 m pixels was used in direct imaging, yielding a spatial sampling of pix-1. A CCD subsection with pixels virtual overscan was read, for a total field-of-view of . The seeing was moderate (–) but sufficient for basic photometry and comparison with our H i observations.
The data reduction was carried out using standard procedures in IRAF333IRAF is distributed by the National Optical Astronomy Observatories (NOAO), which are operated by the Association of Universities for Research in Astronomy (AURA), Inc., under cooperative agreement with the National Science Foundation (NSF). (Tody 1986, 1993). All the images were overscan-subtracted, bias-subtracted using bias scans obtained every night, and flatfielded using twilight flatfields. Dark current corrections were not necessary due to the low dark current levels and the relatively short exposure times. The cosmetic of the CCD is good, with only one bad column and few bad pixels. All target images in a given filter were then registered and combined using a pixel rejection algorithm, convolving all images to a common (largest) seeing in each filter. Because ESO 364-G029 is faint but lies in a region with many bright foreground stars, all pixels with counts above of the saturation level were rejected in the long exposure images, to prevent excessive bleeding. Short exposures fill in the rejected regions, easing the masking and interpolation of bright foreground stars (see below).
Three sets of carefully selected and corrected Landolt standards (Landolt 1992; Bessell 1995) were used for photometric calibration. Since we do not require precise photometry, we adopted the averaged extinction coefficients for the SSO 1-m telescope. The resulting combined and calibrated images are shown in Figure 2.
2.2 Surface Photometry
Standard ellipse fitting using the Ellipse and Isophote packages in IRAF (see Jedrzejewski 1987) was used to derive the azimuthally-averaged surface brightness profile of ESO 364-G029 in each filter. For each semi-major axis , the ellipses are characterized by the central coordinates (,), the ellipticity (defined as , where and are the semi-major and semi-minor axis, respectively) and the position angle PA, measured from North to East.
The derived surface brightness profiles should be used with caution, for the following reasons. First, ESO 364-G029’s irregular and lopsided morphology renders any azimuthally-averaged profile at best a modest representation of its two-dimensional light distribution. Second, many bright foreground stars are present in the field of ESO 364-G029. Particularly troublesome is the bright star TYC 7075-383-1 located near the North-East edge of the central bar at (, ; J2000), which has and mag (Kharchenko 2001). The most elegant way to remove the foreground stars is to subtract the stellar profiles from the image. However, the brightest stars in the field are saturated and show bleeding effects even in our shortest exposures, so we masked out the brightest foreground stars, and interpolated the surface brightness in the masked regions. As the images in each of the three filters have a comparable resolution, the same regions were used for all filters.
Mainly because of ESO 364-G029’s irregular morphology, it was difficult to obtain reliable and stable fits for the whole range of possible semi-major axes ( to ). Our results are shown in Figures 3–5. The -band images are less deep because of the relatively bright background. In order to get meaningful colors, the ellipses were fitted on the image only and imposed on the and band images. One can see that the ellipticity and position angle of the ellipses were successfully fitted over a limited range of semi-major axes only, . For lack of a better prescription, they are assumed constant outside of those limits.


The light profiles are approximately exponential over most of the optical extent (), falling off with roughly 1.38 mag arcmin-1. A break to a steeper fall-off is seen at . A fit to the profile within that region yields a radial scale length and an (uncorrected) extrapolated central surface brightness mag . The standard criterion for defining low surface brightness galaxies is for the extrapolated central surface brightness (based on the outer exponential disk) to be equal or fainter than mag in (Impey & Bothun 1997). Following this definition, ESO 364-G029 would qualify as a low surface brightness galaxy. The surface brightness profile also suggests a radius at the mag isophote of , identical to the values listed in HyperLEDA444HyperLEDA: http://leda.univ-lyon1.fr . and the RC3. The Holmberg radius (defined at the mag isophote in ; see Holmberg 1958) is .
Over most of the disk mag, slightly bluer in the very inner and outer parts. This is marginally bluer than the LMC ( mag; HyperLEDA) but similar to NGC~4618 (SBm; Odewahn 1991). The color increases from mag in the inner parts to mag in the outer parts, again similar to NGC~4618.
Constructing growth curves from the surface brightness profiles shown in Figure 3, the extrapolated total apparent magnitudes are , and mag, in good agreement with the values listed in the RC3 ( mag), HyperLEDA ( mag) and The Surface Photometry Catalogue of the ESO-Uppsala Galaxies ( mag; Lauberts & Valentijn 1989). Correcting for Galactic extinction following Schlegel et al. (1998), but neglecting the inclination-dependent internal absorption, we obtain the following corrected total apparent magnitudes: , and mag.
3 H i Radio Synthesis Data
3.1 Observations and Data Reduction
Radio synthesis data of ESO 364-G029 were obtained with four different configurations of the Australia Telescope Compact Array (ATCA). Full hour syntheses were obtained with the 375, 750C and 750E arrays, while shorter observations (– hour on-source) were also obtained twice in the 1.5D array. Antenna CA06, providing the longest possible baselines, was not used in the 375, 750C and 750E arrays. Both H i line and continuum data (centered at MHz) were obtained simultaneously in two polarizations, but only the line data will be discussed here. In the 375, 750C and 750E configurations, channels in each polarization were used, each km s-1 wide, for a total bandwidth of km s-1. In the 1.5D configuration, channels of km s-1 width were used in each polarization for a total coverage of km s-1. These and other relevant observing parameters are listed in Table 2.
| ATCA array | Date of obs. | Maximum baseline |
| 375 | 1997 Oct 3–4 | m |
| 750C | 1997 Oct 25–26 | m |
| 750E | 1998 May 30 | m |
| 1.5D | 1997 Mar 8, 10 | m |
| Property | 1.5D array | 375, 750C, 750E arrays |
| Primary beam | HPBW | HPBW |
| Correlator | FULL_8_512-128 | FULL_4_1024-128 |
| Channel width | kHz | kHz |
| ( km s-1) | ( km s-1) | |
| Bandwidth | MHz | MHz |
| ( km s-1) | ( km s-1) | |
| Flux calibrator | PKS~1934-638 | PKS~1934-638 |
| Phase calibrator | PKS~0614-349 | PKS~0614-349 |
Note: Antenna CA06 was not used with the 375, 750C and 750E arrays.
The data were reduced using standard procedures in MIRIAD555MIRIAD was developed by the Australia Telescope National Facility (ATNF) which is part of the Commonwealth Scientific and Industrial Research Organization (CSIRO) of Australia. (Sault et al. 1995) and visualized with KARMA (Gooch 1995). The strong source PKS~1934-638 (Reynolds 1994) was observed once briefly in each configuration for use as a flux calibrator. PKS~0614-349, located to the South-East of ESO 364-G029, was observed roughly every minutes for use as a complex gain and bandpass calibrator.
The (ATCA-specific) self-interference channels were first removed, after which the line data were transformed to heliocentric rest frame and Hanning smoothed. Bad data, mostly due to short duration interference, was then masked out manually and the flux density, complex gains, and bandpass were calibrated. The continuum emission was subtracted in the plane using a linear fit to line-free channels on each side of ESO 364-G029’s emission (excluding bandpass-affected channels), and the data were then imaged to create dirty cubes.
Both uniform- and natural-weighted cubes were created and a box (equal to the primary beam diameter) was imaged. In each case the pixel size was chosen to sample the synthesized beam with 2 to 3 pixels. The four datacubes used in our analysis are listed in Table 3, and are hereafter abbreviated as NH (naturally-weighted, high-sensitivity datacube), UH (uniformly weighted, high-sensitivity datacube), NL (naturally weighted, low-sensitivity datacube) and UL (uniformly weighted, low-sensitivity datacube). For datacubes UH and NH we merge the 375, 750C and 750E arrays only, while for datacubes UL and NL we combine the data for all arrays. Note that the low-sensitivity datasets (NL and UL) have a significantly higher spatial resolution. In the analysis below we use the the high-sensitivity datasets for global properties and the high-resolution datasets for the small-scale morphology. Table 3 lists the root-mean-square (rms) noise per channel and synthesized beam for each dataset. When considering the noise levels reached, one should remember that the channel width for the 1.5D observations was four times as large as that for the other arrays, although these observations were regridded onto the narrower km s-1 channels when combined with the shorter arrays.
| Datacube | Properties | Arrays used | Pixel | Weighting | rms noise | Beam properties | |
|---|---|---|---|---|---|---|---|
| size | per channel | FWHM | |||||
| (arcsec) | (mJy beam-1) | (arcsec) | (deg) | ||||
| Datacube NH | high sensitivity, low resolution | 375, 750C and 750E | natural | ||||
| Datacube UH | high sensitivity, low resolution | 375, 750C and 750E | uniform | ||||
| Datacube NL | low sensitivity, high resolution | All arrays | natural | ||||
| Datacube UL | low sensitivity, high resolution | All arrays | uniform | ||||
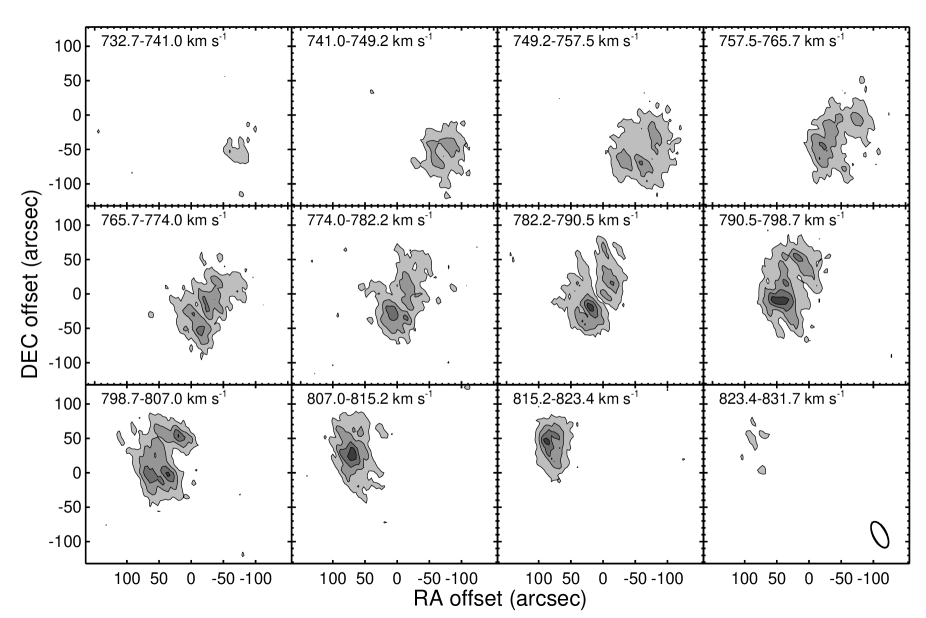
The Clark Clean algorithm (Clark 1980) was used for the deconvolution, cleaning an area tightly encompassing the emission in each channel. The maps were cleaned until the total cleaned flux stopped increasing, typically at a depth of times the rms noise per channel, which was sufficient to remove all sidelobes. The clean components were then restored and added to the residuals using a Gaussian clean beam as listed in Table 3 (and resulting from a fit to the inner parts of the dirty beam). Channel maps of datacube UL (with the best spatial resolution) are shown in Figure 6, where each map displayed is the average of channels to increase sensitivity.
3.2 Global H i Profile
To maximize the flux recovered, the (masked) NH datacube was used to derive the global profile of ESO 364-G029, which is shown in Figure 7. The linewidth (uncorrected for instrumental broadening) at of the peak is km s-1, while that at km s-1. We adopt a systemic velocity, taken to be the midpoint of the velocities at of the peak, of km s-1. An intensity-weighted mean of the entire profile gives km s-1, consistent with the former value. Longmore et al. (1982) obtained km s-1 and km s-1 from Parkes Telescope data (HPBW). Both values are in good agreement with our observations, especially considering that the slightly lower spectral resolution of Longmore et al. (1982) may have led to a mild overestimation of . Huchtmeier et al. (2001) list km s-1 and km s-1 from HIPASS, also using Parkes.
After integration over the full profile in Figure 7, we find a total H i flux Jy km s-1. Longmore et al. (1982) obtained Jy km s-1 but Huchtmeier et al. (2001) list Jy km s-1, while Koribalski et al. (2004) and Meyer et al. (2004) respectively quote and Jy km s-1 from HIPASS data (the latter HIPASS measurements were obtained under the assumption that ESO 364-G029 is a point source). It is thus unclear from those if our synthesis observations are missing any short spacing flux or not. We reanalyzed the HIPASS archive observations ourselves, summing the data in a box, and we find a total H i flux of Jy km s-1, still lower than the result of Longmore et al. (1982) but consistent with our own ATCA measurement. This HIPASS global profile is also shown in Figure 7.
Additional uncertainties in the H i flux include the possibility of H i self-absorption and the existence of dense gas clumps associated with the apparently diffuse H i gas (Grenier et al. 2005). Given that , where is the column density, the opacity, the spin temperature, and and are correlated (Dickey & Lockman 1990), it is not easy to calculate a definite upper limit for even from the line analysis. Simplifications can however be made using the isophotal axis ratio as a measure of the disk inclination (Giovanelli et al. 1994). The correction factor, , for the disk of ESO 364-G029 is about , so this effect is likely small; we have not corrected for H i self-absorption above.
The ATCA global profile shown in Figure 7 appears asymmetric, with more H i at higher velocities. This behaviour is common among late-type dwarfs (e.g. Richter & Sancisi 1994; Swaters et al. 2002). Schoenmakers et al. (1997) have developed a complex algorithm to quantify asymmetry using Fourier techniques. In our analysis, however, we restrict ourselves to the standard moment maps, and quantify the importance of the asymmetry with the parameter
| (1) |
where is the flux as a function of frequency . In the expression above, we adopted integration limits of and km s-1, respectively (as for the mean velocity and total fluxes above). The global profile asymmetry of ESO 364-G029 is thus mild and the HIPASS data show an even milder asymmetry.
3.3 H i Moments and Rotation Curve
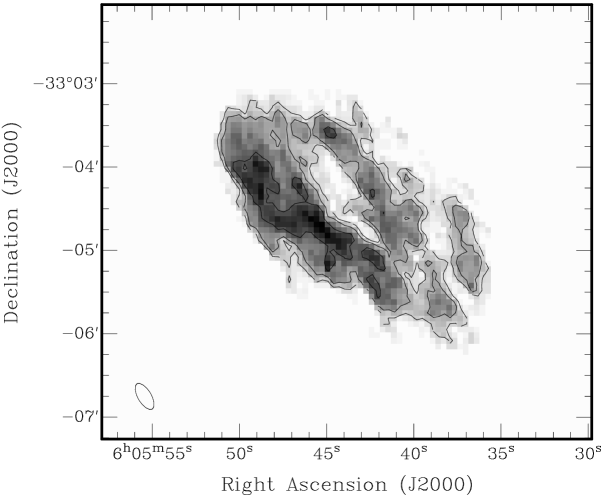
Moment maps were derived in the standard manner from the cleaned cubes of the datasets listed in Table 3. Figures 8–10 show the total H i map, the velocity field and the velocity dispersion field for the high-resolution dataset, both uniform and natural-weighted. All significant emission is contiguous so a mask was derived from the zeroth moments and applied to the others.
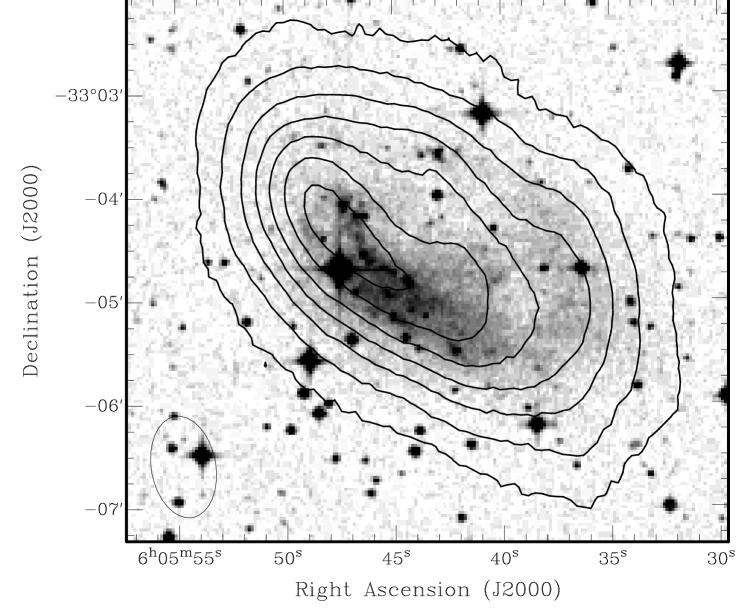
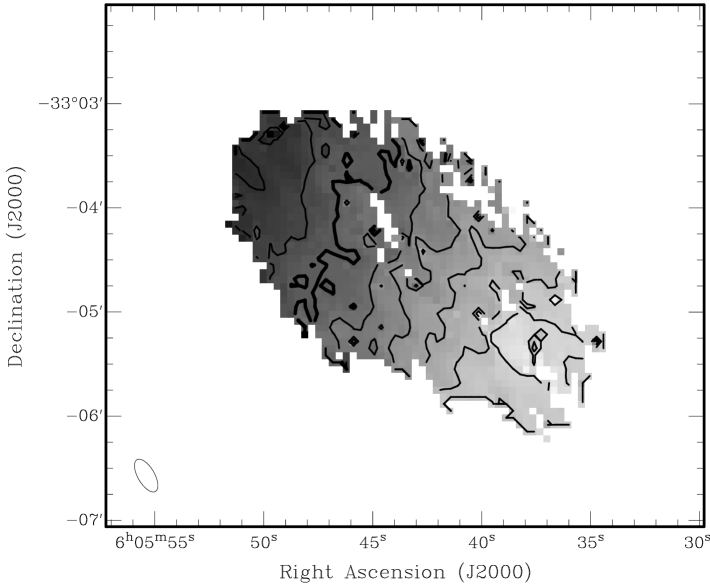
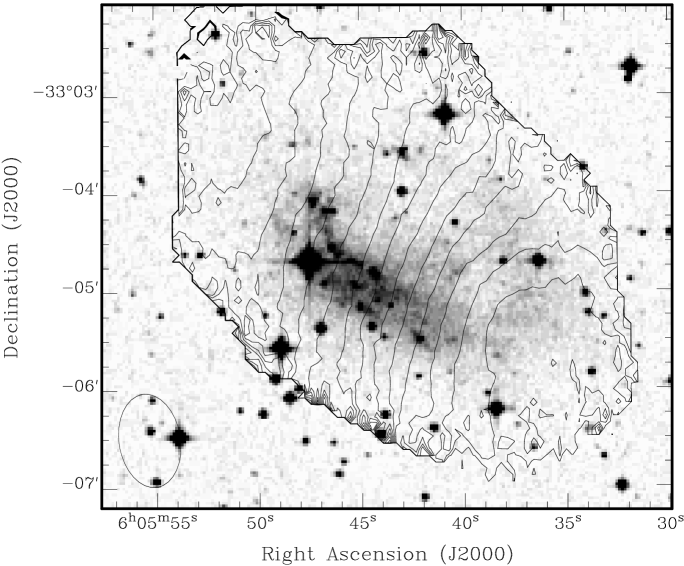
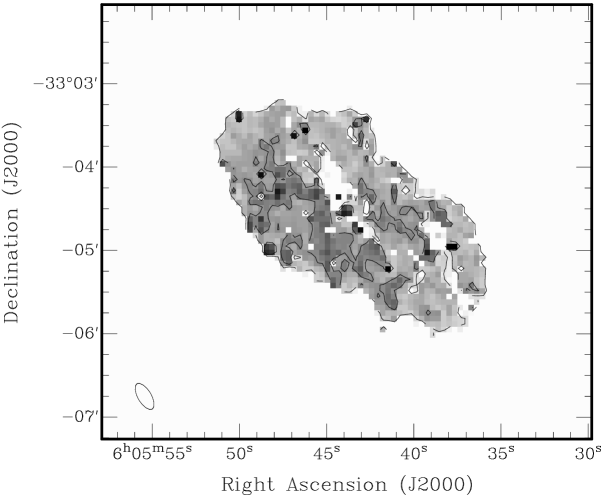
The total H i maps (Figure 8) show that the H i roughly follows the optical light, although slightly offset to the North-East, and has the same asymmetries. The map from datacube UL shows very well that the H i is concentrated along the main bar and the one-arm spiral, although there is a third component intermediate between those two in terms of position, length, and mass. While this third component has a stellar counterpart where it joins with the bar, this does not appear to be the case over its entire length. The velocity fields (Figure 9) reveal solid-body rotation over the entire optical extent, a common feature among dwarf irregular galaxies (e.g. de Blok et al. 1996; Swaters 1999). Interestingly, no kinematic lopsidedness is present and the one-arm spiral has no obvious influence on the kinematics, although this may simply be related to the poor spatial resolution of most maps. The rotation curve appears to flatten at the largest radii and a kink in the kinematic major-axis suggests the presence of a warp in the outer parts. The velocity dispersion is – km s-1 over most of the galaxy (Figure 10), the higher values being reached over the optical bar and the third component.
The GIPSY666Groningen Image Processing System. (van der Hulst et al. 1992; Vogelaar & Terlouw 2001) implementation of ROTCUR (Begeman 1987) was used for rotation curve fitting. The target was divided into concentric tilted rings, each approximately half a beam width wide, and at first all six parameters describing each ring were left free: the center coordinates (,), systemic velocity , inclination , position angle of the kinematic major-axis and rotation velocity . After a few trials with the velocity field of the NL datacube, the systemic velocity was fixed to km s-1, and the center coordinates were fixed at ; J2000).
As the inclination is only loosely constrained by the observations, we fixed it at the HyperLEDA value of . This value for the inclination depends on the assumed thickness of ESO 364-G029, but is consistent with the values returned by ROTCUR in our first trials, and is likely a good approximation of the true inclination of ESO 364-G029. For an oblate galaxy with semi-major axis and semi-minor axis , the relation between the intrinsic thickness and the projected axis ratio is given by
| (2) |
(e.g. Bottinelli et al. 1983). For an intrinsic thickness (Holmberg 1946), an inclination implies a projected axis ratio , consistent with our observations at large radii (e.g. Figures 4 and 8). In any case, the rotation velocities can easily be scaled for other inclination values.
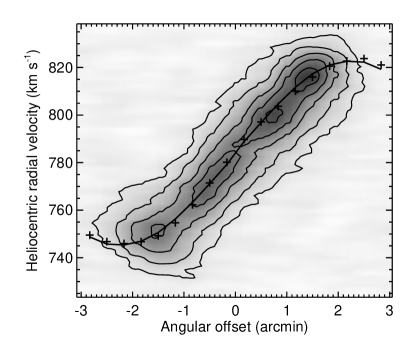
With the values of , and are fixed, we fit for the kinematic position angle and rotation velocity as a function of semi-major axis position using datacube NL. The fitted position angle is consistent with over the whole semi-major axis range. The resulting rotation curve is shown in Figure 11, overlaid on a position-velocity diagram taken along the major-axis. As the H i column density decreases rapidly at large radii (), we obtain our data points at these radii from the high-sensitivity datacube NH. The rotation curve is typical of late-type systems, rising in an almost solid-body manner in the central parts. The maximum rotational velocity of km s-1 is reached at (the optical extent), corresponding to a projected distance of kpc, and the rotation curve flattens out at larger radii. The data hint at a decline in the rotational velocity at radii , though deeper H i observations are necessary to confirm this. One should however remember that ROTCUR assumes axisymmetry (like Ellipse for the surface photometry; see § 2.2), which may not be the case in ESO 364-G029. Our results may thus be systematically biased.
4 Distance Determination and Total Fluxes
No precise determination of the distance to ESO 364-G029 is available in the literature (e.g. through Cepheids or the tip of the red-giant branch), but it can be estimated in several ways. Adopting km s-1 and a Local Group infall toward the Virgo cluster of km s-1, HyperLEDA lists a distance of Mpc. For our analysis we adopt the slightly more refined linear Virgocentric flow model of Schechter (1980). We derive a distance to ESO 364-G029 of Mpc (random errors only), adopting a Virgo distance of Mpc (random errors only; Kelson et al. 2000), an observed Virgo redshift of km s-1 (Ebeling et al. 1998), a Local Group Virgocentric infall velocity of km s-1, (Aaronson et al. 1982) and a Virgocentric density contrast (representative of Abell clusters; Peebles 1976). An angular separation of then corresponds to a projected distance kpc.
At this adopted distance, the total H i flux Jy km s-1 (see § 3.1) corresponds to a total H i mass . ¿ From the corrected total apparent magnitudes listed in § 2.2 (corrected for Galactic extinction but not internal absorption), we derive the following corrected absolute magnitudes: , and mag. This is more than a magnitude fainter than the absolute magnitude of the LMC listed in HyperLEDA ( mag). Combining the optical and H i measurements, we obtain a (distance independent) total H i mass-to-blue-luminosity ratio /, roughly five times larger than that of the LMC based on HyperLEDA’s entries ( /). This is consistent with ESO 364-G029 being of later type than the LMC, although the total H i flux of the LMC is highly dependent on the area considered, given the presence of the Magellanic bridge (e.g. Putman et al. 1998; Brüns et al. 2005).
5 Discussion
5.1 Structure of ESO 364-G029 and a Comparison to the LMC
Figures 1–2 reveal an irregular but characteristic optical morphology for Magellanic-type dwarf galaxies. Indeed, the main body of ESO 364-G029 exhibits a bar-like morphology, from which protrudes a one-arm spiral circling the galaxy by at least , possibly more. This structure is sharpest in the bluer bands, suggesting that it is associated with relatively young stars and possibly ongoing star formation. Narrow-band H imaging would be particularly useful to confirm this latter point. Despite the irregular morphology, however, the azimuthally-averaged optical profiles are approximately exponential up to , after which they fall off more rapidly (see Figure 3).
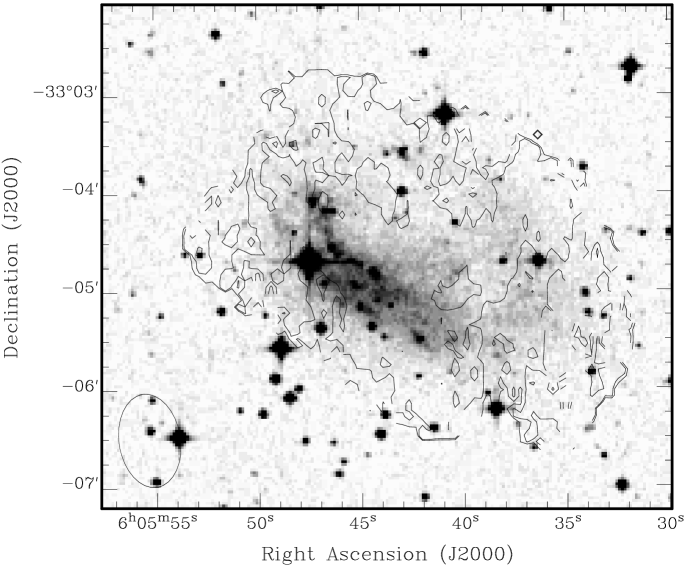
In our total H i map of datacube UL, the H i distribution has a radial extent of at least (corresponding to a column density of cm-2; see Figure 8), thus extending to at least or . This is fairly typical of dwarf irregular galaxies (e.g. Hunter 1997). The H i is also asymmetric, the column density falling off more steeply to the South-East than the North-West, and the absolute peak being slightly offset to the North-East. Both effects are common in late-type dwarf galaxies (see, e.g., Swaters et al. 2002).
The H i distribution is also slightly offset compared to the optical in all our maps, being shifted toward the North-East, and the H i kinematic center does not correspond to the optical center as defined by the surface photometry. The latter displacement is about , corresponding to a projected distance of kpc. This effect is present in a number of Magellanic-type galaxies (e.g. de Vaucouleurs & Freeman 1972). In particular, there are strong indications in the LMC that the kinematic center derived from the H i (e.g. Kim et al. 1998) is very different from that of the main disk, as traced by the distribution of red giant branch (RGB) and asymptotic giant branch (AGB) stars (van der Marel 2001) or the kinematics of intermediate-age carbon stars (van der Marel et al. 2002; Olsen & Massey 2007), while the morphological centers derived from those latter tracers are in rough agreement with each other (Weinberg & Nikolaev 2001). Evidence is also gathering that the LMC is intrinsically elongated (van der Marel & Cioni 2001; van der Marel 2006), presumably due to the tidal force from the Milky Way (van der Marel 2001; Mastropietro et al. 2005). For a distant galaxy, this would translate in different kinematic and photometric major axes. Given the uncertainties in the position angle, however, no significant difference is seen between the photometric and kinematic position angle profiles of ESO 364-G029 (Figures 4 and 9).
The rotation curve of ESO 364-G029 rises smoothly and reaches a value of about km s-1 in the outer parts (Figure 11). In comparison, the rotation of the LMC shows a sudden decline after its peak velocity km s-1 at kpc (Kim et al. 1998). An inclination of about is expected if ESO 364-G029 is to have the same rotation as the LMC. This however appears unlikely given the relatively high apparent ellipticity observed (Figures 4 and 8). Even the lowest optical ellipticity measured (; see Figure 4) is inconsistent with such a low inclination, for any intrinsic disk thickness (e.g. Bottinelli et al. 1983). As a disk with an intrinsically high ellipticity is unlikely, it is almost certain that ESO 364-G029 is less massive than the LMC over the range of radii probed. Interestingly however, the total H i mass of ESO 364-G029 is about a third higher than that of the LMC ( ; Staveley-Smith et al. 2003), resulting in a significantly larger H i mass-to-blue-luminosity ratio / for ESO 364-G029 (see § 4).
Despite a number of similarities between the optical and H i content of ESO 364-G029 and the LMC, one large and surprising difference exists. The medium- and large-scale H i structure of the LMC is very regular, bearing little resemblance to the optical structure and lacking any obvious trace of the main bar (e.g. Putman et al. 1998; Kim et al. 2003). As stated above, however, the H i distribution of ESO 364-G029 is highly asymmetric and roughly follows its optical morphology. In particular, and as best shown in the H i map (Figure 8), the H i is concentrated along the main bar and appears to follow the one-arm spiral to the North-West, in addition to a third intermediate component (also with an optical counterpart, at least partially). We have no explanation for these differences in the H i morphology; further observations in ATCA km configurations are needed to characterize the H i morphology of ESO 364-G029 better. In this respect, it would be interesting to see if the optical morphology of ESO 364-G029 remains the same at longer wavelengths or if, like the LMC, the preponderance of the bar decreases and the smoothness of the disk increases in the near-infrared (e.g. van der Marel 2001, Meixner et al. 2006). Also of interest is whether the H i differences arise from internal processes (e.g. supernovae feedback) or from external factors (e.g. tidal interactions). The former appears to dominate the H i structure of the LMC on small scales (Kim et al. 1998; Kim et al. 2003) and the latter on large scales (Putman et al. 1998; Staveley-Smith et al. 2003). However, this could be different for ESO 364-G029.
Interestingly, the velocity dispersion maps of ESO 364-G029 and the LMC are also somewhat different. In ESO 364-G029, the highest H i velocity dispersions are observed along the bar and the third component. In the LMC, the H i velocity dispersion is higher along the Eastern edge of the 30~Doradus region and near the dense molecular clouds extending to the South (Kim et al. 2003). Both regions are turbulent due to the combined effects of shocks from ram pressure on the Galactic halo and the very active star formation near 30~Doradus. Star formation is probably also at the origin of the high H i velocity dispersions observed near the North-West end of the LMC bar and Constellation III (e.g. Efremov & Elmegreen 1998).
5.2 Comparison to Other Dwarf Irregulars
The optical and H i distributions of ESO 364-G029 are typical of those of a Magellanic dwarf galaxy: a prominent bar and a pronounced single spiral arm in the optical, an H i distribution extending to about 1.2 Holmberg radii and a kinematic center offset from the photometric center. Furthermore, our H i data suggest the presence of numerous shells and holes (see § 5.4).
The H i kinematic center of ESO 364-G029 is offset by a projected distance of kpc from the optical center (as derived from surface photometry). This offset is known to be present in other Magellanic-type systems (e.g. de Vaucouleurs & Freeman 1972) such as NGC~925, which has an offset of kpc (Pisano et al. 1998), and the LMC (see § 5.1). Additional features in the H i distribution have been detected in Magellanic dwarfs, such as loops surrounding the galaxy (NGC~4618; Bush & Wilcots 2004), external spurs or blobs (e.g. NGC~5169; Mühle et al. 2005; UGCA~98; Stil et al. 2005) and S-shaped distortions in the H i velocity field (e.g. NGC~4449; Hunter et al. 1998; DDO~43; Simpson et al. 2005). Such features, often associated with a recent or ongoing interaction, are not apparent in the H i distribution of ESO 364-G029. The origin of the third component identified in H i between the optical bar and one-arm spiral also remains unclear. Shell- and hole-like structures in the H i distribution, as observed in ESO 364-G029 (see § 5.4), are observed in practically all dwarfs. These structures are commonly thought to be the result of stellar winds and supernova explosions (e.g. Weaver et al. 1977; McCray & Kafatos 1987; Puche et al. 1992; Kim et al. 1999; but see also Rhode et al. 1999; Bureau & Carignan 2002; Dib & Burkert 2005).
We find no significant difference between the photometric and kinematic position angle of ESO 364-G029. Hunter et al. (2000) find a similar result in their H i study of UGC~199. Many other Magellanic dwarfs, however, show a significant disagreement between the morphological and kinematic axes, such as NGC~1156 (Hunter et al. 2002) and DDO~26 (Hunter & Wilcots 2002). DDO~43 even has a kinematic axis nearly perpendicular to its morphological axis (Simpson et al. 2005). Hunter et al. (2002) suggest that such apparent inconsistencies may be explained by the presence of an inclined bar.
The asymmetry we observe in the global H i profile of ESO 364-G029 is a common characteristic of Magellanic-type galaxies, often attributed to a recent or ongoing interaction. Bush & Wilcots (2004), for example, analyse the H i morphology of the interacting Magellanic spiral galaxies NGC~4618 and NGC~4625, particularly in relation to the interaction between them. Their H i observations show a loop-like structure around NGC~4618 (the most massive of the two), indicating that the outer gas of this galaxy is strongly perturbed by the recent interaction. NGC~4625 and the inner part of NGC~4618, however, appear unaffected by the interaction. They find an asymmetry ratio for the H i profile of NGC~4618 and for NGC~4625, where is defined as the ratio between the areas under the H i profile at velocities smaller and greater than the systemic velocity (Haynes et al. 1998). Using the same algorithm, we find an asymmetry ratio for ESO 364-G029, which is bracketed by the values for NGC~4618 and NGC~4625. However, a similar amount of asymmetry is detected in non-interacting Magellanic spirals (Wilcots & Prescott 2004); an asymmetry measurement alone cannot confirm or reject the hypothesis of a recent interaction.
ESO 364-G029 exhibits solid-body rotation at small radii, reaches its maximum rotational velocity of km s-1 at a projected distance of kpc from its center, and flattens out at large radii. This behaviour is similar to that of other Magellanic dwarfs, e.g. IC~10 ( km s-1 at 1 kpc; Wilcots & Miller 1998), DDO~43 ( km s-1 at 2 kpc; Simpson et al. 2005) and NGC~4618 ( km s-1 at 5 kpc; Bush & Wilcots 2004), though variations in these parameters clearly exist. The H i velocity dispersion of ESO 364-G029 is – km s-1 over most of the galaxy (Figure 10), which is very similar to that of other dwarfs. The Magellanic dwarfs mentioned above exhibit a somewhat higher velocity dispersion at several locations (including the bar), indicating recent or ongoing star formation. For ESO 364-G029, the largest velocity dispersion is reached over the optical bar and the third component, which also likely indicates recent star formation in these regions.
Doyle et al. (2005) present a search for optical counterparts of HIPASS sources. Out of the 3618 optical counterparts found, 151 are galaxies with morphological type IB(s)m, including ESO 364-G029. From their (total) H i fluxes and -band magnitudes we calculated the H i mass-to-blue-luminosity ratio for each galaxy. Magellanic dwarf irregular galaxies have a median value , with a standard deviation of . Thus, ESO 364-G029 (with ) is a fairly typical Magellanic dwarf galaxy in this respect as well.
5.3 Group Membership and Origin of the Asymmetries
Tidal interactions in disk galaxies are known to lead to strongly asymmetric spiral features (e.g. Byrd et al. 1986; Olson & Kwan 1990). The structure of M51-like systems, for example, is often explained by tidal interactions with a close neighbour (e.g. Howard & Byrd 1990; Howard et al. 1993; Salo & Laurikainen 2000). While this mechanism need not be unique, it is interesting to question whether the large-scale morphology of ESO 364-G029 is consistent with a (trans)formation through tidal interactions, or whether another mechanism needs to be invoked. Certainly, the break in ESO 364-G029’s light profile seen at is consistent with an interaction, since tidal features typically have sharp boundaries.
Tully (1988) lists ESO 364-G029 as being part of a small group of galaxies in the Dorado Cloud, which also includes NGC~2090 and NGC~2188. Table 4 lists all galaxies with a known redshift within a radius of of ESO 364-G029, and with a relative radial velocity less than km s-1, as found in NED. Only one additional galaxy is found, AM~0605-341, although a number of galaxies without redshift are also present in the region. There are thus a number of candidates for interaction with ESO 364-G029.
| Name | Type | ||||
|---|---|---|---|---|---|
| (mag) | (kpc) | (km s-1) | |||
| ESO 364-G029 | IB(s)m | — | — | — | |
| AM~0605-341 | SBdm | ||||
| NGC~2188 | SB(s)m | ||||
| NGC~2090 | SA(rs)b |
NGC~2090 is the least certain and most distant member of the group containing ESO 364-G029 (among the galaxies with a measured redshift). Its distance was measured using the Hubble Space Telescope (HST) and the Cepheid period-luminosity relation, yielding a distance of Mpc (random and systematic errors, respectively; Phelps et al. 1998). Although slightly higher, this is consistent within the errors with our adopted distance for ESO 364-G029, a comforting fact given that our estimate for ESO 364-G029 was itself higher than other published values (see § 4).
The edge-on galaxy NGC~2188 is rather peculiar, both the H i and H emission bending away from the disk, leading to a crescent shape not unlike that expected from ram pressure stripping (Domgörgen et al. 1996). The H i distribution is also highly asymmetric with respect to the equatorial plane. The velocity field shows many peculiarities, with apparent rotation about two axes. Although not bullet-proof evidence for interaction, these properties hint at least to a disturbed past. Given the large separation between ESO 364-G029 and NGC~2188, however, any interaction with ESO 364-G029 would have occurred a very long time ago ( Gyr for a relative velocity of km s-1). The evidence for a recent interaction involving ESO 364-G029 thus remains marginal.
5.4 H i Shells and Holes
Although the current observations are best suited to study the medium and large-scale structure of the H i, studies of the small-scale structure in the interstellar medium (ISM) are also of interest. In particular, the radiation and mechanical energy produced by stellar winds and supernova explosions are generally thought to give rise to a very dynamic multi-phase ISM, through the interacting and continually evolving cavities created. For recent work on the latter topic, see, e.g., Korpi et al. (1999) and de Avillez & Berry (2001). Such shells and holes have indeed been observed in nearby large spiral galaxies such as M31 (e.g. Brinks & Bajaja 1986) and M33 (Deul & den Hartog 1990). Dwarf galaxies are however better targets for studying these phenomena. The low gravitational potential well of dwarf galaxies, the lack of shear due to solid-body rotation and the absence of density waves all facilitate the expansion and survival of the shells created. Some of the best examples include the LMC (SB(s)m; Kim et al. 1998), IC~2574 (SAB(s)m; Walter & Brinks 1999) and Holmberg~II (Im; Puche et al. 1992; but see also Rhode et al. 1999; Bureau & Carignan 2002).
The channel maps of datacube UL (Figure 6) and the corresponding moment maps (Figures 8–10) of ESO 364-G029 reveal much small-scale structure, suggesting that expanding shells or holes may be present in ESO 364-G029. Most obvious are the two large H i gaps, the first one between the main bar and the so-called third component, centered at (, ; J2000), and the second one between the third component and the one-arm spiral, itself perhaps composed of two smaller holes centered respectively at (, ) and (, ). These holes raise the interesting possibility that the third component and the one-arm spiral may not be caused by large-scale dynamical processes, but may instead simply represent gas concentrations at the edges of large cavities, emptied by the supernova explosions and stellar winds associated with past bursts of star formation. Their optical counterparts would then trace the location of secondary (i.e. triggered and more recent) star formation.
Despite its relatively large distance, ESO 364-G029 is thus a prime target for studies of star formation feedback and self-propagating star formation. However, due to the short integrations with the 1.5D array and the shallowness of the high-resolution maps, it is hard to convincingly argue that any single structure is surely due to a (centrally-located) localized energetic phenomenon. Better quality maps and longer observations with km or longer arrays are necessary for a proper study of the small-scale structure of the ISM. As mentioned before, narrow-band H imaging would be useful to see how current and recent sites of star formation relate to the H i morphology and kinematics.
6 Summary and Conclusions
We presented the analysis of optical imaging observations and H i radio synthesis observations of the dwarf irregular galaxy ESO 364-G029. The optical imaging data reveal a morphology characteristic of Magellanic-type spirals and irregulars, with a large dominant bar and a one-sided spiral or tidal arm, although the absolute magnitude of ESO 364-G029 (for a distance Mpc) is more than a magnitude fainter than that of the LMC. While poorly-defined, the azimuthally-averaged surface brightness profiles show an exponential disk with a possible break at large radii and colors typical of late-type disk galaxies.
The radio synthesis observations reveal an H i disk extending well outside of the optical extent. The total H i mass is , yielding a (distance independent) H i mass-to-blue-luminosity ratio /, significantly more H i-rich than the LMC. The latter value is at the high end of the distribution for late-type spirals (Sc–Sd), but is typical of late-type dwarfs (Roberts & Haynes 1994; Swaters et al. 2002; Doyle et al. 2005). The large-scale H i distribution is also asymmetric and roughly follows the optical light distribution, although slightly offset from it. The H i distribution thus appears consistent with that expected from tidal interactions, but most evidence for a past encounter is circumstantial. Our highest spatial resolution maps show that the highest column densities and velocity dispersions are reached over the central bar, the one-arm spiral, and over a third component which also has an optical counterpart (at least partially). Despite a similar optical morphology, this is opposite to what is observed in the LMC, where the H i distribution bears little resemblance to that of the stars. The two galaxies may thus have formed differently, or may simply be in a different evolutionary stage. The rotation curve of ESO 364-G029 is solid-body over the optical extent but flattens out at large radii, reaching km s-1. The inclination remains poorly constrained by observations, but is consistent with the HyperLEDA value . Our high-resolution observations also hint at a complex H i structure, reminiscent of that expected from stellar winds and supernova explosions. Deeper and higher-resolution optical and H i observations, as well as H observations, are however necessary to properly characterize the small-scale H i morphology and kinematics, and to establish any relationship to star formation.
The observations presented in this paper provide important information on the large-scale optical and H i structure of ESO 364-G029, and provide a solid foundation for further investigation of its small-scale structure, particularly in H i with longer baseline observations. The ultimate goal is that studies of individual nearby Magellanic galaxies will yield information on their formation and evolution as a class, but will also strengthen our understanding of the LMC itself.
Acknowledgements.
It is a pleasure to thank Claude Carignan and Ken Freeman for their support in the initial phase of the work reported here. TK was supported by NWO under project number 614.041.006 and by PPARC under grant number PP/D002036/1. MB acknowledges support from NASA through Hubble Fellowship grant HST-HF-01136.01 awarded by Space Telescope Science Institute, which is operated by the Association of Universities for Research in Astronomy, Inc., for NASA, under contract NAS 5-26555, during much of this work. MB also acknowledges support from the Astrophysical Research Center for the Structure and Evolution of the Cosmos (ARCSEC) at Sejong University while this manuscript was prepared. SK was supported in part by Korea Science & Engineering Foundation (KOSEF) under a cooperative agreement with the Astrophysical Research Center of the Structure and Evolution of the Cosmos (ARCSEC). The NASA/IPAC Extragalactic Database (NED) is operated by the Jet Propulsion Laboratory, California Institute of Technology, under contract with the National Aeronautics and Space Administration. This research made use of HyperLEDA: http://leda.univ-lyon1.fr . The Digitized Sky Surveys were produced at the Space Telescope Science Institute under U.S. Government grant NAG W-2166. The images of these surveys are based on photographic data obtained using the Oschin Schmidt Telescope on Palomar Mountain and the UK Schmidt Telescope.References
- Aaronson et al. (1982) Aaronson, M., Huchra, J., Mould, J., Schechter, P. L., & Tully, R. B. 1982, ApJ, 258, 64
- de Avillez & Berry (2001) de Avillez, M. A., & Berry, D. L. 2001, MNRAS, 328, 708
- Barnes & de Blok (2001) Barnes, D. G., & de Blok, W. J. G. 2001, AJ, 122, 825
- Begeman (1987) Begeman, K. 1987, Ph.D. Thesis, Rijksuniversiteit Groningen
- Bekki & Chiba (2006) Bekki, K., & Chiba, M. 2006, astro-ph/0603812
- Bessell (1995) Bessell, M. S. 1995, PASP, 107, 672
- de Blok et al. (1996) de Blok, W. J. G., McGaugh, S. S., & van der Hulst, J. M. 1996, MNRAS, 283, 18
- Bottinelli et al. (1983) Bottinelli, L., Gouguenheim, L., Paturel, G., & de Vaucouleurs, G. 1983, A&A, 118, 4
- Brinks & Bajaja (1986) Brinks, E., & Bajaja, E. 1986, A&A, 169, 14
- Brüns et al. (2005) Brüns, C., et al. 2005, A&A, 432, 45
- Bureau & Carignan (2002) Bureau, M., & Carignan, C. 2002, AJ, 123, 1316
- Bureau et al. (2004) Bureau, M., Walter, F., van Gorkom, J., & Carignan, C. 2004, IAU Symposium, 217, 452
- Bush & Wilcots (2004) Bush, S. J., & Wilcots, E. M. 2004, AJ, 128, 2789
- Byrd et al. (1986) Byrd, G., Saarinen, S., & Valtonen, M. 1986, MNRAS, 220, 619
- Chiu et al. (2001) Chiu, W. A., Gnedin, N. Y., & Ostriker, J. P. 2001, ApJ, 563, 21
- Clark (1980) Clark, B. G. 1980, A&A, 89, 377
- Cole et al. (1994) Cole, S., Aragon-Salamanca, A., Frenk, C. S., Navarro, J. F., & Zepf, S. E. 1994, MNRAS, 271, 781
- Dekel & Silk (1986) Dekel, A., & Silk, J. 1986, ApJ, 303, 39
- Deul & den Hartog (1990) Deul, E. R., & den Hartog, R. H. 1990, A&A, 229, 362
- Dib & Burkert (2005) Dib, S., & Burkert, A. 2005, ApJ, 630, 238
- Dickey & Lockman (1990) Dickey, J. M., & Lockman, F. J. 1990, ARA&A, 28, 215
- Domgörgen et al. (1996) Domgörgen, H., Dahlem, M., & Dettmar, R.-J. 1996, A&A, 313, 96
- Doyle et al. (2005) Doyle, M. T., et al. 2005, MNRAS, 361, 34
- Driver (1999) Driver, S. P. 1999, ApJL, 526, 69
- Ebeling et al. (1998) Ebeling, H., Edge, A. C., Bohringer, H., et al. 1998, MNRAS, 301, 881
- Efremov & Elmegreen (1998) Efremov, Y. N., & Elmegreen, B. G. 1998, MNRAS, 299, 643
- Giovanelli et al. (1994) Giovanelli, R., Haynes, M. P., Salzer, J. J., Wegner, G., da Costa, L. N., & Freudling, W. 1994, AJ, 107, 2036
- Giuricin et al. (2000) Giuricin, G., Marinoni, C., Ceriani, L., & Pisani, A. 2000, ApJ, 543, 178
- Grenier et al. (2005) Grenier, I. A., Casandjian, J.-M., & Terrier, R. 2005, Science, 307, 1292
- Gooch (1995) Gooch, R. 1995, in Astronomical Data Analysis Software and Systems IV, eds. R. A. Shaw, H. E. Payne, & J. J. E. Hayes (San Francisco: ASP), 144
- Haynes et al. (1998) Haynes, M. P., van Zee, L., Hogg, D. E., Roberts, M. S., & Maddalena, R. J. 1998, AJ, 115, 62
- Holmberg (1946) Holmberg, E. 1946, Medd. Lund. Ast. Obs. Serie VI, 117
- Holmberg (1958) Holmberg, E. 1958, Medd. Lund. Ast. Obs. Serie II, 136, 1
- Holmberg et al. (1978) Holmberg, E. B., Lauberts, A., Schuster, H. E., & West, R. M. 1978, A&AS, 34, 285
- Howard & Byrd (1990) Howard, S., & Byrd, G. 1990, AJ, 99, 1798
- Howard et al. (1993) Howard, S., Keel, W. C., Byrd, G., & Burkey, J. 1993, ApJ, 417, 502
- Huchtmeier et al. (2001) Huchtmeier, W. K., Karachentsev, I. D., & Karachentseva, V. E. 2001, A&A, 377, 801
- van der Hulst et al. (1992) van der Hulst, J. M., Terlouw, J. P., Begeman, K. G., Zwitser, W., & Roelfsema, P. R. 1992, in Astronomical Data Analysis Software and Systems I, eds. D. M. Worrall, C. Biemesderfer, & J. Barnes (San Francisco: ASP), 131
- Hunter (1997) Hunter, D. A. 1997, PASP, 109, 937
- Hunter et al. (1998) Hunter, D. A., Wilcots, E. M., van Woerden, H., Gallagher, J. S., & Kohle, S. 1998, ApJ, 495, L47
- Hunter et al. (2000) Hunter, D. A., Walker, C. E., & Wilcots, E. M. 2000, AJ, 119, 668
- Hunter & Wilcots (2002) Hunter, D. A., & Wilcots, E. M. 2002, AJ, 123, 2449
- Hunter et al. (2002) Hunter, D. A., Rubin, V. C., Swaters, R. A., Sparke, L. S., & Levine, S. E. 2002, ApJ, 580, 194
- Im et al. (1999) Im, M., Griffiths, R. E., Naim, A., et al. 1999, ApJ, 510, 82
- Impey & Bothun (1997) Impey, C., & Bothun, G. 1997, ARA&A, 35, 267
- Jedrzejewski (1987) Jedrzejewski, R. I. 1987, MNRAS, 226, 747
- Karachentsev et al. (2004) Karachentsev, I. D., Karachentseva, V. E., Huchtmeier, W. K., & Makarov, D. I. 2004, AJ, 127, 2031
- Karachentseva & Karachentsev (2000) Karachentseva, V. E., & Karachentsev, I. D. 2000, A&AS, 146, 359
- Kharchenko (2001) Kharchenko, N. V. 2001, Kinematika Fiz. Nebesn. Tel., 17, 409
- Kauffmann et al. (1993) Kauffmann, G., White, S. D. M., & Guiderdoni, B. 1993, MNRAS, 264, 201
- Kelson et al. (2000) Kelson, D. D., Illingworth, G. D., Tonry, J. L., et al. 2000, ApJ, 529, 768
- Kim et al. (1998) Kim, S., Staveley-Smith, L., Dopita, M. A., et al. 1998, ApJ, 503, 674
- Kim et al. (1999) Kim, S., Dopita, M. A., Staveley-Smith, L., & Bessell, M. S. 1999, AJ, 118, 2797
- Kim et al. (2003) Kim, S., Staveley-Smith L., Dopita, M. A., et al. 2003, ApJS, 148, 473
- Koribalski et al. (2004) Koribalski, B. S., Staveley-Smith, L., Kilborn, V. A., et al. 2004, AJ, 128, 16
- Korpi et al. (1999) Korpi, M. J., Brandenburg, A., Shukurov, A., Tuominen, I., & Nordlund, Å. 1999, ApJ, 514, L99
- Landolt (1992) Landolt, A. U. 1992, AJ, 104, 372
- Lauberts & Valentijn (1989) Lauberts, A., & Valentijn, E. A. 1989, The Surface Photometry Catalogue of the Eso-Uppsala Galaxies (Garching bei Munchen: ESO )
- Longmore et al. (1982) Longmore, A. J., Hawarden, T. G., Goss, W. M., Mebold, U., & Webster, B. L. 1982, MNRAS, 200, 325
- van der Marel (2001) van der Marel, R. P. 2001, AJ, 122, 1827
- van der Marel & Cioni (2001) van der Marel, R. P., & Cioni, M.-R. L. 2001, AJ, 122, 1807
- van der Marel et al. (2002) van der Marel, R. P., Alves, D. R., Hardy, E., & Suntzeff, N. B. 2002, AJ, 124, 2639
- van der Marel (2006) van der Marel, R. P. 2006, The Local Group as an Astrophysical Laboratory, 47
- Mastropietro et al. (2005) Mastropietro, C., Moore, B., Mayer, L., Wadsley, J., & Stadel, J. 2005, MNRAS, 363, 509
- Mateo (1998) Mateo, M. L. 1998, ARA&A, 36, 435
- McCray & Kafatos (1987) McCray, R., & Kafatos, M. 1987, ApJ, 317, 190
- Meixner et al. (2006) Meixner, M., et al. 2006, AJ, 132, 2268
- Meyer et al. (2004) Meyer, M. J., Zwaan, M. A., Webster, R. L., et al. 2004, MNRAS, 350, 1195
- Mühle et al. (2005) Mühle, S., Klein, U., Wilcots, E. M., Hüttemeister, S. 2005, AJ, 130, 524
- Odewahn (1991) Odewahn, S. C. 1991, AJ, 101, 829
- Odewahn (1994) Odewahn, S. C. 1994, AJ, 107, 1320
- Olson & Kwan (1990) Olson, K. M., & Kwan, J. 1990, ApJ, 361, 426
- Olsen & Massey (2007) Olsen, K. A. G., & Massey, P. 2007, astro-ph/0701500
- Paturel et al. (2005) Paturel, G., Vauglin, I., Petit, C., Borsenberger, J., Epchtein, N., Fouqué, P., & Mamon, G. 2005, A&A, 430, 751
- Peebles (1976) Peebles, P. J. E. 1976, ApJ, 205, 318
- Phelps et al. (1998) Phelps, R. L., Sakai, S., Freedman, W. L., et al. 1998, ApJ, 500, 763
- Pisano et al. (1998) Pisano, D. J., Wilcots, E. M., & Elmegreen, B. G. 1998, AJ, 115, 975
- Pisano & Wilcots (2000) Pisano, D. J., & Wilcots, E. M. 2000, MNRAS, 319, 821
- Puche et al. (1992) Puche, D., Westpfahl, D., Brinks, E., & Roy, J.-R. 1992, AJ, 103, 1841
- Putman et al. (1998) Putman, M. E., et al. 1998, Nature, 394, 752
- Putman et al. (2003) Putman, M. E., Staveley-Smith, L., Freeman, K. C., Gibson, B. K., & Barnes, D. G. 2003, ApJ, 586, 170
- Reynolds (1994) Reynolds, J. 1994, ATNF Technical Document Series 39.3040
- Richter & Sancisi (1994) Richter, O.-G., & Sancisi, R. 1994, A&A, 290, L9
- Roberts & Haynes (1994) Roberts, M. S., & Haynes, M. P. 1994, ARA&A, 32, 115
- Rhode et al. (1999) Rhode, K. L., Salzer, J. J., Westpfahl, D. J., & Radice, L. A. 1999, AJ, 118, 323
- Salo & Laurikainen (2000) Salo, H., & Laurikainen, E. 2000, MNRAS, 319, 377
- Sault et al. (1995) Sault, R. J., Teuben, P. J., & Wright, M. C. H. 1995, in Astronomical Data Analysis Software and Systems IV, eds. R. A. Shaw, H. E. Payne, & J. J. E. Hayes (San Francisco: ASP), 433
- Schechter (1980) Schechter, P. L. 1980, AJ, 85, 801
- Schlegel et al. (1998) Schlegel, D. J., Finkbeiner, D. P., & Davis, M. 1998, ApJ, 500, 525
- Schoenmakers et al. (1997) Schoenmakers, R. H. M., Franx, M., & de Zeeuw, P. T. 1997, MNRAS, 292, 349
- Simpson et al. (2005) Simpson, C. E., Hunter, D. A., & Nordgren, T. E. 2005, AJ, 130, 1049
- Staveley-Smith et al. (2003) Staveley-Smith, L., Kim, S., Calabretta, M. R., Haynes, R. F., & Kesteven, M. J. 2003, MNRAS, 339, 87
- Stil et al. (2005) Stil, J. M., Gray, A. D., & Harnett, J. I. 2005, ApJ, 625, 130
- Swaters (1999) Swaters, R. A. 1999, Ph.D. Thesis, Rijksuniversiteit Groningen
- Swaters et al. (2002) Swaters, R. A., van Albada, T. S., van der Hulst, J. M., & Sancisi, R. 2002, A&A, 390, 829
- Thurow & Wilcots (2005) Thurow, J. C., & Wilcots, E. M. 2005, AJ, 129, 745
- Tody (1986) Tody, D. 1986, Proc. SPIE, 627, 733
- Tody (1993) Tody, D. 1993, in Astronomical Data Analysis Software and Systems II, eds. J. Hanisch, R. J. V. Brissenden, & J. Barnes (San Francisco: ASP), 173
- Tully (1988) Tully, R. B. 1988, Nearby Galaxies Catalog (Cambridge University Press)
- de Vaucouleurs (1955) de Vaucouleurs, G. 1955, AJ, 60, 126
- de Vaucouleurs (1956) de Vaucouleurs, G. 1956, Memoirs Mt. Stromlo Obs., III, 13
- de Vaucouleurs (1959) de Vaucouleurs, G. 1959, Classification and Morphology of External Galaxies, in Hand. d. Phys. (Springer-Verlag: Berlin-Göttingen), 53, 275
- de Vaucouleurs & Freeman (1972) de Vaucouleurs, G., & Freeman, K. C. 1972, Vistas in Astronomy, 14, 163
- RC3 (1991) de Vaucouleurs, G., de Vaucouleurs, A., Corwin, H. G. Jr., et al. 1991, Third Reference Catalogue of Bright Galaxies (Springer-Verlag: Berlin)
- Vogelaar & Terlouw (2001) Vogelaar, M. G. R., & Terlouw, J. P. 2001, in Astronomical Data Analysis Software and Systems X, eds. F. R. Harnden, Jr., F. A. Primini, & H. E. Payne (San Francisco: ASP), 358
- Walter & Brinks (1999) Walter, F., & Brinks, E. 1999, AJ, 118, 273
- Weaver et al. (1977) Weaver, R., McCray, R., Castor, J., Shapiro, P., & Moore, R. 1977, ApJ, 218, 377
- Weinberg & Nikolaev (2001) Weinberg, M. D., & Nikolaev, S. 2001, ApJ, 548, 712
- Westerlund (1997) Westerlund, B. E. 1997, The Magellanic Clouds (Cambridge: CUP)
- White & Frenk (1991) White, S. D. M., & Frenk, C. S. 1991, ApJ, 379, 52
- Wilcots & Miller (1998) Wilcots, E. M., & Miller, B. W. 1998, AJ, 116, 2363
- Wilcots & Thurow (2001) Wilcots, E. M., & Thurow, J. C. 2001, ApJ, 555, 758
- Wilcots & Prescott (2004) Wilcots, E. M., & Prescott, M. K. M. 2004, AJ, 127, 1900
- Zimmermann et al. (2001) Zimmermann, H.-U., Boller, T., Döbereiner, S., & Pietsch, W. 2001, A&A, 378, 30