The Star-forming Region NGC 346 in the Small Magellanic Cloud with Hubble Space Telescope ACS Observations. II. Photometric Study of the Intermediate-Age Star Cluster BS 90111Research supported by the Deutsche Forschungsgemeinschaft (German Research Foundation)
Abstract
We present the results of our investigation of the intermediate-age star cluster BS 90, located in the vicinity of the H ii region N 66 in the SMC, observed with HST/ACS. The high-resolution data provide a unique opportunity for a very detailed photometric study performed on one of the rare intermediate-age rich SMC clusters. The complete set of observations is centered on the association NGC 346 and contains almost 100,000 stars down to mag. In this study we focus on the northern part of the region, which covers almost the whole stellar content of BS 90. We construct its stellar surface density profile and derive structural parameters. Isochrone fits on the CMD of the cluster results in an age of about Gyr. The luminosity function is constructed and the present-day mass function of BS 90 has been obtained using the mass-luminosity relation, derived from the isochrone models. We found a slope between and , comparable or somewhat shallower than a typical Salpeter IMF. Examination of the radial dependence of the mass function shows a steeper slope at larger radial distances, indicating mass segregation in the cluster. The derived half-mass relaxation time of Gyr suggests that the cluster is mass segregated due to its dynamical evolution. From the isochrone model fits we derive a metallicity for BS 90 of , which adds an important point to the age-metallicity relation of the SMC. We discuss our findings on this relation in comparison to other SMC clusters.
Subject headings:
Hertzsprung-Russell diagram — Magellanic Clouds — stars: evolution — clusters: individual ([BS95] 90)1. Introduction
Studies of star clusters, covering a wide range of ages, metallicities and environments offer the opportunity to investigate the evolution of individual clusters, but also of the entire parent galaxy, e.g. its star formation history and chemical enrichment. The clusters of the Large and Small Magellanic Cloud (LMC, SMC) are excellent targets for such studies. Their proximity allows to resolve individual members of a stellar system and to assume that all stars of a star cluster are more or less located at the same distance. Studies of cluster systems of both the LMC and SMC provide the opportunity to test theories of stellar evolution for different ages, abundances and/or mass content in an environment different than the Milky Way. Star clusters of the Magellanic Clouds (MCs) have ages varying from the early stages of the clouds up to the present, therefore allowing the study of the evolution of the clouds from the time they have been formed until today.
The history of cluster formation in the SMC is the topic of ongoing discussion. Although the cluster population has been considered as having a continuous age distribution (Da Costa & Hatzidimitriou 1998; Mighell et al. 1998), some studies suggest that most of the SMC clusters have been formed in two epochs. Rich et al. (2000) found seven populous SMC star clusters being formed either around Gyr or around Gyr ago. Rafelski & Zaritsky (2005) further argue that the cluster age distribution shows few peaks, but no evidence for a significant age gap in the SMC as observed in the LMC (van den Bergh 1991; Da Costa 1991; Westerlund 1997). They suggest that the dominant initial epoch of cluster formation together with a fast dissolution of clusters makes the age distribution of the SMC clusters to appear with a quiescent cluster formation period in the intermediate-age range. Consequently, the intermediate-age range in the SMC is sparsely populated.
The low number of intermediate-age SMC clusters makes it difficult to establish a consistent model for its chemical enrichment history. Pagel & Tautvaišiené (1998) published two models to explain the enrichment of the cluster population of both the SMC and LMC. Their work includes a ‘bursting’ model of star formation and a model with ‘smooth’ star formation. For the latter, a constant star formation rate is assumed over the entire lifetime of the clouds. It is comparable to a model, which has been previously published by Da Costa & Hatzidimitriou (1998). The bursting model assumes a constant star formation rate over a certain time interval with a discontinuous change between two bursts. Pagel & Tautvaišiené (1998) included two bursts for the SMC, one at the time of its formation and the second at Gyr ago. Ages and metallicities of the cluster population have been examined with photometric analyses (e.g. Mighell et al. 1998; Piatti et al. 2001, 2005a) or via spectroscopy (e.g. Da Costa & Hatzidimitriou 1998; de Freitas Pacheco et al. 1998; Piatti et al. 2005b). Results of this studies are not providing a clear picture of the chemical enrichment of the SMC. As an example, results from Mighell et al. (1998) are in better agreement with the burst model of Pagel & Tautvaišiené (1998), whereas Da Costa & Hatzidimitriou (1998) pointed out that their findings are consistent with a more continuous chemical evolution following a simple ‘closed-box’ model for the SMC, but they also mentioned that it may be an ‘open’ rather than a closed box due to its interaction with the LMC and the Galaxy. Naturally, the further investigation of intermediate-age star clusters would help to clarify the history of the cluster population of the SMC.
Recent high-resolution imaging with the Advanced Camera for Surveys (ACS) on-board the Hubble Space Telescope (HST) of the general area of the stellar association NGC 346 in the SMC includes the intermediate-age star cluster BS[95] 90 (Bica & Schmitt 1995) or in short BS 90, providing, thus, a unique opportunity to study one of the very rare star clusters, which has been formed in a possible quiescent epoch of star formation in the SMC. Such high-resolution studies are quite rare. The catalog of SMC clusters imaged with the Wide-Field Planetary Camera 2 on-board HST, presented by Mackey & Gilmore (2003b), includes only 10 clusters, seven of which have ages between 12 Gyr and 1.4 Gyr. The study we present here on the cluster BS 90 is based on a unique set of deep observations toward a SMC cluster with the high resolving power of HST/ACS. BS 90 is located in the vicinity of the stellar association NGC 346, the largest stellar concentration in the SMC, which is related to LHA 115-N 66 (in short N 66), the brightest H ii region of the galaxy (Henize 1956). NGC 346 has been subject of several studies. Peimbert et al. (2000) studied the chemical composition of the region. High-sensitivity CO and H2 observations and imaging in [O iii] of the photodissociation region is presented by Rubio et al. (2000). The X-ray emission in the general area has been studied by Nazé et al. (2003, 2004). Finally, a snapshot of the star formation history of the entire region is recently presented by Sabbi et al. (2007).
In the first paper of our investigation of the region of NGC 346 with HST/ACS observations (Gouliermis et al. 2006, from here-on Paper I) we present our photometry and the spatial distribution of different stellar populations in the whole region, revealing the stellar richness of the cluster BS 90. Our photometry allowed to resolve stars down to mag ( mag below the turn-off), corresponding to . Naturally, the inclusion of BS 90 in this data set offers the opportunity for a detailed analysis of this unique cluster using one of the richest stellar samples in the SMC. Here, we present our results of such an analysis. The structure of the paper is the following. In § 2 we discuss the data set and the data reduction. The construction and analysis of the stellar surface density of the cluster is presented in § 3. In § 4 the color-magnitude diagram (CMD) of BS 90 is constructed and its properties are derived by isochrone fitting. In § 5 the luminosity and mass functions of the cluster are constructed and presented, and we investigate the radial dependence of the mass function to examine a possible mass segregation in § 6. We discuss our findings concerning the age and metallicity of BS 90 in terms of the chemical enrichment history of SMC in § 7. Finally, in § 8 we summarize our investigation of this unique SMC cluster.

2. Data Description and Analysis
The data we use in this study are collected within the HST Program GO-10248. Three pointings were observed using the Wide-Field Channel (WFC) of ACS, centered on the association NGC 346, in the broad-band filters and , equivalent to standard and respectively. The data sets are retrieved from the HST Data Archive. Photometry of the pipeline-reduced FITS files was performed using the ACS module of the package DOLPHOT (version 1.0). This mode of the package is an adaption of HSTphot (Dolphin 2000), especially designed for photometry on ACS imaging. With our photometry we detected almost 100,000 stars. A detailed description of the datasets and a full account of the photometric process is given in Paper I, where we also made the whole photometric stellar catalog available.
This catalog lists the celestial coordinates, and - and -magnitudes (in the Vega system) with the corresponding photometric errors for each star. Typical photometric uncertainties as a function of the magnitude are shown in Paper I (Figure 2). The completeness of the data has been calculated by running DOLPHOT in artificial-star mode as described in Paper I, and artificial star lists were created with the utility acsfakelist. Completeness depends on the level of crowding, and, consequently, in a populous compact cluster like BS 90 it should vary with respect to the distance from the center of the cluster, where crowding is higher. Indeed, the completeness in the area of BS 90 is found to be spatially variable. This is seen in Fig. 1, where the completeness function in and (with the completeness factors estimated as a function of magnitude as ) is shown for different selected distances from the center of the cluster.
3. Dynamical Behavior of the Cluster
3.1. Stellar Surface Density Profile of BS 90
The observed field covers a quite large area around BS 90, allowing the construction of the stellar surface density profile of the cluster at relatively large distances from its center. We divided the area of the cluster in 30 concentric annuli with steps of and we counted the number of stars within each annulus. We corrected the counted stellar numbers for incompleteness according to the corresponding completeness factors. Completeness is a function of both distance from the center of the cluster and magnitude. If is the number of detected stars in the -band within the annulus and in the brightness range corresponding to the completeness factor , the completeness corrected number of stars is
| (1) |
We obtained the stellar surface density, , by normalizing this number to the area of the corresponding annulus as , with being the area of the annulus. The observed field-of-view does not fully cover the northern and western extend of the cluster, and, therefore, for the annuli not completely observed, we considered only the available area for the estimation of the corresponding surface.
The constructed stellar surface density profile is shown in Fig. 2. The errors correspond to uncertainties due to the counting process and they represent the Poisson statistics. As expected, this density profile shows a smooth drop as a function of distance from the center of the cluster. It drops to a uniform level, with the exception of the small increase at the distance around . We identify this increase as a small young cluster located east of BS 90. The horizontal uniform level represents the stellar density of the field of the galaxy. Its value is shown as the solid line in Fig. 2 and has been measured by fitting the models of Elson, Fall & Freeman (1987) to the stellar surface density profile as shown below.

3.2. Structural Parameters
We applied both the empirical model by King (1962) and the model of Elson, Fall & Freeman (1987; from here-on EFF) to the stellar surface density profile of BS 90 in order to obtain its structural parameters. The EFF model is suited for clusters without tidal truncation, while King’s empirical model represents a tidally truncated cluster. Both models provide the opportunity to derive accurate characteristic radii for the cluster, such as its core and tidal radius. The core radius () describes the distance from the center of the cluster where the stellar density drops to the half of its central value and the tidal radius () is the limit where the density drops to zero. For the application of King’s model the stellar surface density of the cluster alone (with no contamination from the field) is necessary, while the EFF model does not require any field subtraction. We first apply the latter in order to estimate the core radius and the uniform background level. The subtraction of this density level from the measured surface density at each annulus gives the surface density profile of the cluster alone, from which we derive the core and tidal radii.
3.2.1 Best Fitting EFF Profile
From studies of young LMC clusters by EFF it appears that the examined clusters are not tidally truncated. These authors developed a model more suitable to describe the stellar surface density profile of such clusters:
| (2) |
where is the central stellar surface density, is a measure of the core radius and is the power-law slope which describes the decrease of surface density of the cluster at large radii ( for ). represents the uniform background density level. Our best fit of the EFF model to the surface density profile of BS 90 gives pc and . The density of the background field, taken from the fitting procedure, corresponds to a value of . According to EFF model, the core radius, , is given from Eq. 2 assuming no contribution from the field as:
| (3) |
We estimate a core radius of pc. The best-fitting EFF model assuming the derived values of is shown superimposed on the stellar surface density profile in Fig. 3.

3.2.2 Best fitting King Profile
In order to have the density profile of the cluster alone we subtracted the background density level of , estimated above, from the profile of Fig. 2. Then we use the field-subtracted profile to derive the core and tidal radius of the cluster as described by King (1962). Specifically according to this model the core radius is found from the formula
| (4) |
which describes the inner region of the cluster and the tidal radius from
| (5) |
which represents the outskirts of the cluster. describes again the central surface density of the cluster and is a constant. The best fitting profile results in a tidal radius pc () and a core radius pc (). The concentration parameter, , is defined as the logarithmic ratio of tidal to core radius and refers to the compactness of the cluster. We obtained a concentration parameter . According to King’s model the density profile of a tidally truncated cluster is given as:
| (6) |
where is the stellar surface density, and the core and tidal radius, respectively and is the distance from the center. The best fitting King model is shown as the dashed line, superimposed on the radial surface density profile in Fig. 3.
Both King and EFF models are in good agreement to each other. The intermediate region is equally well fitted by both models. Based on the accuracy of the fits, it can be concluded that the EFF model is in better agreement with our data in the inner part of the cluster but for the intermediate and outer regions of the cluster the best fits yield no preference for the tidally truncated King model or the EFF model.
3.2.3 Core Radius-Age Relation of SMC clusters
A comparison of 10 SMC clusters, investigated by Mackey & Gilmore (2003b), shows that they can be divided into two groups with respect to their core radii, as they are derived from the EFF model. One group contains six star clusters (NGC 176, 330, 121, 411, 416, 458) with radii less than pc and the second group includes the remaining four clusters (NGC 361, 152, 339, Kron 3) with pc. BS 90 with its core radius of pc, as found from EFF models, would be a member of the second group. Mackey & Gilmore examined the relationship between the core radii and the ages of clusters located in the LMC, SMC, Fornax and Sagittarius dwarf spheroidals (see Mackey & Gilmore 2003a,b,c), and in Fig. 4 the core radius-age relationship for the SMC cluster sample is shown with our measurements for BS 90. The distinction of the clusters into the two groups according to their core radii is easily seen in this plot. For the LMC and the Fornax and Sagittarius dwarf spheroidals they observed a similar distinction and argued that it shows a real evolution of cluster structure with age (Mackey & Gilmore 2003a,c), with the sequence of clusters with smaller core radii following the ‘standard’ isolated globular cluster evolution. These authors suggest that the evolution of clusters at the upper right of Fig. 4, where BS 90 belongs to, differ from this isolated evolution. The disparity could be due to very different stellar populations in these clusters or because they do not follow an isolated evolution, but rather an evolution influenced by external processes.

McLaughlin & van der Marel (2005) also derived core and tidal radii with the application of King empirical models and the same separation of the clusters into the two groups according to their core radii was observed in their sample. Our application of King empirical models yields a core radius of pc and a tidal radius of pc, making BS 90 also a member of to the second group of the McLaughlin & van der Marel sample of clusters. Our estimated concentration parameter for BS 90 is relatively low in comparison to the SMC clusters studied by Mackey & Gilmore (2003b) and McLaughlin & van der Marel (2005).
3.2.4 Half-Light Radius
The half-light radius of the cluster is derived from its surface brightness profile. It corresponds more or less to the half-mass radius and the corresponding half-mass relaxation time (§ 6.1) is a useful reference time for the dynamical evolution of the cluster as a whole (Spitzer 1987). To construct the surface brightness profile we subdivided the area of the cluster into 26 annuli. The first 22 annuli were selected in steps of and the remaining four in steps of . We changed the width of the annuli to improve the statistics in the outer regions of the cluster. We converted the measured apparent magnitudes into flux and counted the brightness of the stars within each annulus. The total brightness of each annulus has been corrected for incompleteness and normalized to the corresponding area. From our fit of the profile with the EFF model we derived the total brightness of the entire cluster and further obtained its half-light radius. We found a half-light radius of pc.
4. Color-Magnitude diagram
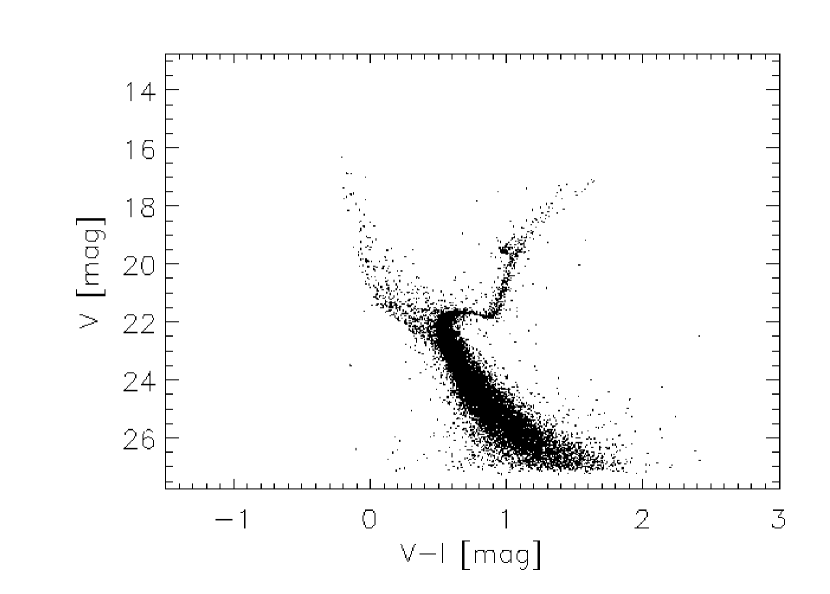
The vs. color-magnitude diagram (CMD) of all stars detected within a circular area of two core radii around the center of the cluster is shown in Fig. 5. A comparison of the contour maps of the region around NGC 346, constructed with star counts in Paper I, shows that the main body of the cluster covers well the northern part of the observed field-of-view (Paper I, Figure 4). Our selected radius of 2 around the center of BS 90 corresponds to pc and is comparable to the half-light radius of pc. It contains more than 40% of the total number of observed stars and more than 60% of the observed cluster population. The CMD of Fig. 5 is indicative of an old cluster with a clear turn-off at mag and mag, a well defined sub-giant branch between mag and mag, a red giant branch between mag and mag and a populated red clump at mag and mag. The CMD naturally includes also field stars and stars of the nearby young association NGC 346 (see also Paper I). Part of the latter is visible for instance as the population of the upper main sequence.
4.1. Subtraction of Contaminating Stars
In order to have a ‘clean’ CMD, composed only by stars of the cluster, a subtraction of all contaminating populations is necessary. Therefore we applied a Monte Carlo subtraction method to clean the diagram from stars, that belong to the field and the association.
Naturally, this subtraction might depend on the area chosen to be field. Considering that the observed field-of-view (FoV) is no more than in size, and that the association NGC 346 itself also contaminates the stellar population of BS 90, we tested several “empty” areas within the FoV, which also include stars from the association, as potential fields, in order to determine the most realistic stellar numbers that should be reduced from the CMD of BS 90. As a reference for the stellar contamination we selected an area of in the south of BS 90 with its center away from the center of the cluster. It contains stars of the association, of the general field and also few stars of the cluster itself. The number of stars that belong to the cluster is negligible at distances of from its center, because the stellar surface density has almost dropped to the background level of the field at this distance (see Fig. 2). We made the assumption that the selected area contains only field stars and stars of the association and not stars of BS 90. This leads to a small overestimation of the number of stars to be subtracted and causes a slightly higher number of subtractions in the area of the sub-giant branch and the main sequence.
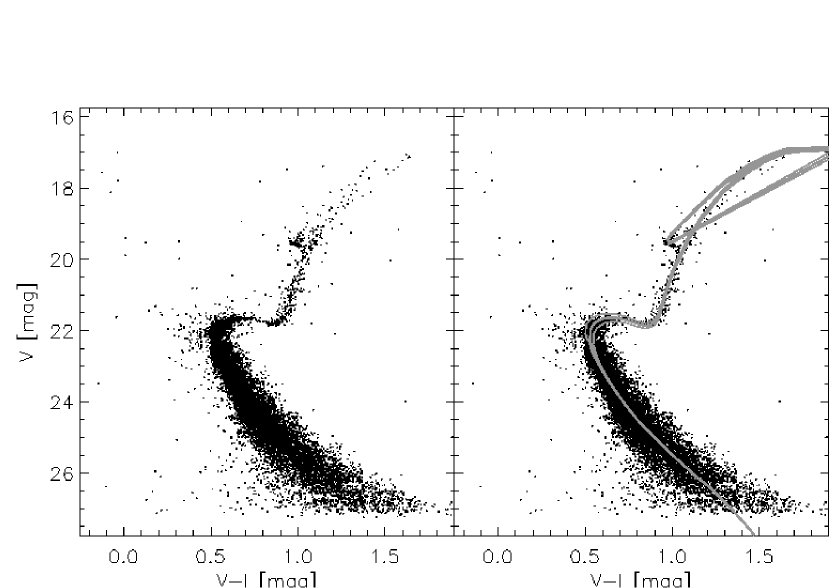
We divided the CMD into a grid and counted the numbers of stars in each grid element of the CMD of the reference field. Considering that the field-subtraction might also depend on the size of the elements, we tested the Monte Carlo subtraction for different grid element sizes, and we found that a size of 0.125 mag is the most suitable. Smaller element sizes produce poor number statistics, while larger sizes result to rough field-subtracted CMDs. Furthermore, we considered the different completeness of the two regions by correcting the corresponding stellar numbers for every field. Finally, we normalized the stellar numbers to the selected area of the cluster. The resulting number of stars which contaminates the CMD of BS 90 has been removed. The stars which have been excluded have been randomly selected from the corresponding bin of the original CMD of Fig. 5. The derived ‘clean’ CMD of BS 90, with no contamination by other stellar populations is shown in Fig. 6.
4.2. The CMD of the Cluster
The CMD of Fig. 6 (left), which corresponds to the CMD of the star cluster BS 90 alone shows features of a bona-fide intermediate-age cluster. The diagram reveals a well populated faint main sequence, as well as a clear turn-off. Well-defined features are also the sub-giant branch (SGB), the red giant branch (RGB) and the red clump (RC). The asymptotic giant branch is sparsely populated. These clear characteristics of the cluster allow isochrones to be easily used in order to define several properties of BS 90. Specifically the SGB, the RGB and the RC show no significant differential reddening, which makes the application straightforward. We used isochrone models calculated by the Padova Group (Girardi et al. 2002) in the VEGA filter system for ACS filters.
The best fitting isochrones are shown in the right panel of Fig. 6 superimposed on the CMD. The chosen isochrone fits very well the turn-off, RC, SGB and RGB. These well-defined features of BS 90 allow us to make an accurate estimation of the characteristic properties of the cluster:
-
(i)
Age and Metallicity
The best-fitting isochrones from the used model grid give an age of Gyr and a metallicity of . This metallicity leads through the relation (Bertelli et al. 1994) to an iron content for BS 90 of . -
(ii)
Reddening and Distance
From our isochrone fit we found a color excess of only mag. Using the relation between the extinction in , , and the color excess , derived by Mackey & Gilmore (2003c), we obtained a total visual extinction of mag. We assumed a normal extinction law with a total-to-selective absorption of (Binney & Merrifield 1998), which gives mag.The distance modulus of BS 90 has been determined to mag, which corresponds to a distance of kpc.

4.2.1 Blue Straggler Candidates
As shown in the CMD of Fig. 6, after the field subtraction there are still few stars which remain located a bit above the turn-off and to the blue. These stars appear to be main sequence stars with masses larger than expected for stars of the cluster at its turn-off age. The region of the CMD covered by these stars is between and mag, comparable to the region on the CMD, where blue straggler stars are found in the LMC cluster ESO 121-SC03 (Mackey, Payne & Gilmore 2006). The spatial distribution of these candidate blue stragglers in BS 90 shows that they are concentrated in the center of the cluster. This supports the suggestion that these stars represent indeed a blue straggler population, since such stars are centrally concentrated. A suggested explanation for the Blue Stragglers phenomenon is mass exchange in binary systems and merging processes, which increase the mass of one star and, therefore, it shines brighter and is bluer than expected for its age.
5. Luminosity Function and Mass Function
5.1. Luminosity Function
We constructed the - and -band luminosity functions (LF) of the cluster, which are presented in Fig. 7. For the construction of the LF we considered the CMD of the cluster shown in Fig. 6, without the contamination by the populations of the association and the background field within a radius from the center of the cluster (comparable to ). We counted the stars in magnitude bins of mag and corrected the numbers for incompleteness. The LF has been normalized to the considered surface of . The completeness corrected LF is shown with thick solid lines. The vertical dotted lines in Fig. 7, which correspond to mag and mag respectively, represent the 50% completeness limit. The vertical dashed-dotted line at mag and mag respectively corresponds to the 70% completeness limit. The dashed line shows the LF before the completeness correction.
In the LFs of Fig. 7 different features of the cluster can be clearly identified. The red clump is visible as the increase in stellar density around mag. The turn-off is also distinguishable at mag. For fainter stars the LF turns into a linearly increasing function, showing the main sequence stars of the cluster. In the case of the -LF we observe similar features. Around mag we identify the red clump and we see the turn-off at mag. For stars with mag the linear increase of the LF is steeper than for mag. The latter range is composed of stars of the main sequence.
5.2. Mass Function
The IMF is a function which describes the mass distribution of a newly formed stellar population. The stellar mass function is changed under the influence of stellar, as well as dynamical evolution that affects entire stellar systems such as star clusters (Baumgardt & Makino 2003). The present-day mass function (PDMF) is the result of such evolutionary effects. In general, the IMF can be described as a power law (Scalo 1986):
| (7) |
and represents the distribution of stellar masses for a given stellar system at the time of their formation. The index is its power-law slope
| (8) |
Salpeter (1955) found a value for the slope of the IMF in the solar neighborhood, often taken as a reference, of . In the same manner as for the IMF, we describe the slope of the PDMF as
| (9) |
where is the PDMF. This slope is given by the linear relation between the logarithmic mass intervals and the corresponding number of stars (in logarithmic scale). In order to obtain the PDMF of a cluster, knowledge of the mass-luminosity relation (MLR) is required. In the case of BS 90, and since a single age model fits almost perfectly the cluster, we used the MLR taken from the 4.5 Gyr isochrone from Girardi et al. (2002) and ascribed the present mass to each star which belongs to our stellar sample of the cluster. To construct the PDMF of BS 90, we counted stars in logarithmic mass intervals and normalized their numbers to the considered area. We corrected these numbers for incompleteness.
The constructed PDMF is shown in Fig. 8, where an almost linear increase to lower masses can be seen. The low- and high-mass ends of the PDMF show a steep increase and decrease respectively. In the case of the low-mass end this is probably due to the completeness corrections, while for the high-mass end stellar evolution is possibly responsible. The 50% completeness limit corresponds to a mass of and is represented by the vertical dash-dotted line. The 70% completeness limit is shown with a vertical dotted line and represents a lower mass limit of . The straight solid line shows the fit to the mass function above the 50% completeness limit, without the two highest mass points. The fit gives a single power-law slope of , a bit flatter than Salpeter’s IMF, whereas the fit to the mass function above the 70% completeness limit reveals a Salpeter-like slope of . It is represented by the dashed line.
Kroupa (2002) notes that theoretical examinations of the dynamics of massive and long-lived globular clusters ( stars) reveal that the global PDMF is similar to the PDMF at distances near the half-mass radius. The PDMF inward and outward the half-mass radius becomes flatter and steeper, respectively, due to dynamical mass segregation. Dynamical evolution of a cluster also flattens the global PDMF, since evaporation is stronger for stars with lower masses than for high-mass stars (Vesperini & Heggie 1997).

6. Mass segregation in BS 90
The phenomenon of mass segregation describes the concentration of high-mass stars towards the center of a star cluster. This phenomenon could be either of primordial origin or the result of the dynamical evolution of the cluster. The latter effect leads the cluster to a state of energy equipartition between its stars. Therefore, stars with lower masses will have higher velocities and thus larger orbits. On the other hand, stars with higher masses have smaller orbits and concentrate towards the center. Indeed, stellar mass functions (MFs) at the outer parts of star clusters indicate the existence of more low-mass stars at larger radii than in the central region of the cluster (de Grijs et al. 2002). A powerful diagnostic for the detection of the phenomenon of mass segregation in a star cluster is its MF, which is expected to be radially variable if segregation is present (e.g. Gouliermis et al. 2004). Therefore, in order to see if BS 90 is mass segregated or not, we derived its MF for annuli at different radial distances from the center of the cluster. We derived the different MFs as described in § 5.2 for four selected radial distances , , and . The resulting MFs are shown in Fig. 9. The MF of the innermost region has a slope of . The MF of the second annulus, which includes the half-light radius, is comparable to the MF inside shown in Fig. 8 and has a slope of . The slopes of the outer regions are found to be steeper with for and for . The difference of the MF slope being steeper outwards, gives clear evidence of mass segregation in BS 90. In the following section, we will explore the driving mechanism of this phenomenon.

6.1. Half-Mass Radius and Dynamical Time-Scale
As mentioned above, the phenomenon of mass segregation may be primordial, due to the formation of the most massive stars in the central regions of the cluster, or an evolutionary effect due to the dynamical relaxation of the cluster. The latter is achieved via two-body encounters, which lead to a quasi-Maxwellian equilibrium in the interior of the cluster (Lightman & Shapiro 1978). The tendency of the inner regions of the cluster to reach thermal equilibrium leads to energy equipartition among different stellar mass groups and consequently to mass stratification. The time-scale in which such equipartition is accomplished is given roughly by the relaxation time, , of the cluster (e.g. Spitzer 1975). Hence, the relaxation time can indicate whether a case of mass segregation is of dynamical origin (when the evolution time of the stellar system is longer than the relaxation time) or not. This time-scale can be expressed as (Binney & Tremaine 1987):
| (10) |
where is the total mass in a certain characteristic radius , is a characteristic mass (median mass of the observed stellar distribution) and is the corresponding number of stars of the system. The half-mass radius corresponds more or less to the half-light radius of the cluster. The half-light radius of BS 90 derived from its surface brightness profile (§ 3.2.4) is found to be equal to pc. Following Eq. 10, we derive the relaxation times, corresponding to the half-light and core radii, after we estimated the corresponding total and characteristic mass and the total number of stars within these radii. We found a half-mass relaxation time of Gyr and a core radius relaxation time of Gyr. From these timescales, which are much smaller than the evolutionary age of the cluster, we easily conclude that BS 90 is a dynamically relaxed spherical cluster, which thus exhibits the phenomenon of dynamical mass segregation.
7. Chemical Evolution History of the SMC
The chemical evolution history of a galaxy is understood in terms of the age-metallicity relation of both field and cluster stars. The chemical evolution histories in the MCs exhibit distinct features in comparison to this of the disc of the Milky Way (Westerlund 1997). Several models have been developed for their explanation, assuming bursts with IMFs steeper than Salpeter’s IMF to produce subsolar metallicities (e.g. Russell & Dopita 1992; Tsujimoto et al. 1995), or postulating selective stellar outflows associated with star formation bursts (e.g. Pilyugin 1996). In contrast, the model of chemical evolution for the MCs developed by Pagel & Tautvaišiené (1998) assumes that the Clouds have been built up by gradual infall of unprocessed material, linear laws of star formation, yields and time delays identical to those for the solar neighborhood, and a non-selective wind proportional to the star formation rate. These models represent chemical enrichment assuming a burst-like star formation (‘bursting’ model) and a continuous star formation rate over the entire lifetime of the SMC (‘smooth’, or simple ‘closed box’ model).
| Name | RA | DEC | Age | Metal. | References | ||||
|---|---|---|---|---|---|---|---|---|---|
| J2000 | (Gyr) | + | [Fe/H] | + | |||||
| NGC 121 | 00:26:49 | 71:32:10 | 12.00 | 2.00 | 2.00 | 1.19 | 0.12 | 0.12 | Da Costa & Hatzidimitriou (1998) |
| 11.90 | 1.30 | 1.30 | 1.71 | 0.10 | 0.10 | Mighell et al. (1998) | |||
| 12.00 | 5.00 | 5.00 | 1.20 | 0.32 | 0.32 | de Freitas Pacheco et al. (1998) | |||
| NGC 152 | 00:32:56 | 73:06:57 | 1.40 | 0.20 | 0.20 | 0.94 | 0.15 | 0.15 | Crowl et al. (2001) |
| 1.90 | 0.50 | 0.50 | 0.80 | 0.30 | 0.30 | Da Costa & Hatzidimitriou (1998) | |||
| NGC 176 | 00:35:59 | 73:09:57 | 0.20 | 0.20 | 0.10 | 0.60 | - | - | Mackey & Gilmore (2003b) |
| NGC 339 | 00:57:48 | 74:28:00 | 4.00 | 1.50 | 1.50 | 1.19 | 0.10 | 0.10 | Da Costa & Hatzidimitriou (1998) |
| 6.30 | 1.30 | 1.30 | 1.50 | 0.14 | 0.14 | Mighell et al. (1998) | |||
| 2.00 | 0.70 | 0.70 | 0.70 | 0.22 | 0.22 | de Freitas Pacheco et al. (1998) | |||
| NGC 361 | 01:02:13 | 71:36:16 | 8.10 | 1.20 | 1.20 | 1.45 | 0.11 | 0.11 | Mighell et al. (1998) |
| NGC 411 | 01:07:56 | 71:46:05 | 1.40 | 0.20 | 0.20 | 0.68 | 0.07 | 0.07 | Alves & Sarajedini (1999) |
| 1.30 | 0.50 | 0.30 | 0.70 | 0.22 | 0.22 | de Freitas Pacheco et al. (1998) | |||
| 1.50 | 0.30 | 0.30 | 0.70 | 0.20 | 0.20 | Piatti et al. (2005b) | |||
| 1.80 | 0.30 | 0.30 | 0.84 | 0.30 | 0.30 | Da Costa & Hatzidimitriou (1998) | |||
| NGC 416 | 01:07:59 | 72:21:20 | 6.90 | 1.10 | 1.10 | 1.44 | 0.12 | 0.12 | Mighell et al. (1998) |
| 4.00 | 1.50 | 1.50 | 0.80 | 0.23 | 0.23 | de Freitas Pacheco et al. (1998) | |||
| NGC 419 | 01:08:19 | 72:53:03 | 4.00 | 1.50 | 1.50 | 0.60 | 0.21 | 0.21 | de Freitas Pacheco et al. (1998) |
| 1.20 | 0.50 | 0.50 | 0.70 | 0.30 | 0.30 | Da Costa & Hatzidimitriou (1998) | |||
| NGC 458 | 01:14:53 | 71:32:59 | 0.20 | 0.10 | 0.10 | 0.23 | 0.10 | 0.40 | Da Costa & Hatzidimitriou (1998) |
| 0.13 | 0.06 | 0.06 | 0.23 | 0.10 | 0.40 | Piatti et al. (2005b) | |||
| L1 | 00:04:00 | 73:28:00 | 10.00 | 2.00 | 2.00 | 1.01 | 0.11 | 0.11 | Da Costa & Hatzidimitriou (1998) |
| 9.00 | 1.00 | 1.00 | 1.35 | 0.08 | 0.08 | Mighell et al. (1998) | |||
| L4 | 00:21:27 | 73:44:55 | 3.10 | 0.90 | 0.90 | 0.90 | 0.20 | 0.20 | Piatti et al. (2005a) |
| L5 | 00:22:40 | 75:04:29 | 4.10 | 0.90 | 0.90 | 1.20 | 0.20 | 0.20 | Piatti et al. (2005a) |
| 3.00 | 1.50 | 1.50 | 1.10 | 0.20 | 0.20 | Piatti et al. (2005b) | |||
| L6/K4 | 00:23:04 | 73:40:11 | 3.30 | 0.90 | 0.90 | 0.90 | 0.20 | 0.20 | Piatti et al. (2005a) |
| L7/K5 | 00:24:43 | 73:45:18 | 2.00 | 0.20 | 0.20 | 0.60 | 0.20 | 0.20 | Piatti et al. (2005a) |
| 1.20 | 0.50 | 0.50 | 0.50 | 0.20 | 0.20 | Piatti et al. (2005b) | |||
| L11/K7 | 00:27:45 | 72:46:53 | 3.50 | 1.00 | 1.00 | 0.81 | 0.13 | 0.13 | Da Costa & Hatzidimitriou (1998) |
| 3.50 | 0.50 | 0.50 | 1.00 | - | - | Piatti et al. (2005b) | |||
| L19 | 00:37:42 | 73:54:30 | 2.10 | 0.20 | 0.20 | 0.75 | 0.20 | 0.20 | Piatti et al. (2005a) |
| L27 | 00:41:24 | 72:53:27 | 2.10 | 0.20 | 0.20 | 1.30 | 0.30 | 0.30 | Piatti et al. (2005a) |
| L32 | 00:47:24 | 68:55:10 | 4.80 | 0.50 | 0.50 | 1.20 | 0.20 | 0.20 | Piatti et al. (2001) |
| L38 | 00:48:50 | 69:52:11 | 6.00 | 0.60 | 0.60 | 1.65 | 0.20 | 0.20 | Piatti et al. (2001) |
| L113 | 01:49:30 | 73:43:40 | 6.00 | 1.00 | 1.00 | 1.17 | 0.12 | 0.12 | Da Costa & Hatzidimitriou (1998) |
| 5.30 | 1.30 | 1.30 | 1.24 | 0.11 | 0.11 | Mighell et al. (1998) | |||
| L116 | 01:55:33 | 77:39:16 | 2.80 | 1.00 | 1.00 | 1.10 | 0.20 | 0.20 | Piatti et al. (2001) |
| K3 | 6.00 | 1.30 | 1.30 | 1.16 | 0.09 | 0.09 | Mighell et al. (1998) | ||
| 9.00 | 2.00 | 2.00 | 0.98 | 0.12 | 0.12 | Da Costa & Hatzidimitriou (1998) | |||
| 3.50 | 1.50 | 1.50 | 1.00 | 0.28 | 0.28 | de Freitas Pacheco et al. (1998) | |||
| 7.00 | 1.00 | 1.00 | 1.20 | 0.20 | 0.20 | Piatti et al. (2005b) | |||
| K28 | 00:51:42 | 71:59:52 | 2.10 | 0.50 | 0.50 | 1.20 | 0.20 | 0.20 | Piatti et al. (2001) |
| 1.50 | 0.60 | 0.60 | 1.00 | 0.20 | 0.20 | Piatti et al. (2005b) | |||
| K44 | 01:02:04 | 73:55:31 | 3.10 | 0.80 | 0.80 | 1.10 | 0.20 | 0.20 | Piatti et al. (2001) |
| HW 47 | 01:04:04 | 74:37:09 | 2.80 | 0.90 | 0.90 | 1.00 | 0.40 | 0.40 | Piatti et al. (2005a) |
| HW 84 | 01:41:28 | 71:09:58 | 2.40 | 0.20 | 0.20 | 1.20 | 0.40 | 0.40 | Piatti et al. (2005a) |
| HW 86 | 01:42:22 | 74:10:24 | 1.60 | 0.20 | 0.20 | 0.75 | 0.40 | 0.40 | Piatti et al. (2005a) |
| BS 121 | 01:04:22 | 72:50:52 | 2.30 | 0.20 | 0.20 | 1.20 | 0.40 | 0.40 | Piatti et al. (2005a) |
| BS90 | 00:59:05 | 72:09:10 | 4.30 | 0.10 | 0.10 | 0.84 | - | - | Sabbi et al. (2007) |
| 4.47 | 0.55 | 0.49 | 0.71 | 0.10 | 0.13 | This Paper | |||
In order to reproduce the age-metallicity relation for individual clusters in the SMC and add our results on BS 90, we collected a large set of data available on SMC clusters, concerning their metallicities and ages. These data are given in Table 1. We plot the age-metallicity relation for the SMC clusters in Fig. 10. The models published by Pagel & Tautvaišiené (1998) are also displayed with a solid (‘bursting’ model) and a dash-dotted line (‘smooth’ model). The upper panel of Fig. 10 shows ages and metallicities with the corresponding errors for all star clusters collected in Table 1. The lower panel is displayed without the errors, but with a set of dashed lines, which show the connections of points derived from different studies for the same clusters. The latter shows that both the ‘bursting’ and the ‘smooth’ model can be supported by selecting certain clusters and hence an unambiguous conclusion is not possible yet. Moreover, it should be noted that the data given in Table 1 consist of an inhomogeneous set of abundances, perhaps washing away any real effects. The transformation of all these results into a common spectroscopic scale would certainly provide a more clear picture. In any case if we assume that the ‘bursting’ model of Pagel & Tautvaišiené (1998) represents the chemical evolution history of SMC, then our measurements reveal a relatively high metallicity for the epoch during which BS 90 was formed. These values seem to fit better the ‘smooth’ model, which represents a continuous mode of chemical enrichment.
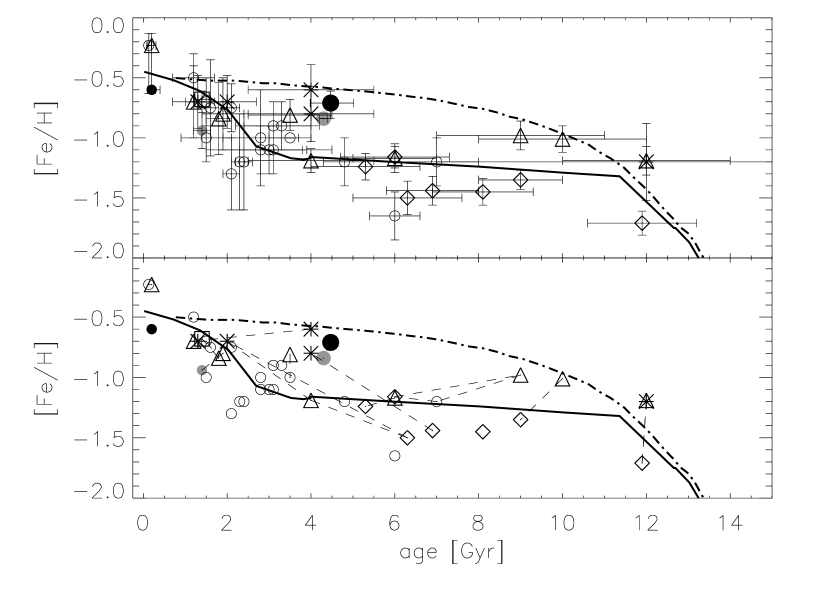
Indeed, our estimated age and metallicity for BS 90 places the cluster in Fig. 10 closer to the ‘smooth’ model (large black dot), in agreement with the estimations of Sabbi et al. (2007) (large grey dot). According to the ‘bursting’ model an iron abundance of [Fe/H] corresponds to the time around 4.5 Gyr ago. Our derived value for BS 90 is about dex higher. On the other hand the ‘smooth’ model requires an iron content of [Fe/H] at Gyr, much closer to our derived value of [Fe/H]. A simple ‘closed box’ model is also supported by the results of Kayser et al. (2006) and consistent with the enrichment history of the outer SMC field which has been derived by Dolphin et al. (2001). With its age and metallicity BS 90 adds an important point to the age-metallicity relation, which favors a continuous mode of chemical enhancement in the SMC, but the chemical evolution history of this galaxy still remains elusive and seems to be more complicated than reflected by the proposed models. Fig. 10 also reveals an increasing number of clusters for the last Gyr. This coincides with the increase of cluster formation in the LMC and is consistent with a close encounter between the Magellanic Clouds and Milky Way as proposed by Bekki et al. (2004). The strong tidal interactions could certainly trigger cluster formation.
8. Summary
In this paper we present our detailed photometric analysis of the intermediate age spherical star cluster BS 90 in the SMC.
We analyzed the stellar surface density profile of BS 90, following the models described by King (1962) and Elson, Fall & Freeman (1987). We derived almost the same value for the core radius of pc with both models. This value places BS 90 in the -age relation among the SMC clusters that do not seem to evolve isolated. From the model of Elson, Fall & Freeman (1987), we found a stellar surface density which, at larger radii, decreases outwards with a power-law slope of . The application of King’s model delivered a tidal radius of pc and a concentration parameter , which seems to be relatively low, compared to other SMC clusters (McLaughlin & van der Marel 2005).
We counted stars in different magnitude intervals in order to derive the LF of the cluster. The derived luminosity function of BS 90 reflects features of the cluster like the red clump as a higher stellar density around mag and mag, respectively, and the turn-off at mag and mag, respectively. The PDMF is a linearly decreasing function up to the high mass end of the cluster. We derived a slope of the PDMF of for a completeness in our photometry higher than 50 % and of above the 70% completeness limit. Consequently, the PDMF of BS 90 has a slope between the one derived by Salpeter (1955) for the IMF in the solar neighborhood, and a shallower slope, comparable to earlier derived slopes from studies on Magellanic Cloud clusters (e.g. Kerber & Santiago 2006; Gouliermis et al. 2004). The difference from the Salpeter slope can also be explained by the fact, that unresolved binaries flatten the PDMF (Kerber & Santiago 2006) or that stars escaped from the cluster (Meylan & Heggie 1997).
We investigated the radial dependence of the mass function slope to check whether BS 90 is mass segregated or not. We found that indeed the mass function becomes steeper at larger distances from the center of the cluster. The radial dependence of the slope indicates a central concentration of the massive stars and hence mass segregation. We also confirm previous claims that the PDMF around the half-mass radius is comparable to the overall PDMF since it is the region which is least affected by mass segregation (Kroupa 2002; Vesperini & Heggie 1997). Within the half-light radius of pc, we obtained a half-mass relaxation time of about Gyr and therefore we conclude that the mass segregation is due to the dynamical evolution of BS 90, since the age of the cluster is older than the derived half-mass relaxation time. Mass segregation provides another possible reason for a flattening of the mass function which may occur during the evolution of the cluster.
Isochrone models fitting to the constructed CMD (Fig. 6) of BS 90 revealed an age of about Gyr, which characterizes this cluster as one of the very rare star clusters, formed in a possible quiescent period of cluster formation in the SMC (Rafelski & Zaritsky 2005). There are only few clusters in the range between 4 and 10 Gyr. The applied isochrone yields a metallicity of . The total visual extinction has been found to be mag. The low value of the total visual extinction combined with the large amount of gas in the general region and the absence of indications of differential reddening in the CMD of BS 90 suggests that the cluster is probably located in front of the association NGC 346. The distance of BS 90 has been estimated to 58.9 kpc.
The location of BS 90 in the age-metallicity plot shows that this cluster fits better to a simple ‘smooth’ model, which represent a continuous chemical enhancement for the SMC, rather than a ‘bursting’ model for the chemical evolution history of the galaxy, in agreement with recent results on other SMC clusters (Kayser et al. 2006). However, inconsistent metallicity estimation methods for different SMC clusters provide an inhomogeneous set of results, that should be transfered onto a common abundance scale, so that an unambiguous picture of the chemical evolution history of SMC can be derived. Furthermore, given that the SMC is part of an interacting system between the MCs and the Milky Way, the chemical evolution history of this galaxy is probably far more complicated than what suggested by a simple ‘closed-box’ model.
References
- (1)
- (2) Alves, D. R., & Sarajedini, A. 1999, ApJ, 511, 225
- (3) Baumgardt, H., & Makino, J. 2003, MNRAS, 340, 227
- (4) Bekki, K., Couch, W. J., Beasley, M. A., Forbes, D. A., Chiba, M., & Da Costa, G. S. 2004, ApJ, 610, L93
- (5) Bertelli, G., Bressan, A., Chiosi, C., Fagotto, F., & Nasi, E. 1994, A&AS, 106, 275
- (6) Bica, E. L. D., & Schmitt, H. R. 1995, ApJS, 101, 41
- (7) Binney, J., Merrifield, M., 1998, Galactic astronomy. Princeton University Press, Princeton, NJ
- (8) Binney, J., & Tremaine, S., 1987, Galactic dynamics. Princeton University Press, Princeton, NJ
- (9) Crowl, H. H., Sarajedini, A., Piatti, A. E., Geisler, D., Bica, E., Clariá, J. J., & Santos, J. F. C., Jr. 2001, AJ, 122, 220
- (10) Da Costa, G. S. 1991, IAU Symp. 148: The Magellanic Clouds, 148, 183
- (11) Da Costa, G. S., & Hatzidimitriou, D. 1998, AJ, 115, 1934
- (12) de Freitas Pacheco, J. A., Barbuy, B., & Idiart, T. 1998, A&A, 332, 19
- (13) de Grijs, R., Gilmore, G. F., Johnson, R. A., & Mackey, A. D. 2002, MNRAS, 331, 245
- (14) Dolphin, A. E. 2000, PASP, 112, 1383
- (15) Dolphin, A. E., Walker, A. R., Hodge, P. W., Mateo, M., Olszewski, E. W., Schommer, R. A., & Suntzeff, N. B. 2001, ApJ, 562, 303
- (16) Elson, R. A. W., Fall, S. M., & Freeman, K. C. 1987, ApJ, 323, 54
- (17) Girardi, L., et al. 2002, A&A, 391, 195
- (18) Gouliermis, D., Keller, S. C., Kontizas, M., Kontizas, E., & Bellas-Velidis, I. 2004, A&A, 416, 137
- (19) Gouliermis, D. A., Dolphin, A. E., Brandner, W., & Henning, T. 2006, ApJS, 166, 549 (Paper I)
- (20) Henize, K. G. 1956, ApJS, 2, 315
- (21) Kayser, A., Grebel, E. K., Harbeck, D. R., Cole, A. A., Koch, A., Gallagher, J. S., & Da Costa, G. S. 2006, ArXiv Astrophysics e-prints, arXiv:astro-ph/0607047
- (22) Kerber, L. O., & Santiago, B. X. 2006, A&A, 452, 155
- (23) Kroupa, P. 2002, Science, 295, 82
- (24) King, I. 1962, AJ, 67, 471
- (25) Lightman, A. P., & Shapiro, S. L. 1978, Reviews of Morden Physics, 50, 437
- (26) McLaughlin, D. E., & van der Marel, R. P. 2005, ApJS, 161, 304
- (27) Mackey, A. D., & Gilmore, G. F. 2003a, MNRAS, 338, 85
- (28) Mackey, A. D., & Gilmore, G. F. 2003b, MNRAS, 338, 120
- (29) Mackey, A. D., & Gilmore, G. F. 2003c, MNRAS, 340, 175
- (30) Mackey, A. D., Payne, M. J., & Gilmore, G. F. 2006, MNRAS, 369, 921
- (31) Meylan, G., & Heggie, D. C. 1997, A&A Rev., 8, 1
- (32) Mighell, K. J., Sarajedini, A., & French, R. S. 1998, AJ, 116, 2395
- (33) Nazé, Y., Hartwell, J. M., Stevens, I. R., Manfroid, J., Marchenko, S., Corcoran, M. F., Moffat, A. F. J., & Skalkowski, G. 2003, ApJ, 586, 983
- (34) Nazé, Y., Manfroid, J., Stevens, I. R., Corcoran, M. F., & Flores, A. 2004, ApJ, 608, 208
- (35) Pagel, B. E. J., & Tautvaišiené, G. 1998, MNRAS, 299, 535
- (36) Peimbert, M., Peimbert, A., & Ruiz, M. T. 2000, ApJ, 541, 688
- (37) Piatti, A. E., Santos, J. F. C., Clariá, J. J., Bica, E., Sarajedini, A., & Geisler, D. 2001, MNRAS, 325, 792
- (38) Piatti, A. E., Sarajedini, A., Geisler, D., Seguel, J., & Clark, D. 2005a, MNRAS, 358, 1215
- (39) Piatti, A. E., Santos, J. F. C., Jr., Clariá, J. J., E., Ahumada, A. V., & Parisi, M. C. 2005b, A&A, 440, 111
- (40) Pilyugin L. S., 1996, A&A, 310, 751
- (41) Rafelski, M., & Zaritsky, D. 2005, AJ, 129, 2701
- (42) Rich, R. M., Shara, M., Fall, S. M., & Zurek, D. 2000, AJ, 119, 197
- (43) Rubio, M., Contursi, A., Lequeux, J., Probst, R., Barbá, R., Boulanger, F., Cesarsky, D., & Maoli, R. 2000, A&A, 359, 1139
- (44) Russell S. C., & Dopita M. A., 1992, ApJ, 384, 508
- (45) Sabbi, E., et al. 2007, AJ, 133, 44
- (46) Salpeter, E. E. 1955, ApJ, 121, 161
- (47) Scalo, J. M. 1986, Fundamentals of Cosmic Physics, 11, 1
- (48) Spitzer, L., Jr. 1975, IAU Symp. 69: Dynamics of the Solar Systems, 69, 3
- (49) Spitzer, L. 1987, Princeton, NJ, Princeton University Press, p. 191
- (50) Tsujimoto T., Nomoto K., Yoshii Y., Hashimoto M., Yanagida S., Thielemann F.-K., 1995, MNRAS, 277, 945
- (51) van den Bergh, S. 1991, ApJ, 369, 1
- (52) Vesperini, E., & Heggie, D. C. 1997, MNRAS, 289, 898
- (53) Westerlund, B. E. 1997, The Magellanic Clouds. Cambridge University Press, Cambridge
- (54)