11email: ccomito@mpifr-bonn.mpg.de 22institutetext: Instituto de Estructura de la Materia, Consejo Superior de Investigaciones Científicas, Departamento de Astrofísica Molecular e Infrarroja, C/Serrano 121, E-28006 Madrid, Spain
High-resolution study of a star-forming cluster
in the Cep-A HW2
region
Abstract
Context. Due to its relatively small distance (725 pc), the Cepheus A East star-forming region is an ideal laboratory to study massive star formation processes.
Aims. Based on its morphology, it has been suggested that the flattened molecular gas distribution around the YSO HW2 may be a 350-AU-radius massive protostellar disk. Goal of our work is to ascertain the nature of this structure.
Methods. We have employed the Plateau de Bure Interferometer111Based on observations carried out with the IRAM Plateau de Bure Interferometer. IRAM is supported by INSU/CNRS (France), MPG (Germany) and IGN (Spain). to acquire (sub-)arcsecond-resolution imaging of high-density and shock tracers, such as methyl cyanide () and silicon monoxide (SiO), towards the HW2 position.
Results. On the ( AU) scale, the flattened distribution of molecular gas around HW2 appears to be due to the projected superposition, on the plane of the sky, of at least three protostellar objects, of which at least one is powering a molecular outflow at a small angle with respect to the line of sight. The presence of a protostellar disk around HW2 is not ruled out, but such structure is likely to be detected on a smaller spatial scale, or using different molecular tracers.
1 Introduction
Several theories are being considered to explain the formation of massive (M M⊙) stars, which can be roughly grouped into accretion-driven and coalescence-driven models (cf. Stahler et al. stahler2000 (2000)). In the latter case, high-mass stars would form by merging of two or more lower-mass objects, making the presence of stable massive accretion disks around the protostar very unlikely. However, only models based on disk-protostar interactions are capable of explaining the existence of jets and outflows: hence, the high incidence, in large samples of massive YSOs, of highly collimated outflows (cf. Beuther et al. beuther2002b (2002)) has been interpreted as indirect evidence for the existence of high-mass disks.
It is undoubted that the direct detection of accretion onto massive protostars through rotating disks constitutes an important tile in the massive-star-formation-theory mosaic. From an observational point of view, this task is made very difficult by two factors: i) massive star-forming regions typically are far away, a few kpc on average, making the direct observation of small-scale structure such as disks virtually impossible with current instruments; and ii), massive stars form in clusters, making the surrounding region extremely complex, both spatially and kinematically.
Located only pc from the Sun (Johnson johnson1957 (1957)), Cepheus A is considered a very promising candidate for the detection of a massive disk. Its well-studied bipolar outflow (cf. Gómez et al. gomez1999 (1999), hereafter G99, and references therein) is thought to be powered by the radio-continuum source HW2 ( L⊙, Rodríguez et al. rodriguez1994 (1994)). Curiel et al. (curiel2006 (2006)) report the presence of very large tangential velocities in the HW2 radio jet, consistent with HW2 being a massive Young Stellar Object (YSO). The distribution of masers (Torrelles et al. torrelles1996 (1996)) and of the SiO emission (G99) around HW2, both oriented perpendicularly with respect to the direction of the flow, have been interpreted as strongly supporting the existence of accretion shocks onto a rotating and contracting molecular disk of -AU diameter, centered on HW2, with the northeast-southwest outflow being triggered by the interaction between such disk and HW2 itself. Similar conclusions have been reached by Patel et al. (patel2005 (2005)), based on SMA observations of and dust emission. However, the fact that the HW2 vicinities are crowded with YSOs (at least three within an area of , Curiel et al. curiel2002 (2002)), together with the recent detection of an internally heated hot core within from the center of the outflow (Martín-Pintado et al. martinpintado2005 (2005), hereafter MP05) cast some doubts on this interpretation. Based on our PdBI observations, we conclude that, on the scale, the elongated molecular structure around HW2 can be explained with the superposition, on the plane of the sky, of at least three different hot-core-type sources, at least one of them being the exciting source for a second molecular outflow.
2 Observations
In 2003 and 2004, with the Plateau de Bure Interferometer, we have carried out observations of several high-density and shock tracers (also cf. Schilke et al., in prep.), among which silicon monoxide (SiO) and methyl cyanide (CH3CN), towards the HW2 position (, ). A combination of high-spectral-resolution correlator units were employed to achieve a channel width of up to . The five antennas in AB (extended) configuration provided a HPBW of for SiO(2-1) at 86 GHz, and of for () at 220 GHz. The data cubes were produced with natural weighting. All maps have been CLEANed. Analysis of all molecular spectra has been performed after subtraction of the continuum emission.
3 Results
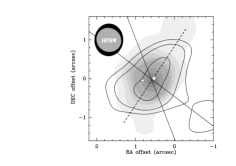
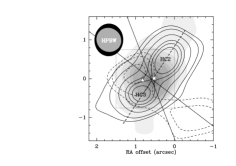
Fig. 1 (left panel) shows the Cep-A star-forming region within a -AU radius from HW2. The peak of the 241-GHz dust emission (grey scale) roughly coincides with the HW2 position and with the center of the large-scale outflow. The integrated emission is also centered on HW2 (contours), and somewhat elongated almost perpendicularly to the direction of the large-scale outflow. Like other molecular tracers (cf. Brogan et al. brogan2007 (2007)), displays two different velocity components, centered around and respectively. The solid contours in Fig. 1, center panel, show the emission of the () transition, integrated between and , whereas the emission in the range between and is represented by the dashed contours (see § 3.2).
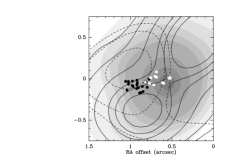
The center of SiO emission, instead, is at . Silicon monoxide peaks about eastwards of HW2, at a position that coincides with the HC source of MP05 (triangle in Fig. 1, see § 3.1), close to the - component. In what follows, we will discuss in more detail the SiO and data.
3.1 SiO
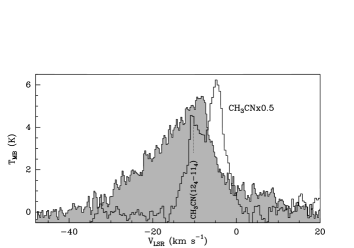
Our dataset confirms that the spatial distribution of this shock tracer is mainly concentrated in the HW2 region (its presence in the large-scale outflow is limited to a few bullets at large distances from the center), although not centered on the HW2 position. This does indeed suggest that shock processes are taking place in the (projected) immediate vicinities of HW2. However, if the SiO emission were arising from accretion shocks onto a rotating disk (as proposed by G99), we would expect to observe a similar velocity structure to that observed for the other molecular tracers peaking around HW2. Instead, SiO seems to be tracing a completely different kinematic component: unlike any other line in our dataset, the SiO(2-1) line has a velocity spread of at least at the zero-flux level ( FWHM). A mass of about 90 would be required to produce such large line width in a gravitationally bound enviroment (assuming virial equilibrium, and that the emission arises in a region of -AU radius). This value is about one order of magnitude larger than the estimated mass of HW2, which is expected to become a B0.5 star once in ZAMS (Rodriguez et al. rodriguez1994 (1994)). Fig. 2 shows a comparison between SiO(2-1) and ().
We carried out a two-dimensional Gaussian fit of the SiO(2-1) spatial distribution, for every spectral channel in the velocity range . This corresponds to the spectral interval in which the signal-to-noise (S/N) ratio of the SiO transition is . For smaller S/N ratios, in fact, the error on the fitted centroid position easily exceeds 50%. The result is a distribution of the centroids of SiO emission as a function of velocity. Fig. 1, right panel, shows that the centroid positions are located in a well-defined two-lobed area, centered about eastwards of HW2 and of the dust continuum emission peak. Although the error on every single centroid position is still relatively large (up to 30%), as a whole their distribution describes a very clear velocity trend, with all the emission at clustering in the left lobe, and all the emission at clustering in the right lobe. This result suggests that a second molecular outflow is being ejected in the HW2 region. Our interpretation is supported by the recent discovery of an intermediate-mass protostar, surrounded by the hot molecular core HC (MP05) located in the region between the blue and red lobes of SiO emission (white triangle in Fig. 1, right panel), hence a very likely candidate to be its powering engine. With the current dataset it is not possible to establish the exact inclination angle of the flow, but the large velocity spread observed in the SiO(2-1) line, together with the relatively concentrated spatial distribution of the SiO emission, suggests that the inclination angle must be high, i.e., that the SiO flow is being ejected at a small angle with respect to the line of sight.
3.2 CH3CN
The dense molecular gas, as traced by CH3CN(123-113) (Fig. 1, left panel) appears to be distributed around the HW2 position, and elongated in a direction roughly perpendicular to the projected direction of the large-scale outflow on the plane of the sky. From a morphological point of view, therefore, the data are very suggestive of the presence of a -AU-radius disk-like structure around HW2.
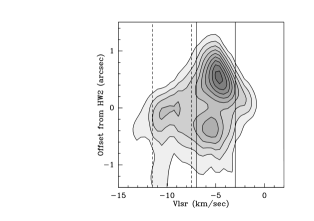
On the other hand, as already pointed out by Torrelles et al. (torrelles1999 (1999)) based on VLA observations of NH3, the kinematical picture describing the dense gas distribution in the region is quite complex. A position-velocity cut along the major axis of the elongated structure (indicated in Fig. 1, left and center panels, with a dashed line) reveals a velocity spread of about 6 (see Fig. 3), also observed by Patel et al. (patel2005 (2005)). However, the two intensity peaks along the axis share roughly the same systemic velocity ( ). The weaker, blue-shifted component of emission ( ), appears to trace rather the outskirt of a physically separated component than a rotation-induced velocity gradient along the axis of the alleged “disk”. The peak of the -10 CH3CN emission is spatially and kinematically close to the center of the small-scale SiO outflow (see Fig. 1, right panel), it is likely associated to it and/or to its exciting source.
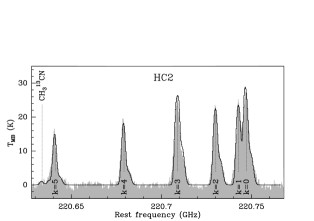
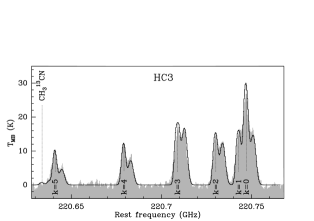
The integrated intensity is dominated by the two - peaks, which lie respectively about to the northwest, and to the southeast of the HW2 position. The fact that the two peaks share roughly the same systemic velocity, is not compatible with the “rotating disk” hypothesis. In what follows, we will treat them as independent condensations, and to be consistent with the nomenclature introduced by MP05, we will refer to them respectively as HC2 and HC3. Fig. 4 compares the spectra observed towards the two positions. It is clear that, in both cases, both the - and - components are present along the line of sight, although the contribution from the latter is more substantial towards HC3, i.e., close to the peak of the - SiO emission.
We have assumed the LTE approximation to fit the physical parameters associated with the two different velocity components. All transitions in the spectrum are fitted simultaneously, in order to take line blending and optical depth effects properly into account (a detailed description of the method can be found in Comito et al. comito2005 (2005)). For the component, our fit reveals that the k through k transitions are optically thick towards both positions. The data at this velocity can only be reproduced by including a very compact, hot, dense object in the model. The emission centered at - can be modeled with a cooler, more extended component. The results of the fit, for the two positions, are summarized in Tab. 1.
Although the presence of secondary minima in the space is unavoidable when so many parameters are varied to achieve minimization, in this case the simultaneous fitting of intensity ratios between optically thick and optically thin lines, between ortho- and para- transitions, and between 12C and 13C isotopologues of methyl cyanide (see Fig. 4), places very stringent constraints on the viable parameter space, at least as far as the compact ( ) component is concerned. Note that the rotational temperatures derived in this fashion are significantly higher than those derived by Patel et al. (patel2005 (2005)). This discrepancy can be explained with the optical depth correction in our fit.
4 Discussion
The observed elongation of the molecular gas distribution around HW2, over a radius of ( AU), appears to be due to the projected superposition, on the plane of the sky, of at least three protostellar objects, of which at least one is triggering a molecular outflow at a small angle with respect to the line of sight (§ 3.1, § 3.2). All lines in our dataset are consistent with this interpretation. The distribution of molecular gas around HW2 can, on a scale, be interpreted as a cluster of high- and intermediate-mass protostars in the Cepheus A HW2 region. The analysis of the spectra (§ 3.2) suggests the presence of internally heated compact hot-core-type objects like HC, likely hosting protostellar objects, although the 1-mm continuum emission peaks on the HW2 position and does not show any secondary clumps. This may be due to insufficient dynamic range in our data, if the contribution, to the 241-GHz continuum, of free-free emission from the HW2 thermal jet is large. Fig. 5 shows the variation of the measured HW2 continuum flux density as a function of frequency, , between 1.5 and 327 GHz (data points from: Rodríguez et al. rodriguez1994 (1994); this work; Patel et al. patel2005 (2005)). A two-component least-squares fit of the data yields (consistent with the value inferred by Rodríguez et al. rodriguez1994 (1994), and with the theoretical predictions for the radio continuum spectrum of a confined thermal jet, Reynolds reynolds1986 (1986)) and (dashed and dashed-dotted lines respectively in Fig. 5), where (solid curve in Fig. 5). Based on this estimate, the thermal jet (free-free) contribution at 241 GHz should be of the total flux.
However, the flux density variation in the (sub)mm-wavelength portion of the spectrum increases basically on a Rayleigh-Jeans slope, suggesting the presence of optically thick emission from an unresolved (with our best spatial resolution, at 241 GHz with PdBI) continuum source, whose size thus cannot be larger than . Although we cannot determine the nature of this compact source, it makes sense to hypothesize that it can be described by i), dust emission, and/or ii), free-free emission from a Hii region (for example associated to a photoevaporating disk). For case i), we adopt Beckwith et al.’s (beckwith1990 (1990)) values for the mass absorption coefficient, , with , to estimate the lower mass limit for an object with size ( AU) to produce optically thick emission at 87 GHz: . Based on the peak flux at 87, 241 (this work) and 327 GHz (Patel et al. patel2005 (2005)), the above value of yields a brightness temperature, K. Smaller source sizes would lead to higher intrinsic temperatures and lower mass limits. In case ii), we assume K (typical for Hii regions), which would translate into a source size of ( AU). The continuum source VLA-mm (Curiel et al. curiel2002 (2002)), which is located south of HW2 and whose size cannot be larger than AU, displays a much too weak emission at cm and mm wavelengths, and we estimate its contribution to cover for at most 5% of the observed (sub)mm flux.
In other words, we cannot discard any of the two hypotheses for the observed optically thick continuum emission. At higher frequencies, the spectral index would get flatter if the optically thick emission were only due to free-free emission, while it would remain the same for dust. Observations with a resolution of , which are within the reach of present day interferometers, would be able to shed more light on the nature of this object.

As these estimates show, our conclusions do not rule out at all the existence, on a smaller scale, of an accretion disk around HW2, which in fact is to be expected, based on the very presence of the HW2 jet. In fact, recent 7-mm VLA observations of SO2 have led Jiménez-Serra et al. (jimenezserra2007 (2007)) to claim the detection of a disk-like structure with a size of AU, roughly centered on the HW2 position, part of which may be photoevaporating. Although spatially almost coexistent on the plane of the sky, this structure is characterized by a different ( , as opposed to ) and apparently a different chemistry from the molecular gas traced by . Our above estimates on the nature of the black-body emission in the (sub)mm regime are all consistent with Jiménez-Serra et al.’s conclusions.
Overall, the Cepheus A HW2 allows, due to its proximity, a view into the heart of a massive star forming region. The emerging picture is anything but simple: including the sources detected by Curiel et al. (curiel2002 (2002)), and the hot cores HC, HC2 and HC3, at least 6 probable young stellar or protostellar objects are located within a radius of or 725 AU. It remains an open issue whether, under such circumstances we can expect to observe a classical accretion disk feeding a single central star, or rather some kind of circum-cluster disk or ring-like structure (analogous perhaps to circumbinary rings like the one around GG Tau, Guilloteau et al. guilloteau1999 (1999)), and what such a structure may look like, both from a morphological and from a kinematical point of view. Higher spatial resolution is needed, but the challenge is to identify the right chemical tracer to investigate the structures one is interested in. , otherwise considered a reasonably good disk tracer (e.g. for the disk in IRAS 20126, Cesaroni et al. cesa1997 (1997)), does not seem to trace the disk-like structure seen by Jiménez-Serra et al. (jimenezserra2007 (2007)) at all.
Another issue is the physical location of the molecular component. Though it seems likely that the peak of - emission is associated with the powering source of the small-scale SiO outflow, its connection to the somewhat more extended molecular emission at this systemic velocity (cf. Brogan et al. brogan2007 (2007)) remains to be confirmed.
Acknowledgements.
The authors are grateful to the IRAM staff in Grenoble, particularly to H. Wiesemeyer, J. M. Winters and R. Neri, for their support in the data calibration process. An anonymous referee has given a significant contribution to the improvement of this paper. CC and PS have enjoyed many fruitful discussions with Malcolm Walmsley. JMP and IJS acknowledge the support provided through projects number ESP2004-00665 and S-0505ESP-0277 (ASTROCAM).References
- (1) Beckwith, S. V. W., Sargent, A. I., Chini, R. S., & Guesten, R. 1990, AJ, 99, 924
- (2) Beuther, H., Schilke, P., Sridharan, T. K., Menten, K. M., Walmsley, C. M., & Wyrowski, F. 2002, A&A, 383, 892
- (3) Brogan, C., Hunter, T. R., Indebetouw, R., Shirley, Y. L., Chandler, C. J., Rao, R., Sarma, A. P. 2007, in Proceedings of Science with ALMA: A new era for Astrophysics, Ed. R. Bachiller (Springer)
- (4) Cesaroni, R., Felli, M., Testi, L., Walmsley, C. M., & Olmi, L. 1997, A&A, 325, 725
- (5) Comito, C., Schilke, P., Phillips, T. G., Lis, D. C., Motte, F., & Mehringer, D. 2005, ApJS, 156, 127
- (6) Curiel, S., et al. 2002, ApJ, 564, L35
- (7) Curiel, S., et al. 2006, Astrophys. J., 638, 878
- (8) Gómez, J. F., Sargent, A. I., Torrelles, J. M., Ho, P. T. P., Rodríguez, L. F., Cantó, J., & Garay, G. 1999, Astrophys. J., 514, 287 (G99)
- (9) Guilloteau, S., Dutrey, A., & Simon, M. 1999, A&A, 348, 570
- (10) Jiménez-Serra, I., et al. 2007, Astrophys. J., submitted
- (11) Johnson, H. L. 1957, Astrophys. J., 126, 121
- (12) Martín-Pintado, J., Jiménez-Serra, I., Rodríguez-Franco, A., Martín, S., & Thum, C. 2005, ApJ, 628, L61 (MP05)
- (13) Patel, N. A., et al. 2005, Nature, 437, 109
- (14) Reynolds, S. P. 1986, Astrophys. J., 304, 713
- (15) Rodriguez, L. F., Garay, G., Curiel, S., Ramirez, S., Torrelles, J. M., Gomez, Y., & Velazquez, A. 1994, ApJ, 430, L65
- (16) Sridharan, T. K., Williams, S. J., & Fuller, G. A. 2005, ApJL, 631, L73
- (17) Stahler, S. W., Palla, F., & Ho, P. T. P. 2000, Protostars and Planets IV, 327
- (18) Torrelles, J. M., Gomez, J. F., Rodriguez, L. F., Curiel, S., Ho, P. T. P., & Garay, G. 1996, ApJ, 457, L107
- (19) Torrelles, J. M., Gómez, J. F., Garay, G., Rodríguez, L. F., Miranda, L. F., Curiel, S., & Ho, P. T. P. 1999, Monthly Notices Roy. Astron. Soc., 307, 58