Dust covering factor, silicate emission and star formation in luminous QSOs
We present Spitzer IRS low resolution, mid-IR spectra of a sample of 25 high luminosity QSOs at 2z3.5. When combined with archival IRS observations of local, low luminosity type-I active galactic nuclei (AGNs), the sample spans five orders of magnitude in luminosity. We find that the continuum dust thermal emission at is correlated with the optical luminosity, following the non-linear relation . We also find an anti correlation between and the [Oiii]5007 line luminosity. These effects are interpreted as a decreasing covering factor of the circumnuclear dust as a function of luminosity. Such a result is in agreement with the decreasing fraction of absorbed AGNs as a function of luminosity recently found in various surveys. In particular, while X-ray surveys find a decreasing covering factor of the absorbing gas as a function of luminosity, our data provides an independent and complementary confirmation by finding a decreasing covering factor of dust. We clearly detect the silicate emission feature in the average spectrum, but also in four individual objects. These are the Silicate emission in the most luminous objects obtained so far. When combined with the silicate emission observed in local, low luminosity type-I AGNs, we find that the silicate emission strength is correlated with luminosity. The silicate strength of all type-I AGNs also follows a positive correlation with the black hole mass and with the accretion rate. The Polycyclic Aromatic Hydrocarbon (PAH) emission features, expected from starburst activity, are not detected in the average spectrum of luminous, high-z QSOs. The upper limit inferred from the average spectrum points to a ratio between PAH luminosity and QSO optical luminosity significantly lower than observed in lower luminosity AGNs, implying that the correlation between star formation rate and AGN power saturates at high luminosities.
Key Words.:
infrared: galaxies – galaxies: nuclei – galaxies: active – galaxies: Seyfert – galaxies: starburst – quasars: general1 Introduction
The mid-IR (MIR) spectrum of AGNs contains a wealth of information which is crucial to the understanding of their inner region. The observed prominent continuum emission is due to circumnuclear dust heated to a temperature of several hundred degrees by the nuclear, primary optical/UV/X-ray source (primarily the central accretion disk); therefore, the MIR continuum provides information on the amount and/or covering factor of the circumnuclear dust. The MIR region is also rich of several emission features which are important tracers of the ISM. Among the dust features, the Polycyclic-Aromatic-Hydrocarbon bands (PAH, whose most prominent feature is at ) are emitted by very small carbon grains excited in the Photo Dissociation Regions, that are tracers of star forming activity (although PAHs may not be reliable SF tracers for compact HII regions or heavily embedded starbursts, Peeters et al., 2004; Förster Schreiber et al., 2004). Additional MIR dust features are the Silicate bands at and at , often seen in absorption in obscured AGNs and in luminous IR galaxies.
Major steps forward in this field were achieved thanks to the Spitzer Space Observatory, and to its infrared spectrometer, IRS, which allows a detailed investigation of the MIR spectral features in a large number of sources. In particular, IRS allowed the detection of MIR emission lines in several AGNs (e.g. Armus et al., 2004; Haas et al., 2005; Sturm et al., 2006a; Weedman et al., 2005), the detection of PAHs in local PG QSOs (Schweitzer et al., 2006), the first detection of the Silicate feature in emission (Siebenmorgen et al., 2005; Hao et al., 2005), as well as detailed studies of the silicate strength in various classes of sources (Spoon et al., 2007; Hao et al., 2007; Shi et al., 2006; Imanishi et al., 2007).
However, most of the current Spitzer IRS studies have focused on local and modest luminosity AGNs (including low luminosity QSOs), with the exception of a few bright, lensed objects at high redshift (Soifer et al., 2004; Teplitz et al., 2006; Lutz et al., 2007). We have obtained short IRS integrations of a sample of 25 luminous AGNs (hereafter QSOs) at high redshifts with the goal of extending the investigation of the MIR properties to the high luminosity range. The primary goals were to investigate the covering factor of the circumnuclear dust and the dependence of the star formation rate (SFR), as traced by the PAH features, on various quantities such as metallicity, narrow line luminosity, accretion rate and black hole mass. In combination with lower luminosity AGNs obtained by previous IRS studies, our sample spans about 5 orders of magnitude in luminosity. This allows us to look for the dependence of the covering factor on luminosity and black hole mass. We also search for the silicate emission and PAH-related properties although the integration times were too short, in most cases, to unveil the properties of individual sources.
In Sect. 2 we discuss the sample selection, the observations and the data reduction. In Sect. 3.1 we describe the spectral analysis and the main observational results, and in Sect. 3.2 we include additional data on local, low luminosity sources from the literature and from the Spitzer archive. The dust covering factor is discussed in Sect. 4.1, the properties of the Silicate emission feature in Sect. 4.2 and the constraints on the star formation in Sect. 4.3. The conclusion are outlined in Sect. 5. Throughout the paper we assume a concordance -cosmology with , and (Spergel et al., 2003).
2 Sample selection, observations and data reduction
High redshift, high luminosity QSOs in our sample were mostly drawn from Shemmer et al. (2004) and from Netzer et al. (2004). The latter papers presented near-IR spectra (optical rest-frame) of a large sample of QSOs at 2z3.5, which were used to obtain detailed information on the black hole (BH) mass (by means of the width of the H line), on the accretion rate and on the strength of the narrow emission line [OIII]5007. The sample contains also infrared data on two sources from Dietrich et al. (2002) and a few additional QSOs in the same redshift range, for which near-IR spectra where obtained after Shemmer et al. (2004), but unpublished yet. This sample allows us not only to extend the investigation of the MIR properties as a function of luminosity, but also to relate those properties to other physical quantities such as BH mass, accretion rate and luminosity of the narrow line region. In total our sample includes 25 sources which are listed in Table 1. Note that the QSOs in Shemmer et al. (2004) and in Netzer et al. (2004) were extracted from optically or radio selected catalogs, without any pre-selection in terms of mid- or far-IR brightness. Therefore, the sample is not biased in terms of star formation or dust content in the host galaxy.
We observed these QSOs with the Long-Low resolution module of the Spitzer Infrared Spectrograph IRS (Houck et al., 2004), covering the wavelength range 22–35m, in staring mode. Objects were acquired by a blind offset from a nearby, bright 2MASS star, whose location and proper motion were known accurately from the Hipparcos catalog. We adopted the “high accuracy” acquisition procedure, which provides a slit centering good enough to deliver a flux calibration accuracy better than 5%. The integration time was of 12 minutes on source, with the exception of seven which were observed only 4 minutes each111More specifically: LBQS0109+0213, HB891318-113, HB891346-036,SBS1425+606,HB892126-158, 2QZJ222006.7-280324,VV0017.
We started our reduction from the Basic Calibrated Data (BCD). For each observation, we combined all images with the same position on the slit. Then the sky background was subtracted by using pairs of frames where the sources appears at two different positions along the slit. The spectra were cleaned for bad, hot and rogue pixels by using the IRSCLEAN algorithm. The monodimensional spectra were then extracted by means of the SPICE software.
3 Analysis
3.1 Main observational results
All of the objects were clearly detected. In Tab. 2 we list the observed continuum flux densities at the observed wavelength corresponding to . This wavelength was chosen both because it is directly observed in the spectra of all objects and because it is far from the Silicate feature and in-between PAH features. Thus the determination of L(6.7m) should be little affected by uncertainties in the subtraction of the starburst component (see below). For two of the radio-loud objects (HB890123+257 and TON618) the MIR flux lies on the extrapolation of the synchrotron radio emission and therefore the former is also probably non-thermal. Since in this paper we are mostly interested in the thermal emission by dust, the latter two objects are not used in the statistical analysis. For the other two radio loud QSOs, the extrapolation of the radio spectrum falls below the observed MIR emission and the latter is little affected by synchrotron contamination.
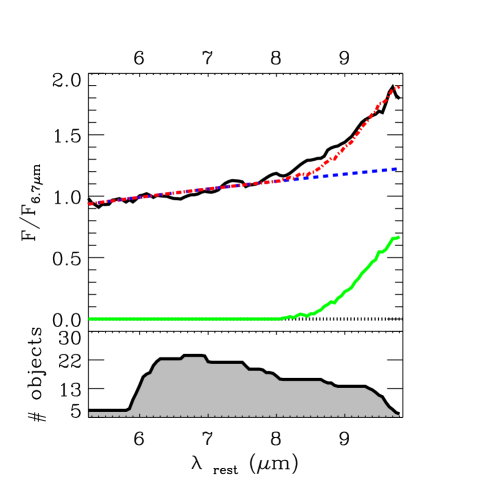
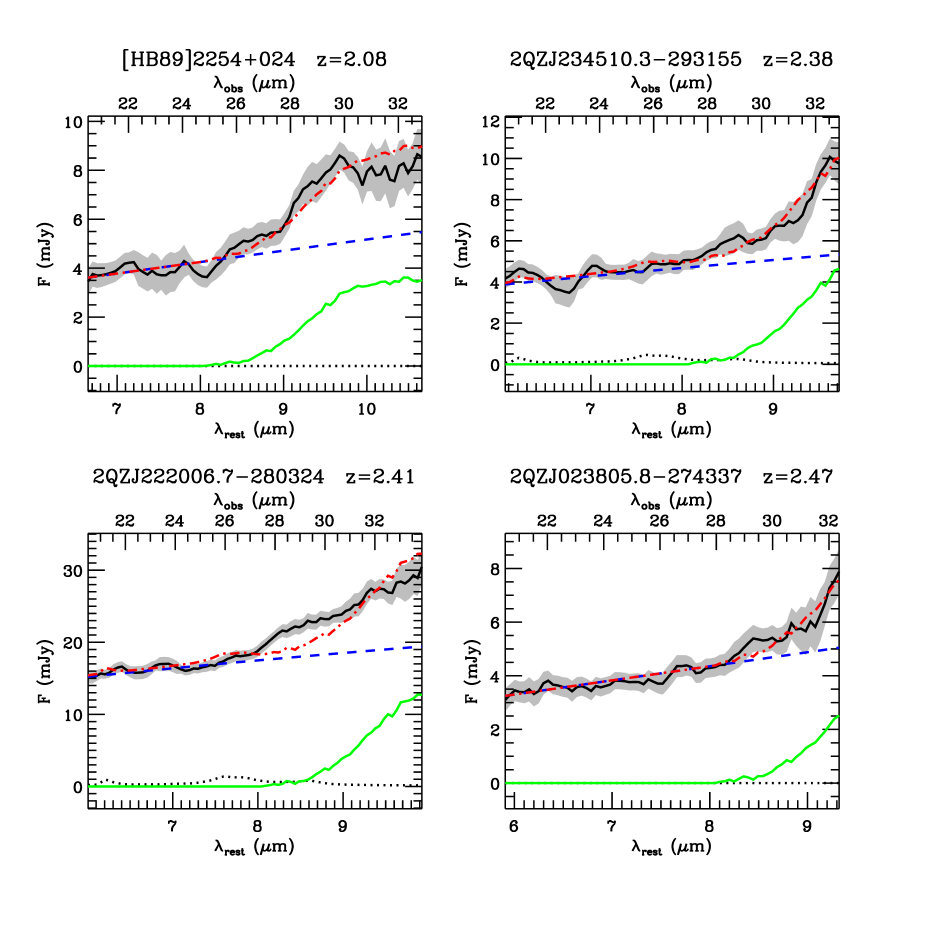
Fig. 1 shows the mean spectrum of all sources in the sample, except for the two which are likely dominated by synchrotron emission. Each spectrum has been normalized to 6.7m prior to averaging. The bottom panel shows the number of sources contributing to the mean spectrum in different spectral regions. We only consider the rest frame spectral range where at least 5 objects contribute to the mean spectrum. The spectrum at has been fitted with a simple power-law. While other workers in this field assumed more complicated continuum (e.g. spline, polynomial) we do not consider it justified given the limited wavelength range of our spectra. The extrapolation of the continuum to 10m clearly reveals an excess identified with Silicate emission. Fitting and measuring the strength of this feature is not easy given the limited rest-frame spectral coverage of our spectra. Therefore, we resort to the use of templates. In particular, we fit the Silicate feature by using as a template the (continuum-subtracted) silicate feature observed in the average spectrum of local QSOs as obtained by the QUEST project (Schweitzer et al., 2006) and kindly provided by M. Schweitzer. The template Silicate spectrum, with the best fitting scaling factor is shown in green in Fig. 1, while the red dot-dashed line shows the resulting fit including the power-law. We adopt the definition of “silicate strength” given in (Shi et al., 2006) which is the ratio between the maximum of the silicate feature and the interpolated featureless continuum at the same wavelength. In the QSO-QUEST template the maximum of the Silicate feature is at . This wavelength is slightly outside the band covered by our spectra but the uncertainty on the extrapolation is not large (the latter is included in the error estimate of the silicate strength). The silicate strength in the mean spectrum is 0.580.10 (Tab. 2).
We note that the average spectrum does not show evidence for PAH features at 7.7m and 6.2m. Such features are observed in lower luminosity AGNs. More specifically, a starburst template (Sturm et al., 2000) is not required by the fit shown in Fig. 1. In Sect. 4.3 we will infer an upper limit on the PAH luminosity and discuss its implication.
We clearly detect the blue wing of the silicate feature in four individual spectra, which are shown in Fig. 2. These spectra were fitted with a power-law and a silicate template exactly as the stacked spectrum. The resulting values for the Silicate strength are given in Tab. 2. The presence of silicate emission in all other cases is poorly constrained (or totally unconstrained) either because of low signal-to-noise (S/N) or because of a lack of spectral coverage. The one exception is Ton 618 which has a high S/N spectrum and a redshift (z=2.22) appropriate to observe the Silicate 10.5 m feature. No silicate emission is detected in this case, but note that this is not expected since the MIR radiation of this source is probably dominated by synchrotron emission.
3.2 A comparison with MIR properties of lower luminosity AGNs
To compare the MIR properties of our luminous QSOs with those of lower luminosity sources we have included in our study the IRS/MIR spectra of various low redshift, lower luminosity type-I AGNs. We purposely avoid type-II sources because of the additional complication due to absorption along the line of sight.
We have used data from Shi et al. (2006) who analyze the intensity of the silicate features in several, local AGNs with luminosities ranging from those of nearby Seyfert 1s to intermediate luminosity QSOs. We discarded BAL QSOs (which are known to have intervening gas and dust absorption) as well as dust reddened type-I nuclei (e.g. 2MASS red QSOs). We also discard those cases (e.g. 3C273) where the optical and MIR continuum is likely dominated by synchrotron radiation. Note that Shi et al. (2006) selected type-I objects with “high brightness” and, therefore, low-luminosity AGNs tend to be excluded from their sample.
Shi et al. (2006) provide a measure of the silicate feature strength (whose definition was adopted also by us). The continuum emission at 6.7m was measured by us from the archival spectra. We also subtracted from the 6.7m emission the possible contribution of a starburst component by using the M82 template. We estimate the host galaxy contribution (stellar photospheres) in all sources to be negligible.
We include in the sample of local Sy1s also some IRS spectra taken from the sample of Buchanan et al. (2006), whose spectral parameters were determined by us from the archival spectral, in the same manner as for the Shi et al. (2006) spectra. As for the previous sample, we discarded reddened/absorbed sources as well as those affected by synchrotron emission. As discussed in Buchanan et al. (2006), these spectra are affected by significant flux calibration uncertainties, due to the adopted mapping technique. Therefore, the spectra were re-calibrated by using IRAC photometric images. We discarded objects for which IRAC data are not available or not usable (e.g. because saturated). Finally, we also discarded data for which optical spectroscopic data are not available (see below).
The mid-IR parameters of the sources in both samples are listed in Tab. 2.
Optical data were mostly taken from Marziani et al. (2003) and BH masses and Eddington accretion rates inferred as in Shemmer et al. (2004). The resulting parameters are listed in Table 1.
The type-I sources in Shi et al. (2006) and Buchanan et al. (2006) are only used for the investigation of the covering factor and silicate strength, which are the main aims of our work. The Shi et al. (2006) and Buchanan et al. (2006) samples are not suitable for investigating the PAH features because most of these objects are at small distances and the IRS slit misses most of the star formation regions in the host galaxy. For what concerns the the PAH emission, we use the data in Schweitzer et al. (2006) who performed a detailed analysis of the PAH features in their local QSOs sample. The slit losses in those sources are minor. The Schweitzer et al. (2006) sample is also used for the investigation of the MIR-to-optical luminosity ratio. The mid-IR data of this sample are not listed in Tab. 2, since such data are already reported in Schweitzer et al. (2006) and in Netzer et al. (2007).
4 Discussion
4.1 Dust covering factor
4.1.1 Covering factor as a function of source luminosity and BH mass
The main assumption used here is that the covering factor of the circumnuclear dust is given by the ratio of the thermal infrared emission to the primary AGN radiation. The latter is mostly the “big blue bump” radiation with additional contribution from the optical and X-ray wavelength ranges (Blandford et al., 1990).
Determining the integral of the AGN-heated dust emission, and disentangling it from other spectral components is not simple. The FIR emission in type-I AGNs is generally dominated by a starburst component, even in QSOs (Schweitzer et al., 2006). In lower luminosity AGNs, the near-IR emission may be affected by stellar emission in the host galaxy, while in QSOs the near-IR light is often contributed also by the direct primary radiation. The MIR range () is where the contrast between AGN-heated dust emission and other components is maximal. This spectral region contains various spectral features, like PAHs and silicate emission, yet MIR spectra allow us to disentangle and remove these components, and determine the hot dust continuum. In particular, by focusing on the continuum emission at 6.7m, the uncertainty in the removal of PAH emission is minimized, while the contribution from the Silicate emission is totally negligible at this wavelength (note that such a spectral decomposition is unfeasible with photometric data). If the spectral shape of the AGN-heated dust does not change from object to object (and in particular it does not change significantly with luminosity), then the 6.7m emission is a proxy of the global circumnuclear hot dust emission. It is possible to infer a quantitative relation between L(6.7m) and the total AGN-heated hot dust emission through the work of Silva et al. (2004), who use observations of various nearby AGNs to determine their average, nuclear IR SED (divided into absorption classes). From their type I AGNs SED, we find that the integrated nuclear, thermal IR bump is about . This ratio is also consistent with that found in the QUEST QSO sample, once the contribution by the silicate features is subtracted.
Regarding the primary optical-UV radiation, determining its integrated flux would require observations of the entire intrinsic spectral energy distribution (SED) from the far-UV to the near-IR. This is not available for most sources in our sample. Moreover, there are indications that the SED is luminosity dependent (e.g. Scott et al., 2004; Shang et al., 2005) and thus an estimate of the bolometric luminosity of the primary continuum based on the observed luminosity in a certain band is somewhat uncertain. Notwithstanding these limitations, we assume in this work that the optical continuum luminosity can be used as a proxy of the bolometric luminosity of the primary continuum. We use the continuum luminosity at the rest frame wavelength of 5100Å, (, hereafter L5100) because it is directly measured for all sources in our sample. We can infer the ratio between the bolometric luminosity and L5100 from the mean spectrum of QSOs obtained in recent studies, mostly the results of Scott et al. (2004) and Richards et al. (2006). These studies indicate a bolometric correction in the range of 5–9. Here we chose, rather arbitrarily, the mean value of 7.
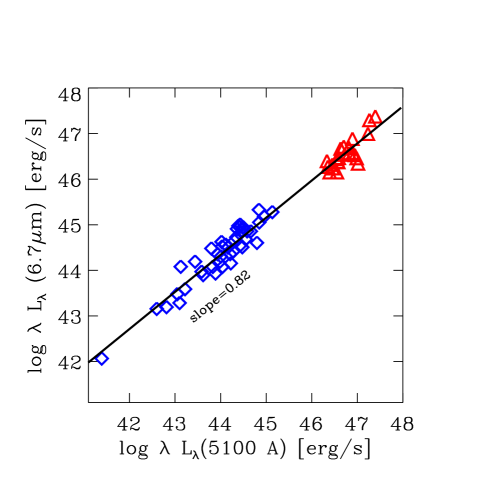
The comparison of L(6.7m) and L5100 is our way of deducing the hot dust covering factor. Fig. 3 shows the versus L5100 for our sample. Red triangles are the high-z, luminous QSOs and blue diamonds are local type-I AGNs. Not surprisingly, the two quantities show a good correlation. However, the very large luminosity range spanned by our sample allows us to clearly state that the correlation is not linear, but has a slope defined by
| (1) |
where and luminosities are expressed in . This indicating that the MIR, reprocessed emission increases more slowly than the primary luminosity.
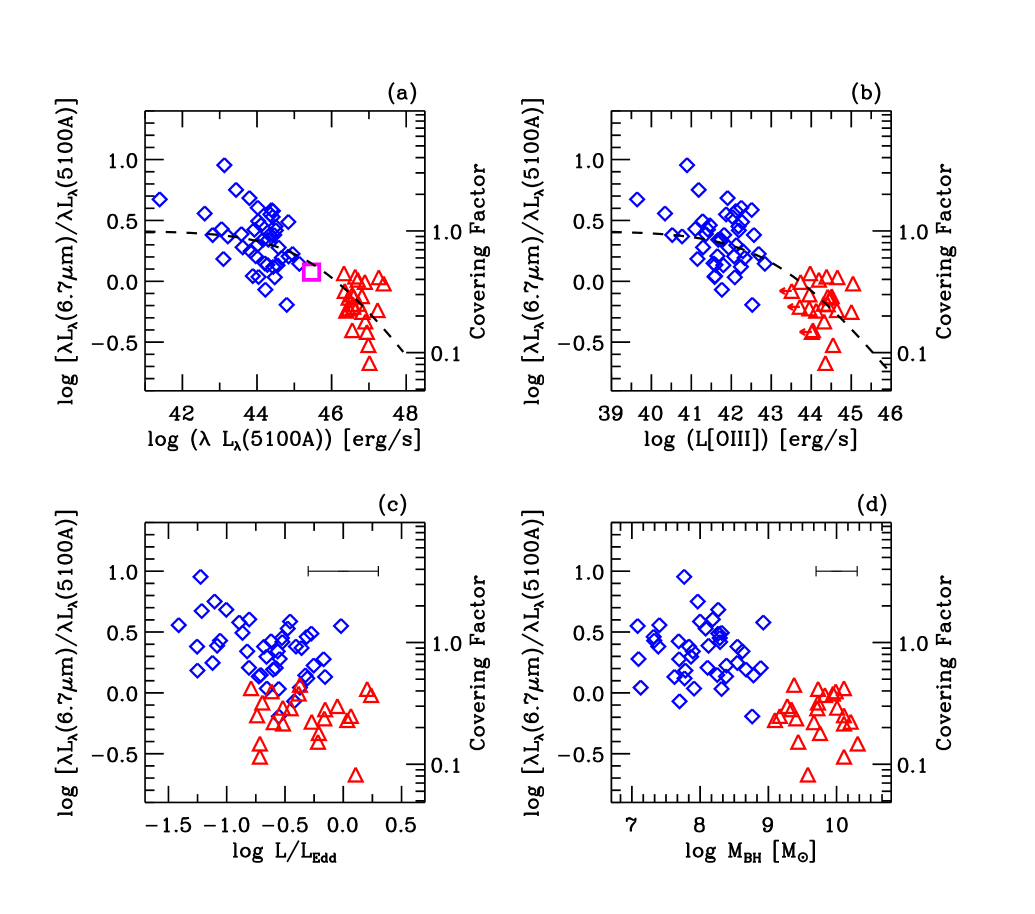
The same phenomenon is observed in a cleaner way in Fig. 4a, where the ratio between the two continuum luminosities is plotted as a function of L5100. There is a clear anti-correlation between the MIR–to–optical ratio and optical luminosity. Fig. 4b shows the same MIR–to–optical ratio as a function of L([OIII]5007) as an alternative tracer of the global AGN luminosity (although the latter is not a linear tracer of the nuclear luminosity, as discussed in Netzer et al., 2006), which displays the same anti-correlation as for the continuum optical flux. Spearman-rank coefficients and probabilities for these correlations are given in Tab. 3.
According to the above discussion, an obvious interpretation of the decreasing MIR–to–optical ratio is that the covering factor of the dust surrounding the AGN decreases with luminosity. In particular, if the covering factor is proportional to the MIR–to–optical ratio, then Figs. 4a-b indicate that the dust covering factor decreases by about a factor 10 over the luminosity range probed by us.
It is possible to convert the MIR–to–optical luminosity ratio into absolute dust covering factor by assuming ratios of broad band to monochromatic continuum luminosities observed in AGNs, as discussed above. In particular, by using the 6.7m–to–MIR and 5100Å–to–bolometric luminosity ratios reported above, we obtain that the absolute value of the dust covering factor (CF) can be written as:
| (2) |
In Fig. 4 the axes on the right hand side provide the dust covering factor inferred from the the equation above. A fraction of objects have covering factor formally larger than one, these could be due to uncertainties in the observational data, or nuclear SED differing from the ones assumed above, or to optical variability, as discussed in Sect. 4.1.2. The dust covering factor ranges from about unity in low luminosity AGNs to about 10% in high luminosity QSOs. As it will be discussed in detail in Sect. 4.1.3, the dust covering factor is expected to be equal to the fraction of type 2 (obscured) AGNs relative to the total AGN population. The finding of a large covering factor in low luminosity AGNs is in agreement with the large fraction of type 2 nuclei observed in local Seyferts (, Maiolino & Rieke, 1995).
A similar result has been obtained, in an independent way, through the finding of a systemic decrease of the the obscured to unobscured AGN ratio as a function of luminosity in various surveys. The comparison with these results will be discussed in more detail in the next section.
The physical origin of the decreasing covering factor is still unknown. One possibility is that higher luminosities imply a larger dust sublimation radius: if the obscuring medium is distributed in a disk with constant height, then a larger dust sublimation radius would automatically give a lower covering factor of dust at higher luminosities (Lawrence, 1991). However, this effect can only explain the decreasing covering factor with luminosity for the dusty medium, and not for the gaseous X-ray absorbing medium. Moreover, Simpson (2005) showed that the simple scenario of such a “receding torus” is unable to account for the observed dependence of the type 2 to type 1 AGN ratio as a function of luminosity.
Another possibility is that the radiation pressure on dust is stronger, relative to the BH gravitational potential, in luminous AGNs (e.g. Laor & Draine, 1993; Scoville & Norman, 1995), thus sweeping away circumnuclear dust more effectively. In this scenario a more direct relation of the covering factor should be with , rather than with luminosity. Our sample does not show such a relation, as illustrated in Fig. 4c. However, the uncertainties on the accretion rates (horizontal error bar in Fig. 4c) may hamper the identification of such a correlation.
Lamastra et al. (2006) proposed that, independently of luminosity, the BH gravitational potential is responsible for flattening the circumnuclear medium, so that larger BH masses effectively produce a lower covering factor. According to this scenario, the relation between covering factor and luminosity is only an indirect one, in the sense that more luminous AGN tend to have larger BH masses (if the Eddington accretion rate does not change strongly on average). Fig. 4d shows the MIR–to–optical ratio (and dust covering factor) as a function of BH mass, indicating a clear (anti-)correlation between these two quantities. However, the correlation is not any tighter than the relation with luminosity in Fig. 4a-b, as quantified by the comparison of the Spearman-rank coefficients and probabilities in Tab. 3. The degeneracy between luminosity and BH mass prevents us to discriminate which of the two is the physical quantity driving the relation.
4.1.2 Model uncertainties
In this section we discuss some possible caveats in our interpretation of the MIR–to–optical ratio as an indicator of the hot dust covering factor.
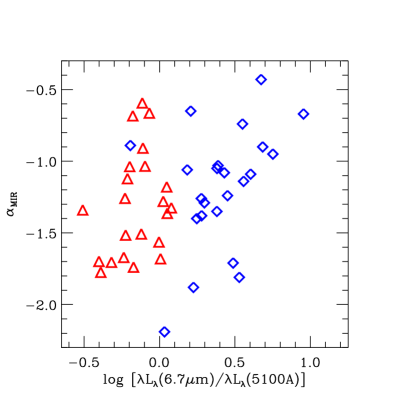

Our analysis assumes that the shape of the hot dust IR spectrum SED is not luminosity dependent. However, an alternative interpretation of the trends observed in Fig. 4 could be that the dust temperature distribution changes with luminosity. Yet, to explain the decreasing 6.7m to 5100Å flux ratio in terms of dust temperature would require that the circumnuclear dust is cooler at higher luminosities. This, besides being contrary to expectations, is ruled out by the observations which show no clear correlation between the mid-IR continuum slope (which is associated with the average dust temperature) and the MIR–to–optical ratio, as illustrated in Fig. 5 and in Tab. 3. The one remarkable exception is SDSSJ173352.22+540030.5, which has the most negative mid-IR continuum slope (, i.e. an inverted spectrum in ) and the lowest MIR-to-optical ratio of the whole sample (), which is out of scale in Fig. 5. This QSO may be totally devoid of circumnuclear hot dust, and its MIR emission may simply be the continuation of the optical “blue-bump”. Similar high-z QSOs, with an exceptional deficiency of mir-MIR flux, have been reported by Jiang et al. (2006).
As explained earlier, there are indications that the UV-optical SED, and hence the bolometric correction based to the observed L5100, are luminosity dependent. If correct, this would mean a smaller bolometric correction for higher L5100 sources which would flatten the relationship found here (i.e. will result in a slower decrease of the covering factor with increasing L5100). However, the expected range (a factor of at most 2 in bolometric correction) is much smaller than the deduced change in covering factor.
Variability is an additional potential caveat because of the time delay between the original L5100 “input” and the response of the dusty absorbing “torus”. While we do not have the observations to test this effect (multi-epoch, high-quality optical spectroscopic data are available only for a few sources in our sample), we note that the location of the 6.7m emitting gas from the central accretion disk is at least several light years and thus L(MIR) used here reflects the mean L5100 in most sources. We expect that the average luminosity of a large sample will not be affected much by individual source variations. Moreover, in the high luminosity sources of our sample we do not expect much variability (since luminous QSOs are known to show little or no variability).
An alternative, possible explanation of the variation of the optical-to-MIR luminosity ratio could be dust extinction affecting the observed optical flux. Optical dust absorption increasing towards low luminosities may in principle explain the trends observed in Fig. 4. However, we have pre-selected the sample of local QSOs and Sy1s to avoid objects showing any indication of absorption, thus probably shielding us from such spurious effects. Yet, we have further investigated the extinction scenario by analyzing the optical-to-UV continuum shape of our sample. The optical-UV continuum slope does not necessarily trace dust reddening, since intrinsic variations of the continuum shape are known to occur, as discussed above. Variability introduce additional uncertainties, since optical and UV data are not simultaneous. However, if the variations of are mostly due to dust reddening, one would expect the MIR-to-optical ratio to correlate with the optical-UV slope, at least on average. We have compiled UV rest-frame continuum fluxes (at ) from spectra in the literature or in the HST archive. By combining such data with the continuum luminosities at we inferred the optical-UV continuum slope defined as222Our definition of power law index is linked to the given in Vanden Berk et al. (2001) by the relation . Our distribution of is roughly consistent (within the uncertainties and the scatter) with obtained by Vanden Berk et al. (2001) for the SDSS QSO composite spectrum (see also Shemmer et al., 2004). , as listed in Tab. 1. Fig. 6 shows versus . The arrow indicates the effect of dust reddening with mag (by assuming a SMC extinction curve, as appropriate for type 1 AGNs, Hopkins et al., 2004), which would be required to account for the observed variations of . Fig. 6 does not show evidence for any (positive) correlation between and (see also Tab 3). In particular, if the variation of MIR-to-optical ratio (spanning more than a factor of ten) was due to dust reddening, we would expect to find (as indicated by the arrow in Fig. 6), which is clearly not observed. If any, the data show a marginal anti-correlation between and (Tab. 3), i.e. opposite to that expected from dust reddening.
Finally, possible evolutionary effects on the dust covering factor have not been considered. We have been comparing local objects with QSOs at z2–3 yet assumed that only luminosity or BH mass plays a role. La Franca et al. (2005) and Akylas et al. (2006) find evidence for an increasing fraction of obscured AGNs as a function of redshift, a result which is still debated (see Ueda et al., 2003; Gilli et al., 2007). If the absorbing medium covering factor really increases with redshift, then the actual dependence of the covering factor on luminosity would be stronger than shown in Fig. 4. Indeed, according to La Franca et al. (2005) and Akylas et al. (2006), putative low-z counterparts of our high-z QSOs (matching the same luminosities) should be affected by an even lower covering factor. As a consequence, the diagrams in Figs. 4 and 7 should have even steeper trends once the data are corrected for such putative evolutionary effects, thus strengthening our conclusions.
4.1.3 Comparison with previous works
Wang et al. (2005) used IRAS and ISO mid-IR data of (mostly local) PG quasars to infer their dust covering factor. They find that the covering factor decreases as a function of X-ray luminosity. They probe a narrower luminosity range with respect to our work, nonetheless their results are generally consistent with ours, although with significant scatter.
More recently Richards et al. (2006) derived the broad band SED of a large sample of SDSS QSOs by including Spitzer photometric data. Although such data do not have spectroscopic information, they can be used to obtain a rough indication of the dust covering factor in their QSO sample, to be compared with our result. The average optical luminosity of the Richards et al. (2006) sample is . From their mean SED we derive . The corresponding location on the diagram of Fig. 4a is marked with a magenta square, and it is in agreement with the general trend of our data.
In a companion paper, Gallagher et al. (2007) use the same set of data to investigate the MIR-to-optical properties as a function of luminosity. They find a result similar to ours, i.e. the MIR-to-optical ratio decreases with luminosity. However, they interpret such a result as a consequence of dust reddening in the optical, since the effect is stronger in QSOs with redder optical slope. As discussed in the previous section, our data do no support this scenario, at least for our sample. In particular, the analysis of the optical-UV slope indicates that dust reddening does not play a significant role in the variations of the MIR-to-optical luminosity ratio. The discrepancy between our and Gallagher et al. (2007) results may have various explanations. The QSOs in the Gallagher et al. (2007) sample span about two orders of magnitudes in luminosity, while we have seen that to properly quantify the effect a wider luminosity range is required. Moreover, the majority of their sources are clustered around the mean luminosity of . In addition, the the lack of spectroscopic information makes it difficult to allow for the presence of other spectral features such as the silicate emission which, as we show later, is luminosity dependent. The lack of spectroscopic information may be an issue specially for samples spanning a wide redshift range (as in Gallagher et al., 2007), where the photometric bands probe different rest-frame bands. The same concerns applies for the optical luminosities. Our rest-frame continuum optical luminosities are always inferred through rest-frame optical spectra, even at high-z (through near-IR spectra). Gallagher et al. (2007) do not probe directly the optical continuum luminosity of high-z sources (at high-z they only have optical and Spitzer data, which probe UV and near-IR rest-frame, respectively). Finally, differences between our and Gallagher et al. (2007) results may be simply due to the different samples. As discussed in the previous section, we avoided dust reddened targets, thus making us little sensitive to extinction effects, while Gallagher et al. (2007) sample may include a larger fraction of reddened objects.
A decreasing dust covering factor as a function of luminosity must translate into a decreasing fraction of obscured AGNs as a function of luminosity. The effect has been noted in various X-ray surveys (Ueda et al., 2003; Steffen et al., 2003; La Franca et al., 2005; Akylas et al., 2006; Barger et al., 2005; Tozzi et al., 2006; Simpson, 2005), although the results have been questioned by other authors (e.g. Dwelly & Page, 2006; Treister & Urry, 2005; Wang et al., 2007). The X-ray based studies do not distinguish between dust and gas and thus probe mostly trends of the gaseous absorption. Our result provides an independent confirmation of these trends. Moreover, our findings are complementary to those obtained in the X-rays since, instead of the covering factor of gas, we probe the covering factor of dust.
In order to compare our findings with the results obtained from X-ray surveys, we have derived the expected fraction of obscured AGNs by fitting the dust covering factor versus luminosity relation with an analytical function. Instead of using the simple power-law illustrated in Fig. 3 (Eq. 1) we fit the dependence of the covering factor on luminosity with a broken power-law. The latter analytical function is preferred both because it provides a statistically better fit and because a simple power-law would yield a covering factor larger than unity at low luminosities. As a result we obtain the following best fit for the fraction of obscured AGNs as a function of luminosity:
| (3) |
where is the fraction of obscured AGNs relative to the total and
| (4) |
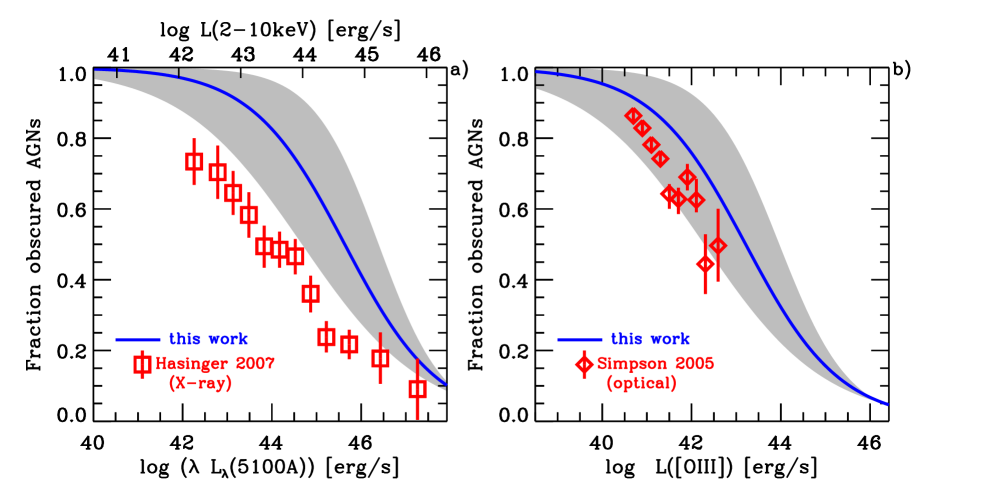
The resulting fit is shown with a dashed line in Fig. 4a. The fraction of obscured AGNs as a function of luminosity is also reported with a blue, solid line in Fig. 7a. The shaded area reflects the uncertainty in the bolometric correction discussed above.
The most recent and most complete investigation on the fraction of X-ray obscured AGNs as a function of luminosity has been obtained by Hasinger (2007, in prep., see also Hasinger, 2004) who combined the data from surveys of different areas and limiting fluxes to get a sample of 700 objects. We convert from X-ray to optical luminosity by using the non-linear relation obtained by Steffen et al. (2006). The latter use flux densities at 2 keV and 2500Å; we adapt their relation to our reference optical wavelength (5100Å) by assuming the optical-UV spectral slope obtained by Vanden Berk et al. (2001), and to the 2–10 keV integrated luminosity (adopted in most X-ray surveys) by assuming a photon index of –1.7, yielding the relation
| (5) |
(where luminosities are in units of ). Fig. 7a compares the fraction of obscured AGN obtained by Hasinger (2007) through X-ray surveys with our result based on the covering factor of hot dust. Both have the same trends with luminosity, but the fraction of obscured AGN expected from the hot dust covering factor is systematically higher. Such an offset is however expected. Indeed, current high redshift X-ray surveys do not probe the Compton thick population of obscured AGNs since these are heavily absorbed even in the hard X-rays. In local AGNs, Compton thick nuclei are about as numerous as Compton thin ones (Risaliti et al., 1999; Guainazzi et al., 2005; Cappi et al., 2006). The fraction of Compton thick, high luminosity, high redshift AGNs is still debated, but their contribution certainly makes the fraction of X-ray obscured AGNs higher than inferred by Hasinger (2007), who can only account for Compton thin sources. The ratio between the dust covering factor curve in Fig. 7a and the X-ray data from Hasinger (2007), indicates that the ratio between the total number of obscured AGNs (including Compton thick ones) and Compton thin ones is about 2 even at high luminosities, i.e. consistent (within uncertainties) with local, low-luminosity AGNs.
An analogous result on the decreasing fraction of obscured AGNs as a function of luminosity was obtained by Simpson (2005) who compared the numbers of type 2 and type 1 AGNs at a given L([OIII]5007). To compare with Simpson (2005), we used our sample to derive the following analytical description for the fraction of obscured AGN as a function of L([OIII]5007):
| (6) |
where is the fraction of obscured AGNs relative to the total and
| (7) |
The corresponding fit is shown with a dashed line in Fig. 4b, and the fraction of obscured AGNs as a function of is also shown with a blue line in Fig. 7b. In the latter figure we also compare the fraction of obscured AGNs obtained by Simpson (2005) with our result based on the covering factor of the hot dust. There is a good agreement (within uncertainties) between the fraction of obscured AGNs inferred through the two methods, as expected since both optical surveys and our method probe the covering factor of dust. However, we shall also mention that the results obtained by Simpson (2005) have been questioned by Haas et al. (2005), by arguing that at high luminosities, the derived L([OIII]5007) may be affected by a large scale absorber.
4.2 Silicate emission
In this paper we have presented the most luminous (type 1) QSOs where Silicate emission has been detected so far. When combined with MIR spectra of lower luminosity sources, it is possible to investigate the properties and behavior of this feature over a wide luminosity range.
The discovery of silicate emission in the spectrum of (mostly type 1) AGNs obtained by Spitzer was regarded as the solution of a long standing puzzle on the properties of the circumnuclear dusty medium. Indeed, silicate emission was expected by various models of the dusty torus. However, the absence of clear detections prior to the Spitzer epoch induced various authors to either postulate a very compact and dense torus (e.g. Pier & Krolik, 1993) or different dust compositions (Laor & Draine, 1993; Maiolino et al., 2001a, b). Initial Spitzer detections of silicate emission relaxed the torus model assumptions (Fritz et al., 2006), but more detailed investigations revealed a complex scenario. The detection of silicate emission even in type 2 AGNs (Sturm et al., 2006b; Teplitz et al., 2006; Shi et al., 2006) suggested that part of the silicate emission may originate in the Narrow Line Region (NLR) (Efstathiou, 2006). Further support for a NLR origin of the silicate emission comes from the temperature inferred for the Silicate features, which is much lower (200 K) than for the circumnuclear dust emitting the featureless MIR continuum (500 K), as well as from MIR high resolution maps spatially resolving the silicate emission on scales of 100 pc (Schweitzer et al. in prep.).
If most of the observed silicate emission originates in the NLR, then the effects of circumnuclear hot dust covering factor should be amplified when looking at the “silicate strength” (which we recall is defined as the ratio of the silicate maximum intensity and the featureless hot dust continuum). Indeed, if the covering factor of the circumnuclear dusty torus decreases, it implies that the MIR hot dust continuum decreases and the silicate emission increases because a larger volume of the NLR is illuminated. Both effects go in the same direction of increasing the “silicate strength”. This scenario is made more complex by the tendency of the NLR to disappear at very high luminosities, or to get very dense and not to scale linearly with the nuclear luminosity (Netzer et al., 2004, 2006). Moreover, the schematic division of a silicate feature totally emitted by the NLR and a MIR featureless continuum totally emitted by the inner side of the obscuring torus is probably too simplistic. There must be at least a small contribution to the featureless MIR continuum from dust in the NLR, while some silicate emission is probably also coming from the obscuring torus. However, from a general qualitative point of view we expect a monotonic behavior of the “silicate strength” with the physical quantity responsible for the changes in the hot dust covering factor.
Before investigating the various trends of the Silicate strength, we mention that by using the four silicate detections shown in Fig. 2 and listed in Tab. 2, we may in principle introduce a bias against weak silicate emitters. Indeed, although we cannot set useful upper limits on the silicate strength in most of the other objects, we have likely missed objects with low silicate strength. However, the mean spectrum in Fig. 1 includes all QSOs in our sample, and therefore its silicate strength should be representative of the average Silicate emission in the sample (at least for the objects at z2.5, which are the ones where the observed band includes the silicate feature, and which are the majority).
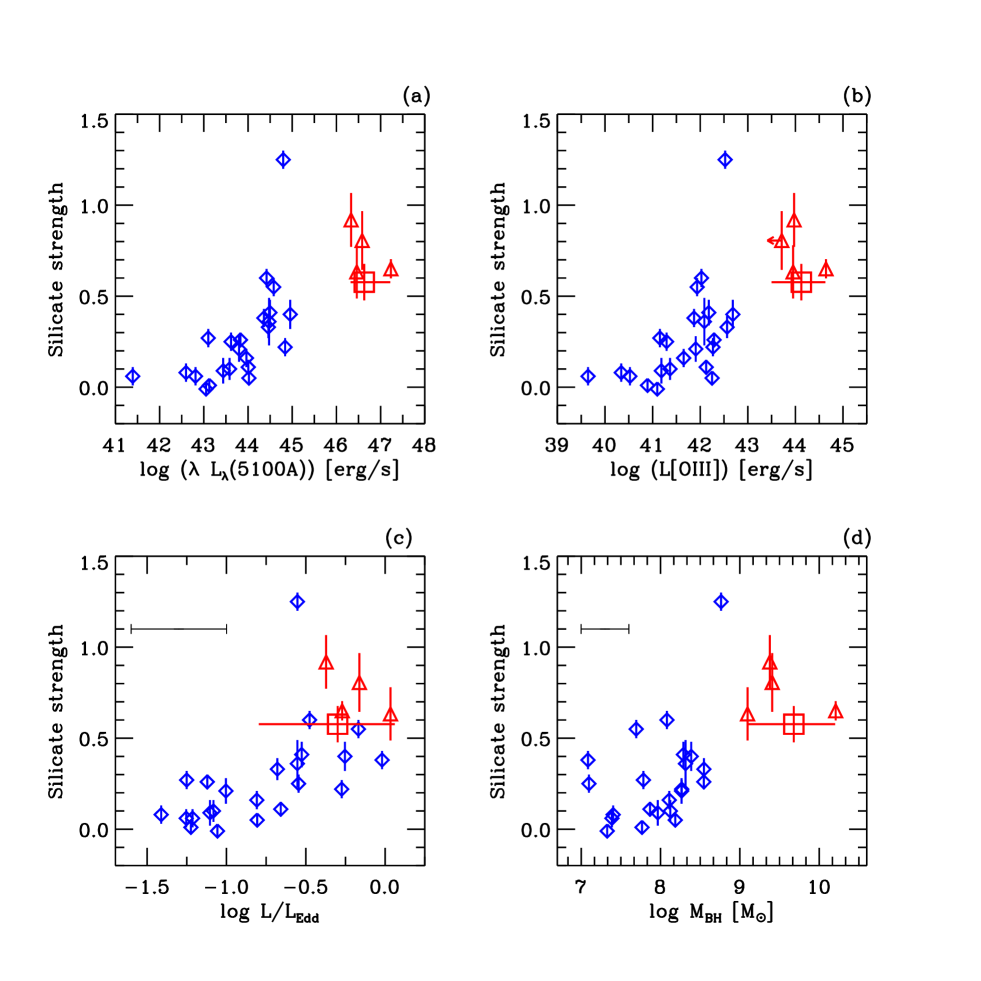
Figs. 8a-b show the silicate strength of the objects in our combined sample as functions of L5100 and L([OIII]5007). The red square indicates the silicate strength in the high-z QSO mean spectrum, while its horizontal bar indicates the range of luminosities spanned by the subsample of objects at z2.5 (i.e. those contributing to the silicate feature in the mean spectrum). Low redshift AGNs and high redshift QSOs show an apparently clear correlation between silicate strength and luminosity. Although with a significant spread, the Silicate strength is observed to positively correlate also with the accretion rate and with the BH mass, as shown in Figs. 8c-d. Essentially, the correlations observed for the Silicate strength reflects the same correlation observed for the (with the exception of the accretion rate), in agreement with the idea that also the Silicate strength is a proxy of the covering factor of the circumnuclear hot dust, for the reasons discussed above.
Unfortunately, the correlations observed for the Silicate strength do not improve our understanding on the origin of the decreasing covering factor with luminosity, i.e. whether the driving physical quantity is the luminosity itself, the accretion rate or the black hole mass. Formally, the correlation between Silicate strength and optical continuum luminosity is tighter than the others (Tab. 3), possibly hinting at the luminosity itself as the quantity driving the dust covering factor. However, there are a few low luminosity objects, such as a few LINERs, which have large silicate strengths (Sturm et al., 2005) and which clearly deviate from the correlation shown in Fig. 8a, thus questioning the role of luminosity in determining the Silicate strength. In addition, the apparently looser correlations of Silicate strength versus accretion rate and BH mass may simply be due to the additional uncertainties affecting the latter two quantities (horizontal, black error bars in Figs. 8c,d).
4.3 PAHs and star formation
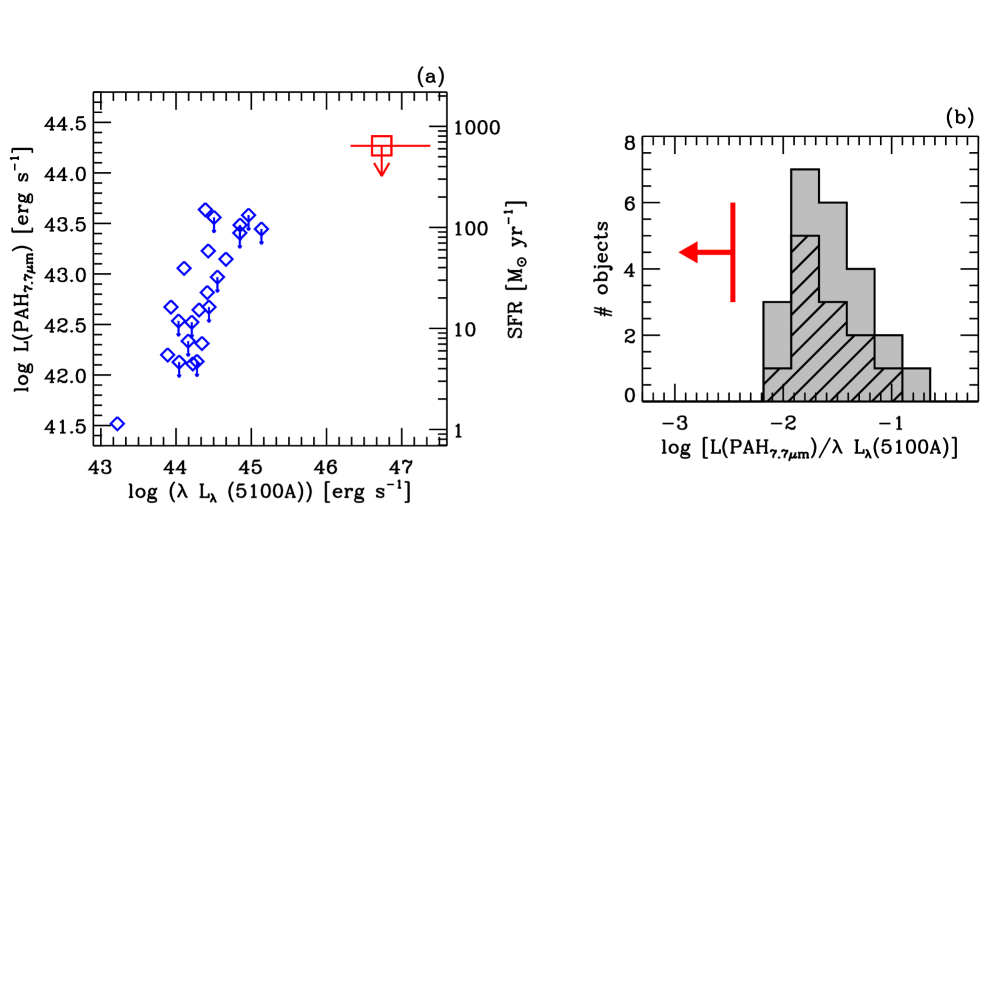
The presence and intensity of star formation in QSOs has been a hotly debated issue during the past few years. A major step forward in this debate was achieved by Schweitzer et al. (2006) through the Spitzer IRS detection of PAH features in a sample of nearby QSOs, revealing vigorous star formation in these objects. The analysis also shows that the far-IR emission in these QSOs is dominated by star formation and that the star forming activity correlates with the nuclear AGN power. Here we show in Fig. 9 the latter correlation in terms of PAH(7.7m) luminosity versus L5100 by using the PAH luminosities from the sample of Schweitzer et al. (2006) and the corresponding optical data from Marziani et al. (2003). Although the large fraction of upper limits in the former sample prevents a careful statistical characterization, Fig. 9 shows a general correlation between QSO optical luminosity and starburst activity in the host galaxy as traced by the PAH luminosity.
The scale on the right hand side of Fig. 9 translates the 7.7m PAH luminosity into star formation rate (SFR). This was obtained by combining the average ratio obtained by Schweitzer et al. (2006) for the starburst dominated QSOs in their sample with the given in Kennicutt (1998), yielding
| (8) |
The average spectrum of high-z, luminous QSOs in Fig. 1 does not show evidence for the presence of PAH features and can only provide an upper limit on the PAH flux relative to the flux at 6.7m (since all spectra were normalized to the latter wavelength prior to computing the average). However, we can derive an upper limit on the PAH luminosity by assuming the average distance of the sources in the sample. The inferred upper limit on the PAH luminosity is reported with a red square in Fig. 9a, and it is clearly below the extrapolation of the relation found for local, low-luminosity QSOs. This is shown more clearly in Fig. 9b which shows the distribution of the ratio for local QSOs (histogram) and the upper limit inferred from the average spectrum of high-z, luminous QSOs (red solid line). The corresponding upper limit on the SFR is .
Note that certainly there are luminous, high-z QSOs with larger star formation rates (e.g. Bertoldi et al., 2003; Beelen et al., 2006; Lutz et al., 2007). However, since our sample is not pre-selected in terms of MIR or FIR emission, our result is not biased in terms of star formation and dust content, and therefore it is representative of the general high-z, luminous QSO population.
Our results indicate that the relation between star formation activity, as traced by the PAH features, and QSO power, as traced by L5100, saturates at high luminosity. This result is not surprising. Indeed, if high-z, luminous QSOs were characterized by the same average observed in local QSOs, this would imply huge star formation rates of at . On the contrary, the few high-z QSOs detected at submm-mm wavelengths have far-IR luminosities corresponding to SFR of about (Omont et al., 2003). The majority of high-z QSO (70%) are undetected at submm-mm wavelengths. The mean mm-submm fluxes of QSOs in various surveys (including both detections and non-detections) imply SFRs in the range (Omont et al., 2003; Priddey et al., 2003), in fair agreement with our finding, especially if we consider the uncertainties involved in the two different observational methods to infer the SFR.
We also note that a similar, independent result was obtained by Haas et al. (2003), who found that in a large sample of QSOs the ratio between (powered by star formation) and decreases at high luminosities.
The finding of a “saturation” of the relation between star formation activity and QSO power may provide an explanation for the evolution of the relation between BH mass and galaxy mass at high redshift. Indeed, Peng et al. (2006) and McLure et al. (2006) found that, for a given BH mass, QSO hosts at z2 are characterized by a stellar mass lower than expected from the local BH-galaxy mass relation. In other terms, the BH growth is faster, relative to star formation, in high-z, luminous QSOs. Our result supports this scenario by independently showing that the correlation between star formation and AGN activity breaks down at high luminosities.
5 Conclusions
We have presented low resolution, mid-IR Spitzer spectra of a sample of 25 luminous QSOs at high redshifts (). We have combined our data with Spitzer spectra of lower luminosity, type-I AGNs, either published in the literature or in the Spitzer archive. The combined sample spans five orders of magnitude in luminosity, and allowed us to investigate the dust properties and star formation rate as a function of luminosity. The spectroscopic information allowed us to disentangle the various spectral components contributing to the MIR band (PAH and silicate emission) and to sample the continuum at a specific , in contrast to photometric MIR observations. The main results are:
-
•
The mid-IR continuum luminosity at 6.7m correlates with the optical continuum luminosity but the correlation is not linear. In particular, the ratio decreases by about a factor of ten as a function of luminosity over the luminosity range . This is interpreted as a reduction of the covering factor of the circumnuclear hot dust as a function of luminosity. This result is in agreement and provides an independent confirmation of the recent findings of a decreasing fraction of obscured AGN as a function of luminosity, obtained in X-ray and optical surveys. We stress that while X-ray surveys probe the covering factor of the gas, our result provides an independent confirmation by probing the covering factor of the dust. We have also shown that the dust covering factor, as traced by the ratio, decreases also as a function of the BH mass. Based on these correlations alone it is not possible to determine whether the physical quantity primarily driving the reduction of the covering factor is the AGN luminosity or the BH mass.
-
•
The mean spectrum of the luminous, high-z QSOs in our sample shows a clear silicate emission at . Silicate emission is also detected in the individual spectra of four high redshift QSOs. When combined with the spectra of local, lower luminosity AGNs we find that the silicate strength (defined as the ratio between the maximum of the silicate feature and the extrapolated featureless continuum) tend to increase as a function of luminosity. The silicate strength correlates positively also with the accretion rate and with the BH mass, albeit with a large scatter.
-
•
The mean MIR spectrum of the luminous, high-z QSOs in our sample does not show evidence for PAH emission. Our sample is not pre-selected by the FIR emission and therefore it is not biased in terms star formation. As a consequence, the upper limit on the PAH emission in the total mean spectrum provides a useful, representative upper limit on the SFR in luminous QSOs at high redshifts. We find that the ratio between PAH luminosity and QSO optical luminosity is significantly lower than observed in local, lower luminosity AGNs, implying that the correlation between star formation rate and AGN power probably saturates at high luminosities. This result may explain the evolution of the correlation between BH mass and galaxy stellar mass recently observed in luminous QSOs at high redshift.
Acknowledgements.
We are grateful to M. Salvati for useful comments. We are grateful to G. Hasinger for providing us with some of his results prior to publication. This work is based on observations made with the Spitzer Space Telescope, which is operated by the Jet Propulsion Laboratory, California Institute of Technology under a contract with NASA. Support for this work was provided by NASA under contract 1276513 (O.S.). RM acknowledges partial support from the Italian Space Agency (ASI). MI is supported by Grants-in-Aid for Scientific Research (16740117). OS acknowledges support by the Israel Science Foundation under grant 232/03.References
- Akylas et al. (2006) Akylas, A., Georgantopoulos, I., Georgakakis, A., Kitsionas, S., & Hatziminaoglou, E. 2006, A&A, 459, 693
- Armus et al. (2004) Armus, L., et al. 2004, ApJS, 154, 178
- Barger et al. (2005) Barger, A. J., Cowie, L. L., Mushotzky, R. F., Yang, Y., Wang, W.-H., Steffen, A. T., & Capak, P. 2005, AJ, 129, 578
- Baskin & Laor (2005) Baskin, A., & Laor, A. 2005, MNRAS, 356, 1029
- Beelen et al. (2006) Beelen, A., Cox, P., Benford, D. J., Dowell, C. D., Kovács, A., Bertoldi, F., Omont, A., & Carilli, C. L. 2006, ApJ, 642, 694
- Bertoldi et al. (2003) Bertoldi, F., Carilli, C. L., Cox, P., Fan, X., Strauss, M. A., Beelen, A., Omont, A., & Zylka, R. 2003, A&A, 406, L55
- Bressan et al. (2006) Bressan, A., et al. 2006, ApJ, 639, L55
- Buchanan et al. (2006) Buchanan, C. L., Gallimore, J. F., O’Dea, C. P., Baum, S. A., Axon, D. J., Robinson, A., Elitzur, M., & Elvis, M. 2006, AJ, 132, 401
- Cappi et al. (2006) Cappi, M., et al. 2006, A&A, 446, 459
- Dietrich et al. (2002) Dietrich, M., Appenzeller, I., Vestergaard, M., & Wagner, S. J. 2002, ApJ, 564, 581
- Dong & De Robertis (2006) Dong, X. Y., & De Robertis, M. M. 2006, AJ, 131, 1236
- Dwelly & Page (2006) Dwelly, T., & Page, M. J. 2006, MNRAS, 372, 1755
- Engels et al. (1998) Engels, D., Hagen, H.-J., Cordis, L., Koehler, S., Wisotzki, L., & Reimers, D. 1998, A&AS, 128, 507
- Efstathiou (2006) Efstathiou, A. 2006, MNRAS, 371, L70
- Evans & Koratkar (2004) Evans, I. N., & Koratkar, A. P. 2004, ApJS, 150, 73
- Fritz et al. (2006) Fritz, J., Franceschini, A., & Hatziminaoglou, E. 2006, MNRAS, 366, 767
- Förster Schreiber et al. (2004) Förster Schreiber, N. M., Roussel, H., Sauvage, M., & Charmandaris, V. 2004, A&A, 419, 501
- Gallagher et al. (2007) Gallagher, S.C., et al. 2007, ApJ, in press (astro-ph/0702272)
- Gilli et al. (2007) Gilli, R., Comastri, A., Hasinger, G. 2007, A&A, in press (astro-ph/0610939)
- Guainazzi et al. (2005) Guainazzi, M., Matt, G., & Perola, G. C. 2005, A&A, 444, 119
- Haas et al. (2003) Haas, M., et al. 2003, A&A, 402, 87
- Haas et al. (2005) Haas, M., Siebenmorgen, R., Schulz, B., Krügel, E., & Chini, R. 2005, A&A, 442, L39
- Hasinger (2004) Hasinger, G. 2004, in The X-ray background and AGNs, Nuclear Physics B Proceedings Supplements, Vol. 132, p. 86-96
- Hao et al. (2005) Hao, L., et al. 2005, ApJ, 625, L75
- Hao et al. (2007) Hao, L., Weedman, D. W., Spoon, H. W. W., Marshall, J. A., Levenson, N. A., Elitzur, M., & Houck, J. R. 2007, ApJ, 655, L77
- Ho et al. (1997) Ho, L. C., Filippenko, A. V., Sargent, W. L. W., & Peng, C. Y. 1997, ApJS, 112, 391
- Ho (1999) Ho, L. C. 1999, ApJ, 516, 672
- Ho & Ulvestad (2001) Ho, L. C., & Ulvestad, J. S. 2001, ApJS, 133, 77
- Ho (2002) Ho, L. C. 2002, ApJ, 564, 120
- Hopkins et al. (2004) Hopkins, P. F., et al. 2004, AJ, 128, 1112
- Houck et al. (2004) Houck, J. R., et al. 2004, ApJS, 154, 18
- Imanishi et al. (2007) Imanishi, M., Dudley, C.C., Maiolino, R. Maloney, P.R., Nakagawa, T., Risaliti, R. 2007, ApJ, in press (astro-ph/0702136)
- Jiang et al. (2006) Jiang, L., et al. 2006, AJ, 132, 2127
- Kaspi et al. (2005) Kaspi, S., Maoz, D., Netzer, H., Peterson, B. M., Vestergaard, M., & Jannuzi, B. T. 2005, ApJ, 629, 61
- Kennicutt (1998) Kennicutt, R. C., Jr. 1998, ARA&A, 36, 189
- Kuhn et al. (2001) Kuhn, O., Elvis, M., Bechtold, J., & Elston, R. 2001, ApJS, 136, 225
- La Franca et al. (2005) La Franca, F., et al. 2005, ApJ, 635, 864
- Lamastra et al. (2006) Lamastra, A., Perola, G. C., & Matt, G. 2006, A&A, 449, 551
- Laor (2003) Laor, A. 2003, ApJ, 590, 86
- Laor & Draine (1993) Laor, A., & Draine, B. T. 1993, ApJ, 402, 441
- Lawrence (1991) Lawrence, A. 1991, MNRAS, 252, 586
- Lutz et al. (2005) Lutz, D., Valiante, E., Sturm, E., Genzel, R., Tacconi, L. J., Lehnert, M. D., Sternberg, A., & Baker, A. J. 2005, ApJ, 625, L83
- Lutz et al. (2007) Lutz, D., et al. 2007, ApJ, in press
- Marconi et al. (2004) Marconi, A., Risaliti, G., Gilli, R., Hunt, L. K., Maiolino, R., & Salvati, M. 2004, MNRAS, 351, 169
- Maiolino & Rieke (1995) Maiolino, R., & Rieke, G. H. 1995, ApJ, 454, 95
- Maiolino et al. (2001a) Maiolino, R., Marconi, A., Salvati, M., Risaliti, G., Severgnini, P., Oliva, E., La Franca, F., & Vanzi, L. 2001a, A&A, 365, 28
- Maiolino et al. (2001b) Maiolino, R., Marconi, A., & Oliva, E. 2001b, A&A, 365, 37
- Malkan et al. (1998) Malkan, M. A., Gorjian, V., & Tam, R. 1998, ApJS, 117, 25
- Marziani et al. (2003) Marziani, P., Sulentic, J. W., Zamanov, R., Calvani, M., Dultzin-Hacyan, D., Bachev, R., & Zwitter, T. 2003, ApJS, 145, 199
- McLure et al. (2006) McLure, R. J., Jarvis, M. J., Targett, T. A., Dunlop, J. S., & Best, P. N. 2006, MNRAS, 368, 1395
- Blandford et al. (1990) Blandford, R. D., Netzer, H., Woltjer, L., Courvoisier, T. J.-L., & Mayor, M. 1990, Saas-Fee Advanced Course 20. Lecture Notes 1990. Swiss Society for Astrophysics and Astronomy, XII, 280 pp. 97 figs.. Springer-Verlag Berlin Heidelberg New York
- Netzer et al. (2004) Netzer, H., Shemmer, O., Maiolino, R., Oliva, E., Croom, S., Corbett, E., & di Fabrizio, L. 2004, ApJ, 614, 558
- Netzer et al. (2006) Netzer, H., Mainieri, V., Rosati, P., & Trakhtenbrot, B. 2006, A&A, 453, 525
- Netzer et al. (2007) Netzer, H., et al. 2007, ApJ, submitted
- Omont et al. (2003) Omont, A., Beelen, A., Bertoldi, F., Cox, P., Carilli, C. L., Priddey, R. S., McMahon, R. G., & Isaak, K. G. 2003, A&A, 398, 857
- Peeters et al. (2004) Peeters, E., Spoon, H. W. W., & Tielens, A. G. G. M. 2004, ApJ, 613, 986
- Pellegrini et al. (2000) Pellegrini, S., Cappi, M., Bassani, L., della Ceca, R., & Palumbo, G. G. C. 2000, A&A, 360, 878
- Peng et al. (2006) Peng, C. Y., Impey, C. D., Ho, L. C., Barton, E. J., & Rix, H.-W. 2006, ApJ, 640, 114
- Peterson et al. (1998) Peterson, B. M., Wanders, I., Bertram, R., Hunley, J. F., Pogge, R. W., & Wagner, R. M. 1998, ApJ, 501, 82
- Peterson et al. (2000) Peterson, B. M., et al. 2000, ApJ, 542, 161
- Pier & Krolik (1993) Pier, E. A., & Krolik, J. H. 1993, ApJ, 418, 673
- Priddey et al. (2003) Priddey, R. S., Isaak, K. G., McMahon, R. G., & Omont, A. 2003, MNRAS, 339, 1183
- Richards et al. (2006) Richards, G. T., et al. 2006, ApJS, 166, 470
- Risaliti et al. (1999) Risaliti, G., Maiolino, R., & Salvati, M. 1999, ApJ, 522, 157
- Schweitzer et al. (2006) Schweitzer, M., et al. 2006, ApJ, 649, 79
- Scoville & Norman (1995) Scoville, N., & Norman, C. 1995, ApJ, 451, 510
- Scott et al. (2004) Scott, J. E., Kriss, G. A., Brotherton, M., Green, R. F., Hutchings, J., Shull, J. M., & Zheng, W. 2004, ApJ, 615, 135
- Siebenmorgen et al. (2005) Siebenmorgen, R., Haas, M., Krügel, E., & Schulz, B. 2005, A&A, 436, L5
- Shang et al. (2005) Shang, Z., et al. 2005, ApJ, 619, 41
- Shemmer et al. (2004) Shemmer, O., Netzer, H., Maiolino, R., Oliva, E., Croom, S., Corbett, E., & di Fabrizio, L. 2004, ApJ, 614, 547
- Shi et al. (2006) Shi, Y., et al. 2006, ApJ, 653, 127
- Silva et al. (2004) Silva, L., Maiolino, R., & Granato, G. L. 2004, MNRAS, 355, 973
- Simpson (2005) Simpson, C. 2005, MNRAS, 360, 565
- Soifer et al. (2004) Soifer, B. T., et al. 2004, ApJS, 154, 151
- Spergel et al. (2003) Spergel, D. N., et al. 2003, ApJS, 148, 175
- Spoon et al. (2007) Spoon, H. W. W., Marshall, J. A., Houck, J. R., Elitzur, M., Hao, L., Armus, L., Brandl, B. R., & Charmandaris, V. 2007, ApJ, 654, L49
- Steffen et al. (2003) Steffen, A. T., Barger, A. J., Cowie, L. L., Mushotzky, R. F., & Yang, Y. 2003, ApJ, 596, L23
- Steffen et al. (2006) Steffen, A. T., Strateva, I., Brandt, W. N., Alexander, D. M., Koekemoer, A. M., Lehmer, B. D., Schneider, D. P., & Vignali, C. 2006, AJ, 131, 2826
- Sturm et al. (2000) Sturm, E., Lutz, D., Tran, D., Feuchtgruber, H., Genzel, R., Kunze, D., Moorwood, A. F. M., & Thornley, M. D. 2000, A&A, 358, 481
- Sturm et al. (2006a) Sturm, E., et al. 2006a, ApJ, 653, L13
- Sturm et al. (2006b) Sturm, E., Hasinger, G., Lehmann, I., Mainieri, V., Genzel, R., Lehnert, M. D., Lutz, D., & Tacconi, L. J. 2006b, ApJ, 642, 81
- Sturm et al. (2005) Sturm, E., et al. 2005, ApJ, 629, L21
- Suganuma et al. (2006) Suganuma, M., et al. 2006, ApJ, 639, 46
- Teplitz et al. (2006) Teplitz, H. I., et al. 2006, ApJ, 638, L1
- Terashima et al. (2002) Terashima, Y., Iyomoto, N., Ho, L. C., & Ptak, A. F. 2002, ApJS, 139, 1
- Tozzi et al. (2006) Tozzi, P., et al. 2006, A&A, 451, 457
- Treister & Urry (2005) Treister, E., & Urry, C. M. 2005, ApJ, 630, 115
- Ueda et al. (2003) Ueda, Y., Akiyama, M., Ohta, K., & Miyaji, T. 2003, ApJ, 598, 886
- Vanden Berk et al. (2001) Vanden Berk, D. E., et al. 2001, AJ, 122, 549
- Vignali et al. (2003) Vignali, C., Brandt, W. N., & Schneider, D. P. 2003, AJ, 125, 433
- Wanders et al. (1993) Wanders, I., et al. 1993, A&A, 269, 39
- Wang et al. (2005) Wang, J.-M., Zhang, E.-P., & Luo, B. 2005, ApJ, 627, L5
- Wang et al. (2007) Wang, J., et al. 2007, in “The Central Engine of Active Galactic Nuclei”, ed. L. C. Ho and J.-M. Wang, in press (arXiv:astro-ph/0702701v1)
- Weedman et al. (2005) Weedman, D. W., et al. 2005, ApJ, 633, 706
| Name | RA(J2000) | Dec(J2000) | z | Ref. | |||||
| (erg/s) | (erg/s) | ||||||||
| High-z luminous QSOs | |||||||||
| 2QZJ002830.4-281706 | 00:12:21.18 | 28:36:30.2 | 2.401 | 46.59 | 44.41 | 9.72 | 0.35 | 1.42 | 1 |
| LBQS0109+0213 | 01:12:16.91 | 02:29:47.6 | 2.349 | 46.81 | 44.51 | 10.01 | 0.30 | 1.75 | 1 |
| HB890123+257a | 01:26:42.79 | 25:59:01.3 | 2.369 | 46.58 | 44.32 | 9.10 | 1.40 | 1.65 | 1 |
| HS0211+1858 | 02:14:29.70 | 19:12:37.0 | 2.470 | 46.63 | 44.38 | 10.11 | 0.16 | 0.01 | 3,10 |
| 2QZJ023805.8-274337 | 02:38:05.80 | 27:43:37.0 | 2.471 | 46.58 | 43.71 | 9.41 | 0.69 | 1.59 | 1 |
| SDSSJ024933.42-083454.4 | 02:49:33.41 | 08:34:54.4 | 2.491 | 46.39 | 44.12 | 9.67 | 0.25 | 1.36 | 1 |
| Q0256-0000 | 02:59:05.64 | 00:11:21.9 | 3.377 | 46.99 | 44.55 | 10.11 | 0.19 | 0.96 | 2 |
| Q0302-0019 | 03:04:49.86 | 00:08:13.4 | 3.286 | 46.83 | 45.01 | 10.11 | 0.30 | 1.66 | 2 |
| HB890329-385 | 03:31:06.34 | 38:24:04.8 | 2.435 | 46.72 | 44.31 | 10.11 | 0.18 | 1.79 | 1 |
| SDSSJ100428.43+001825.6 | 10:04:28.44 | 00:18:25.6 | 3.040 | 46.45 | 44.47 | 9.34 | 0.70 | 0.70 | 3,11 |
| TON618a | 12:28:24.97 | 31:28:37.6 | 2.226 | 47.32 | 44.12 | 10.81 | 0.14 | 1.27 | 1 |
| HB891318-113 | 13:21:09.38 | 11:39:31.6 | 2.306 | 46.90 | 44.32 | 9.76 | 0.62 | 0.99 | 1 |
| HB891346-036 | 13:48:44.08 | 03:53:24.9 | 2.370 | 46.89 | 43.73 | 9.95 | 0.41 | 1.26 | 1 |
| UM629 | 14:03:23.39 | 00:06:06.9 | 2.460 | 46.57 | 44.41 | 9.17 | 1.16 | 1.40 | 1 |
| UM632b | 14:04:45.89 | 01:30:21.9 | 2.517 | 46.55 | 44.04 | 9.44 | 0.61 | 1.27 | 1 |
| SBS1425+606 | 14:26:56.10 | 60:25:50.0 | 3.202 | 47.39 | 45.04 | 9.83 | 1.73 | 1.45 | 1 |
| VCV01J1649+5303 | 16:49:14.90 | 53:03:16.0 | 2.260 | 46.70 | 44.19 | 9.99 | 0.24 | 0.86 | 3,11 |
| SDSSJ170102.18+612301.0 | 17:01:02.18 | 61:23:01.0 | 2.301 | 46.35 | 43.51 | 9.73 | 0.20 | 1.48 | 1 |
| SDSSJ173352.22+540030.5 | 17:33:52.23 | 54:00:30.5 | 3.428 | 47.02 | 44.36 | 9.58 | 1.28 | 1.51 | 1 |
| HB892126-158b | 21:29:12.17 | 15:38:41.0 | 3.282 | 47.27 | 44.66 | 9.73 | 1.60 | 0.72 | 1 |
| 2QZJ221814.4-300306 | 22:18:14.40 | 30:03:06.0 | 2.389 | 46.55 | 43.95 | 9.28 | 0.89 | 1.27 | 1 |
| 2QZJ222006.7-280324 | 22:20:06.70 | 28:03:23.0 | 2.414 | 47.23 | 44.64 | 10.21 | 0.54 | 1.28 | 1 |
| Q2227-3928 | 22:30:32.95 | 39:13:06.8 | 3.438 | 46.95 | 44.02 | 10.31 | 0.19 | 1.25 | 2 |
| HB892254+024 | 22:57:17.56 | 02:43:17.5 | 2.083 | 46.46 | 43.95 | 9.10 | 1.08 | 1.37 | 1 |
| 2QZJ234510.3-293155 | 23:45:10.36 | 29:31:54.7 | 2.382 | 46.33 | 43.97 | 9.38 | 0.42 | 1.26 | 1 |
| High-z QSO aver. (z2.5)c | 46.63 | 44.07 | 9.68 | 0.51 | |||||
| Local QSOs and Sy1s | |||||||||
| Mrk335 | 00:06:19.52 | 20:12:10.4 | 0.025 | 43.62 | 41.29 | 7.10 | 0.28 | 2.00 | 4,14 |
| IIIZw2 | 00:10:30.80 | 10:58:13.0 | 0.090 | 44.02 | 42.25 | 8.19 | 0.16 | 1.56 | 4,13 |
| PG0050+124 | 00:53:34.94 | 12:41:36.2 | 0.058 | 44.36 | 41.87 | 7.09 | 0.96 | 0.91 | 4,13 |
| PG0052+251 | 00:54:52.10 | 25:25:38.0 | 0.155 | 44.46 | 42.57 | 8.55 | 0.21 | 2.27 | 4,13 |
| Fairall9 | 01:23:45.78 | 58:48:20.5 | 0.046 | 43.80 | 41.91 | 8.27 | 0.10 | 1.99 | 4,13 |
| Mrk79 | 07:42:32.79 | 49:48:34.7 | 0.022 | 43.58 | 41.37 | 8.12 | 0.08 | 0.83 | 9,14 |
| PG0804+761 | 08:10:58.60 | 76:02:42.0 | 0.100 | 44.42 | 42.03 | 8.08 | 0.33 | 2.64 | 4,12 |
| Mrk704 | 09:18:26.00 | 16:18:19.2 | 0.029 | 43.44 | 41.18 | 7.97 | 0.08 | – | 4 |
| PG0953+414 | 09:56:52.40 | 41:15:22.0 | 0.234 | 44.96 | 42.69 | 8.39 | 0.56 | 2.12 | 4,13 |
| NGC3516 | 11:06:47.49 | 72:34:06.8 | 0.009 | 42.81 | 40.52 | 7.39 | 0.06 | 1.09 | 7,8,14 |
| PG1116+215 | 11:19:08.60 | 21:19:18.0 | 0.176 | 44.84 | 42.27 | 8.27 | 0.53 | 2.58 | 4,13 |
| NGC3783 | 11:39:01.72 | 37:44:18.9 | 0.010 | 43.05 | 41.10 | 7.33 | 0.09 | 1.46 | 4,13 |
| PG1151+117 | 11:53:49.27 | 11:28:30.4 | 0.176 | 44.48 | 42.09 | 8.31 | 0.28 | 2.50 | 4,12 |
| NGC4051 | 12:03:09.61 | 44:31:52.8 | 0.002 | 41.39 | 39.64 | 5.32 | 0.06 | 0.82 | 5,6,14 |
| PG1211+143 | 12:14:17.70 | 14:03:12.6 | 0.085 | 44.58 | 41.94 | 7.69 | 0.68 | 1.32 | 4,13 |
| NGC4593 | 12:39:39.42 | 05:20:39.3 | 0.009 | 42.60 | 40.34 | 7.40 | 0.04 | 1.26 | 4,14 |
| PG1309+355 | 13:12:17.76 | 35:15:21.2 | 0.184 | 44.50 | 42.18 | 8.29 | 0.30 | 2.45 | 4,12 |
| PG1351+640 | 13:53:15.80 | 63:45:45.4 | 0.087 | 44.80 | 42.52 | 8.76 | 0.28 | 0.86 | 4,13 |
| IC4329a | 13:49:19.26 | 30:18:34.0 | 0.016 | 43.13 | 40.89 | 7.77 | 0.06 | – | 4 |
| NGC5548 | 14:17:59.53 | 25:08:12.4 | 0.017 | 43.10 | 41.15 | 7.78 | 0.06 | 1.73 | 4,13 |
| Mrk817 | 14:36:22.06 | 58:47:39.3 | 0.033 | 43.96 | 41.65 | 8.11 | 0.16 | 0.56 | 4,14 |
| Mrk509 | 20:44:09.73 | 10:43:24.5 | 0.034 | 44.01 | 42.13 | 7.87 | 0.22 | 1.69 | 4,13 |
| Mrk926 | 23:04:43.47 | 08:41:08.6 | 0.047 | 43.83 | 42.29 | 8.55 | 0.08 | – | 4 |
The following quantities are reported in each column: column 1, object name; columns 2-3, coordinates (J2000); column 4, redshift; column 5, log of the continuum luminosity (in units of erg/s) at the rest frame wavelength 5100Å; column 6, log of the [OIII]5007 emission line luminosity (in units of erg/s); column 7, log of the black hole mass (in units of ); column 8, Eddington ratio ; column 9, optical-to-UV (1450Å–5100Å) continuum slope (); column 11: reference for the optical and UV data: 1 - Shemmer et al. (2004), Netzer et al. (2004) and therein references for UV data, 2 - Dietrich et al. (2002) and therein references for UV data, 3 - Juarez et al (in prep.), 4 - Marziani et al. (2003), 5 - Suganuma et al. (2006), 6 - Peterson et al. (2000), 7 - Wanders et al. (1993), 8 - Ho & Ulvestad (2001), 9 - Peterson et al. (1998), 10 - Engels et al. (1998), 11 - SDSS DR5 archive, 12- Baskin & Laor (2005), 13 - Evans & Koratkar (2004), 14 - Kaspi et al. (2005).
-
a
Radio loud QSOs for which the extrapolation of the radio synchrotron emission to the MIR is near or above the observed value, hence the 6.7m flux is probably dominated by synchrotron emission; these objects will be excluded from statistical analyses.
-
b
Radio loud QSOs for which the extrapolation of the radio synchrotron emission to the MIR is well below the observed value, hence the 6.7m flux is likely thermal.
-
c
Optical luminosities, black hole mass and Eddington ratio for the stacked spectrum refer to the average values of only the objects at z2.5, i.e. those who contribute to the Silicate feature observed in the stacked spectrum.
-
d
As discussed in Shemmer et al. (2004), the uncertainties on the BH masses and accretion rate are no larger than a factor of two.
| Name | Si strength | Ref. | |||
|---|---|---|---|---|---|
| (mJy) | |||||
| High-z luminous QSOs | |||||
| 2QZJ002830.4-281706 | 4.8 | -0.59 | 0.75 | 1 | |
| LBQS0109+0213 | 8.3 | -0.91 | 0.75 | 1 | |
| $[$HB89$]$0123+257a | 4.9 | -1.69 | 0.76 | 1 | |
| HS0211+1858 | 7.3 | -1.36 | 1.09 | 1 | |
| 2QZJ023805.8-274337 | 3.7 | -1.04 | 0.62 | 0.810.16 | 1 |
| SDSSJ024933.42-083454.4 | 2.2 | -1.26 | 0.57 | 1 | |
| Q0256-0000 | 2.7 | -1.34 | 0.30 | 1 | |
| Q0302-0019 | 3.6 | -1.67 | 0.56 | 1 | |
| $[$HB89$]$0329-385 | 5.5 | -1.74 | 0.65 | 1 | |
| SDSSJ100428.43+001825.6 | 2.3 | -1.51 | 0.73 | 1 | |
| TON618a | 20.1 | -1.16 | 0.51 | 0.040.01 | 1 |
| $[$HB89$]$1318-113 | 6.6 | -1.70 | 0.47 | 1 | |
| $[$HB89$]$1346-036 | 12.9 | -1.68 | 0.99 | 1 | |
| UM629 | 3.8 | -0.68 | 0.65 | 1 | |
| UM632b | 2.1 | -1.77 | 0.40 | 1 | |
| BS1425+606 | 23.9 | -1.56 | 0.96 | 1 | |
| $[$VCV01$]$J1649+5303 | 9.4 | -1.28 | 1.03 | 1 | |
| SDSSJ170102.18+612301.0 | 3.3 | -0.66 | 0.83 | 1 | |
| SDSSJ173352.22+540030.5 | 2.0 | -2.88 | 0.21 | 1 | |
| $[$HB89$]$2126-158b | 19.1 | -1.18 | 1.08 | 1 | |
| 2QZJ221814.4-300306 | 4.6 | -1.03 | 0.78 | 1 | |
| 2QZJ222006.7-280324 | 16.0 | -1.52 | 0.58 | 0.650.05 | 1 |
| Q2227-3928 | 3.0 | -1.70 | 0.38 | 1 | |
| $[$HB89$]$2254+024 | 3.6 | -1.12 | 0.60 | 0.630.15 | 1 |
| 2QZJ234510.3-293155 | 4.2 | -1.33 | 1.16 | 0.920.15 | 1 |
| High-z QSO aver. (z2.5)c | -1.57 | 0.580.10 | |||
| Local QSOs and Sy1s | |||||
| Mrk335 | 130. | -1.38 | 1.90 | 0.250.06 | 3 |
| IIIZw2 | 52. | -1.09 | 4.02 | 0.050.03 | 2,3 |
| PG0050+124 | 245. | -0.74 | 3.55 | 0.380.05 | 2,3 |
| PG0052+251 | 28. | -1.35 | 2.40 | 0.330.06 | 2,3 |
| Fairall9 | 146. | -0.90 | 4.83 | 0.210.07 | 2,3 |
| Mkr79 | 200. | -1.03 | 2.44 | 0.100.06 | 3 |
| PG0804+761 | 88. | -1.81 | 3.38 | 0.600.05 | 2,3 |
| Mrk704 | 190. | -0.95 | 5.64 | 0.090.06 | 3 |
| PG0953+414 | 26. | -1.88 | 1.68 | 0.400.08 | 2,3 |
| NGC3516 | 210. | -1.05 | 2.40 | 0.060.05 | 3 |
| PG1116+215 | 66. | -1.71 | 3.08 | 0.220.05 | 2,3 |
| NGC3783 | 315. | -1.08 | 2.69 | -0.010.03 | 2,3 |
| PG1151+117 | 10. | -2.19 | 1.08 | 0.360.13 | 2,3 |
| NGC4051 | 230. | -0.43 | 4.71 | 0.060.05 | 3 |
| PG1211+143 | 100. | -1.26 | 1.89 | 0.550.05 | 2,3 |
| NGC4593 | 184. | -1.14 | 3.61 | 0.080.05 | 2,3 |
| PG1309+355 | 25. | -1.24 | 2.82 | 0.410.07 | 2,3 |
| PG1351+640 | 53. | -0.89 | 0.64 | 1.250.05 | 2,3 |
| IC4329a | 487. | -0.67 | 9.00 | 0.010.03 | 2,3 |
| NGC5548 | 69. | -1.06 | 1.53 | 0.270.05 | 2,3 |
| Mrk817 | 140. | -0.65 | 1.61 | 0.160.06 | 3 |
| Mrk509 | 179. | -1.29 | 1.98 | 0.110.04 | 2,3 |
| Mrk926 | 55. | -1.40 | 1.77 | 0.260.04 | 2,3 |
The following quantities are reported in each column: column 1, object name; column 2, continuum flux density at the observed wavelength corresponding to (after removing starburst and stellar components, in units of mJy); column 3, power-law index () fitted to the continuum in the 5–8m range (starburst component–subtracted); column 4, ratio of the continuum emission at 5100Å and at 6.7m, ; column 5, Silicate strength; column 6: reference for the infrared data: 1 - this work (from Spitzer program 20493) ; 2 - Shi et al. (2006); 3 - this work (from Spitzer archival data).
-
a
Radio loud QSOs for which the extrapolation of the radio synchrotron emission to the MIR is near or above the observed value, hence the 6.7m flux is probably dominated by synchrotron emission; these objects will be excluded from statistical analyses.
-
b
Radio loud QSOs for which the extrapolation of the radio synchrotron emission to the MIR is well below the observed value, hence the 6.7m flux is likely thermal.
-
c
The ratio is not defined for the stacked spectrum, since all spectra were normalized to the 6.7m flux before stacking. As a consequence, only the Silicate strength (and more generally the continuum shape) has a physical meaning for the stacked spectrum.