Identification of Absorption Features in an Extrasolar Planet Atmosphere
Abstract
Water absorption is identified in the atmosphere of HD209458b by comparing models for the planet’s transmitted spectrum to recent, multi-wavelength, eclipse-depth measurements (from 0.3 to 1 m) published by Knutson et al. (2007). A cloud-free model which includes solar abundances, rainout of condensates, and photoionization of sodium and potassium is in good agreement with the entire set of eclipse-depth measurements from the ultraviolet to near-infrared. Constraints are placed on condensate removal by gravitational settling, the bulk metallicity, and the redistribution of absorbed stellar flux. Comparisons are also made to the Charbonneau et al. (2002) sodium measurements.
Subject headings:
planetary atmospheres - extrasolar planets1. Introduction
The discovery of transiting extrasolar planets has opened the door to direct detections and characterization of their atmospheres. Observations using the STIS instrument on HST provided the first glimpse of what the photospheric composition is like for a nearby EGP. Charbonneau et al. (2002) measured the relative change in eclipse depth for HD209458b across a sodium doublet (5893Å) resulting in the first detection of atomic absorption in an EGP atmosphere. Following the Na detection, Vidal-Madjar et al. (2003) discovered an extended hydrogen-rich atmosphere surrounding HD209458b using a similar technique as Charbonneau et al., but in the UV. At Lyman- wavelengths, HD209458b is times larger than in the optical. These detections were made using a technique called transit spectroscopy as the planet passes in front of its star. Transit spectroscopy uses the fact that the wavelength-dependent opacities in the planet’s atmosphere obscure stellar light at different planet radii leading to a wavelength-dependent depth of the light-curve during primary eclipse. Consequently, searching for relative changes in eclipse depth as a function of wavelength directly probes the absorption properties of the planet’s atmosphere with the potential to reveal the presence (or absence) of specific chemical species.
In this paper, recent measurements of HD209458b’s radius are combined in a multi-wavelength comparison to model atmosphere predictions. Atmospheric molecular and atomic absorption are identified and constraints are placed on the basic atmospheric properties.
2. The Limb Model
Transit spectroscopy probes the limb of a planet which is the transition region between the day and night sides. One would, therefore, expect that, in the presence of a horizontal temperature gradient between the heated and non-heated hemispheres, the temperatures across the limb would be cooler than the average dayside temperatures Barman et al. (2005); Iro et al. (2005). Recent Spitzer observations of both transiting and non-transiting hot-Jupiters showing large flux variations with phase have provided strong evidence supporting such a day-to-night temperature gradient Charbonneau et al. (2005); Deming et al. (2005b, 2006); Harrington et al. (2006).
Describing the limb ultimately requires a multi-dimensional model atmosphere solution; however, as is common practice, a simpler one-dimensional model is used here to represent the average properties of the limb, in both a longitudinal and latitudinal sense. To explore a variety of limb temperature structures, the incident stellar flux has been scaled by a parameter . A model with represents an average description of the entire planet in the presence of very efficient horizontal energy transport Barman et al. (2005). Increasing to 0.5 increases the heating of the model atmosphere making it more appropriate for just the dayside which, in this work, will represent an upper limit to the plausible mean temperatures at the limb.
The basic chemistry across the limb is modeled assuming chemical equilibrium, determined by minimizing the free energy while including grain formation. To understand the effects of gravitational settling of grains on the chemistry and the transmission spectrum, the removal of grains from the atmosphere is included via two simple approximations that represent opposite extremes. The first is the “cond” approximation used by Barman et al. (2001) and Allard et al. (2001) which simply ignores the grain opacity without altering the chemistry or abundances. The second is the “rainout” approximation which iteratively reduces, at each layer, the elemental abundances (by the appropriate stoichiometric ratios) involved in grain formation and recomputes the chemical equilibrium with each new set of stratified elemental abundances. This approach is similar to other rainout models Fegley & Lodders (1996); Burrows & Sharp (1999), except that the depletion of elements is continued until grains are no longer present.
The transmission of stellar fluxes through the limb of HD209458b is determined by solving the spherically symmetric radiative transfer equation while fully accounting for scattering and absorption of both intrinsic and extrinsic radiation Hauschildt (1992); Barman et al. (2001, 2002). Spherical, instead of the more traditional plane-parallel geometry, naturally accounts for the curvature of the atmospheric layers and changes in chemistry along the slant paths through the upper atmosphere. The planet radius at a given wavelength () is obtained by determining the radial depth at which the transmitted flux is equal to times the incident starlight along that same path.
3. Results
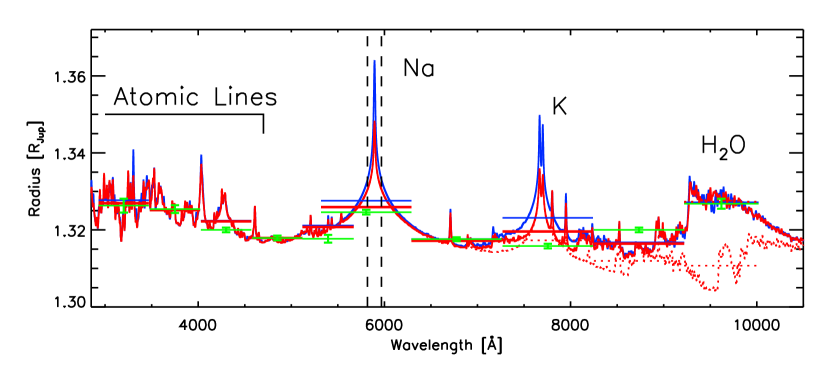
A cloud-free atmosphere with rainout, , and solar abundances is adopted as the baseline model. This model, along with others, is compared to the relative measurements of Knutson et al. (2007) which have a reported precision high enough to constrain many of the basic atmospheric properties. Since a comparison is being made to relative values, the model results were uniformly scaled to match the observations in the 4580 to 5120Å wavelength bin; this scaling was always less than 0.005. Overall, the baseline model (red solid line in Fig. 1) reproduces the observed rise in toward shorter wavelengths, the increase across the Na doublet, and the increase at the far red wavelengths. The baseline model comparison to the data has a that is 3 times smaller than a constant .
3.1. Water Absorption
Water is predicted to be one of the most abundant species in an EGP atmosphere and, given its broad absorption features in the infrared, plays a crucial role in regulating the temperature-pressure (T-P) profile. The first major H2O absorption band appears between 0.8 and 1 m, a region covered by the last two wavelength bins of Knutson et al. (2007). As illustrated in Fig. 1, there is excellent agreement between the baseline model and the observations in this part of the spectrum especially across the longest wavelength bin that sits on top of the H2O band. Qualitatively similar water features are seen in the models of Brown (2001) and Hubbard et al. (2001); however these models fall many below the observations. The baseline model also predicts mean -peaks equal to 1.330, 1.343, and 1.341 for the next three water bands (at , 1.4, and 1.9 m).
A model that excludes H2O line opacity is also shown in Fig. 1 and is greater than 10 below both the observations and the baseline model prediction. Removing H2O opacity also produces a significant drop in near 0.9 m that further increases the discrepancy between the model and overall red/near-IR observations. No other opacity source could be responsible for the observed rise in across this part of the spectrum.
3.2. Photoionization
After the reported sodium detection in the atmosphere of HD209458b Charbonneau et al. (2002), there were several attempts to explain why the strength of this feature was much lower than expected based on earlier models (e.g., by Seager & Sasselov, 2000). Barman et al. (2002) explored departures from local thermodynamic equilibrium (LTE) which are capable of producing an inversion in the cores of the Na doublet line profiles. However, the earlier models of Barman et al. (2001, 2002) were constructed under the cond approximation and, consequently, contained a larger number of free metals along with TiO and VO molecular absorption compared to a rainout model. These additional sources of optical/UV opacity lead to a hotter upper atmosphere and a very shallow photoionization depth for Na (only a 5% reduction of Na across the region probed by transit spectroscopy). Fortney et al. (2003) also explored Na photoionization and found that their atmosphere model (which included rainout) could be brought into reasonable agreement with the Na observations. The models presented here account for the angular dependence of ionziation on the limb’s dayside, but not on the night side. However, Fortney et al. (2003) have shown that Na ionization is still present at past the terminator for pressures relevant to the transit spectrum modeled here.

Figure 1 compares cloud-free solar abundance rainout models with and without photoionization of Na and K. While these models include photoionization, the LTE approximation on the atomic level populations and line source function is maintained. Ionization (radially) at the limb reaches 50% at and 1.2 mbar for Na and K, respectively, and stops at 2 and 7 mbar, respectively, resulting in a reduction of the -peaks across the Na and K lines. For K, this reduction extends out to the line-wings resulting in a significantly smaller mean , bringing the model into agreement with the Knutson et al. measurement. The impact of Na photoionization is mostly confined to the core of the doublet leading to only a small reduction of the mean , but sufficient to bring the model into agreement with the observations at these wavelengths. Though not included here, ionization past the terminator onto the night side should further improve the agreement across the Na and K doublets. The two narrow features on the red wing of the K doublet are due to Rb, which should also be affected by photoionization due to its very low first ionization potential. Photoionization of Rb resulted in a near complete removal of these features, but reduced the mean for this bin by less than 0.002 .
The broad wavelength bins allowed Knutson et al. to obtain very precise relative measurements; however, as illustrated by the Na doublet, such broad bins limits the constraints that can be placed on atomic absorption features. In contrast, the narrow range analyzed by Charbonneau et al. (2002) resulted in much larger error-bars, but still precise enough to easily distinguish between the various models shown in Fig. 1. The flux differences across the Na doublet as a function of time (measured from the transit center) were computed for each model using the same narrow wavelength bins as Charbonneau et al. (2002), indicated in Fig. 1 by vertical dashed lines. Fig. 2 compares model transit curves to the 2002 Na measurements and shows a large discrepancy between the observations and solar abundance models with pure equilibrium chemistry (cond or rainout). Including photoionization brings the baseline rainout model into rough agreement with the observations. Note the cond model shown in Fig. 2 does not include photoionization (similar to the LTE model from Barman et al. (2002)) and illustrates how far off the predicted can be across the Na doublet under simplified assumptions.
3.3. Rainout, Metallicity, and Temperature
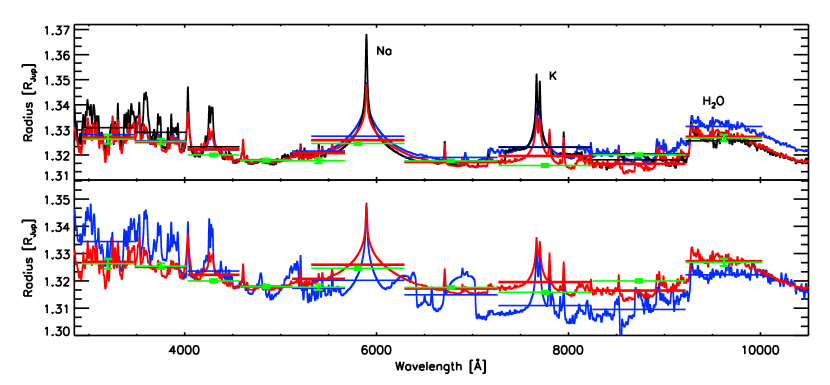
The rainout model used here reduces the individual metal abundances with depth iteratively until clouds do not form, thus mimicking efficient gravitational settling. However, the removal of metals is not 100% efficient, leaving behind a variety of atoms (in addition to Na and K) to contribute to the line opacity. The impact of rainout on the planet’s atmosphere is made apparent by comparing rainout and cond models (Fig. 3). In the cond model grain opacities are simply ignored in the transfer equation while the chemistry remains that of a pure equilibrium model without any actual removal of refractory elements. Thus, the cond model represents the minimum impact of grain formation on the stratified abundances and leaves behind a considerable amount of free metals along with molecules like TiO and VO. This leads to much stronger atomic lines, including Na and K along with TiO and VO bands.
Apart from a very minor contribution from molecules, the features at m are all due to atomic line opacity 111Ballester et al. (2007) claim the rise in the blue/UV is due to the Blamer edge of hot hydrogen in an extended atmosphere. While the present model does not support this explanation, if verified, it could indicate that rainout is more efficient than predicted here.. These narrow features are due to blended lines from metals like Ca, Al, Fe, Ni, Mn, and Cr. Note that, while Rayleigh scattering does contribute to the opacity in the blue/UV, a removal of atomic line opacity would drop by for m. The top panel of Fig. 3 compares the solar abundance rainout model with photoionization (shown in Fig. 1) to a rainout model with 10 solar abundances. Since the metal abundances were uniformly scaled, the grain formation and corresponding removal of refractory elements were also uniformly enhanced. The additional opacity altered the T-P profile as well as the total atmospheric extension. These factors contribute to a similar pattern in the optical but enhanced molecular absorption features in the red/near-IR. The increase in metals increases the H2O absorption feature along with the wings of the Na and K doublets (which form deeper in the atmosphere where photoionization is less important). Also, FeH and CrH absorption is larger in the metal-rich atmosphere leading to an increase in on both sides of the K doublet. The metal-enhanced spectrum is in good agreement with the observations near 0.9m, but is noticeably too high across both the K doublet and the H2O band.
Transit spectroscopy can also help constrain the temperatures across the limb. The lower panel of Fig. 3 compares an model (i.e. a model with a hotter dayside-like T-P profile) to the cooler baseline model. In the hotter model, grain formation is less pronounced resulting in a greater concentration of most free metals and, thus, stronger UV/blue absorption lines than in the model. Higher temperatures at depth also result in equilibrium concentrations of Na and K that are several times lower than found at the cooler temperatures of the model. The net results are two distinctively different spectra with the model being more consistent with the Knutson et al. measurements.
4. Summary
Photoionziation plays an important role for both Na and K, and potentially many other species. No evidence is found to support a large metal enhancement (e.g., 10 solar), though smaller Jupiter-like enhancements are not ruled out. Furthermore, the agreement between model and observations demonstrated here alleviates the need for substantial cloud coverage along the limb between 0.05 and 0.001 bars, which would otherwise truncate and flatten the spectrum Brown (2001). In the baseline model, the predicted location of clouds (e.g., MgSiO3) lies just below the minimum () across the STIS wavelength range, consequently deep clouds (and also very high clouds) remain a possibility.
The models presented here also predict variations ( ) across the 2-0 R-branch of CO in the -band. This is inconsistent (at 2.5) with a non-detection of CO based on Keck-NIRSPEC transit spectra taken in 2002 Deming et al. (2005a). It is likely that using a single T-P profile to represent the horizontal and pole-to-pole variations across the limb averages out too much of the upper atmospheric structure; this simplification might explain the -band discrepancy. High clouds may also be involved. In addition, the Keck and HST observations were taken between 1 and 2 years apart and time-dependent atmospheric variations along the limb cannot be ruled out Menou et al. (2003).
While Knutson et al. (2007) did not attribute their measured variations to any absorption features (this was not the focus of their paper), the models presented above clearly show that these measurements are consistent with strong water absorption near 1 m. A detection of water in the limb of HD209458b is nominally at odds with a recent Spitzer IRS spectrum that shows no H2O features for this planetRichardson et al. (2007). These data were taken during secondary eclipse and directly probe the planet’s dayside with negligible contribution from the limb. It is possible that the dayside atmosphere is nearly isothermal Fortney et al. (2006) which would result in a spectrum with no detectable water absorption features, despite a copious water supply. The transmission spectrum, however, would contain absorption features independent of an isothermal dayside or limb.
References
- Allard et al. (2001) Allard, F., Hauschildt, P. H., Alexander, D. R., Tamanai, A., & Schweitzer, A. 2001, ApJ, 556, 357
- Ballester et al. (2007) Ballester, G. E., Sing, D. K., & Herbert, F. 2007, Nature, 445, 511
- Barman et al. (2001) Barman, T. S., Hauschildt, P. H., & Allard, F. 2001, ApJ, 556, 885
- Barman et al. (2005) —. 2005, ApJ, 632, 1132
- Barman et al. (2002) Barman, T. S., Hauschildt, P. H., Schweitzer, A., Stancil, P. C., Baron, E., & Allard, F. 2002, ApJ, 569, L51
- Brown (2001) Brown, T. M. 2001, ApJ, 553, 1006
- Burrows & Sharp (1999) Burrows, A. & Sharp, C. M. 1999, ApJ, 512, 843
- Charbonneau et al. (2005) Charbonneau, D., Allen, L. E., Megeath, S. T., Torres, G., Alonso, R., Brown, T. M., Gilliland, R. L., Latham, D. W., Mandushev, G., O’Donovan, F. T., & Sozzetti, A. 2005, ApJ, 626, 523
- Charbonneau et al. (2002) Charbonneau, D., Brown, T. M., Noyes, R. W., & Gilliland, R. L. 2002, ApJ, 568, 377
- Deming et al. (2005a) Deming, D., Brown, T. M., Charbonneau, D., Harrington, J., & Richardson, L. J. 2005a, ApJ, 622, 1149
- Deming et al. (2006) Deming, D., Harrington, J., Seager, S., & Richardson, L. J. 2006, ApJ, 644, 560
- Deming et al. (2005b) Deming, D., Seager, S., Richardson, L. J., & Harrington, J. 2005b, Nature, 434, 740
- Fegley & Lodders (1996) Fegley, B. J. & Lodders, K. 1996, ApJ, 472, L37+
- Fortney et al. (2006) Fortney, J. J., Cooper, C. S., Showman, A. P., Marley, M. S., & Freedman, R. S. 2006, ApJ, 652, 746
- Fortney et al. (2003) Fortney, J. J., Sudarsky, D., Hubeny, I., Cooper, C. S., Hubbard, W. B., Burrows, A., & Lunine, J. I. 2003, ApJ, 589, 615
- Harrington et al. (2006) Harrington, J., Hansen, B. M., Luszcz, S. H., Seager, S., Deming, D., Menou, K., Cho, J. Y.-K., & Richardson, L. J. 2006, Science, 314, 623
- Hauschildt (1992) Hauschildt, P. H. 1992, JQSRT, 47, 433
- Hubbard et al. (2001) Hubbard, W. B., Fortney, J. J., Lunine, J. I., Burrows, A., Sudarsky, D., & Pinto, P. 2001, ApJ, 560, 413
- Iro et al. (2005) Iro, N., Bézard, B., & Guillot, T. 2005, A&A, 436, 719
- Knutson et al. (2007) Knutson, H. A., Charbonneau, D., Noyes, R. W., Brown, T. M., & Gilliland, R. L. 2007, ApJ, 655, 564
- Menou et al. (2003) Menou, K., Cho, J. Y.-K., Seager, S., & Hansen, B. M. S. 2003, ApJ, 587, L113
- Richardson et al. (2007) Richardson, L. J., Deming, D., Horning, K., Seager, S., & Harrington, J. 2007, ArXiv Astrophysics e-prints
- Seager & Sasselov (2000) Seager, S. & Sasselov, D. D. 2000, ApJ, 537, 916
- Vidal-Madjar et al. (2003) Vidal-Madjar, A., Lecavelier des Etangs, A., Désert, J.-M., Ballester, G. E., Ferlet, R., Hébrard, G., & Mayor, M. 2003, Nature, 422, 143