001–005
SiO maser observations of a wide dust-temperature range sample
Abstract
We present the results of SiO line observations of a sample of known SiO maser sources covering a wide dust-temperature range. The aim of the present research is to investigate the causes of the correlation between infrared colors and SiO maser intensity ratios among different transition lines. We observed in total 75 SiO maser sources with the Nobeyama 45m telescope quasi-simultaneously in the SiO 0 , 1, 2, 3, 4 and 1 , 2 lines. We also observed the sample in the 29SiO 0 and 1 , and 30SiO 0 lines, and the H2O 61,652,3 line. As reported in previous papers, we confirmed that the intensity ratios of the SiO 0 to lines clearly correlate with infrared colors. In addition, we found possible correlation between infrared colors and the intensity ratios of the SiO 0 to lines.
keywords:
masers — stars: AGB and post-AGB — stars: late-type — stars: mass loss — stars: statistics1 Introduction
An important problem in the studies on the SiO maser was that SiO maser sources ever known were considerably biased. Specifically, the dust (effective) temperature of known SiO maser sources, which was calculated from mid-infrared flux densities (such as the IRAS and MSX flux densities), was limited roughly in a range of 250 K K. This is because the previous SiO maser surveys have been limited to relatively warm dust-temperature ranges. Consequently a non-negligible number of potential SiO maser sources (especially with a low dust-temperature) have been slipped from the previous SiO maser surveys.
[Nyman et al.(1993)] first realized the importance of SiO maser sources exhibiting a low dust-temperature. They investigated how SiO maser emission behaves in a low dust-temperature range by observing OH/IR stars in the SiO 0 and 21 lines. The OH/IR stars often exhibit a low dust-temperature less than K. In their observation cold objects clearly show a larger intensity ratio of the SiO 0 to lines. Both collisional and radiative schemes cannot fully explain this observational properties of the SiO masers ([Bujarrabal(1994), Doel et al.(1995), Bujarrabal 1994]; [Doel et al.(1995), Deol et al. 1995]). [Nyman et al.(1993)] suggested that an infrared H2O line ( ) overlapping with the SiO transition might play an important role. However, in early 1990s the number of cold SiO maser sources (like OH/IR stars) was quite limited, and it was difficult to statistically investigate the relation between infrared colors and intensity ratios of SiO maser lines.
[Nakashima & Deguchi(2003b)] recently extended the Nyman’s study by surveying the SiO maser emission in cold, dusty IRAS sources exhibiting low dust temperature less than 250 K. They found roughly 40 new SiO maser sources in the cold dusty objects, and in conjunction with the results of another SiO maser survey of relatively warm IRAS objects ([Nakashima & Deguchi(2003a), Nakashima & Deguchi 2003a]) they clearly demonstrated that the intensity ratio of the SiO 0 to lines increases in inversely proportional to the dust temperature. [Nakashima & Deguchi(2003b)] again suggested that the overlap line of H2O might explain this correlation if the overlap line becomes stronger with decrease of the dust temperature. To consider further this problems, we need to confirm whether properties of the SiO lines other than 0 and 2 lines are consistent with the existence of the H2O overlap line. In this contributed paper we present the result of quasi-simultaneous observations in the multiple different SiO rotational lines with the Nobeyama 45m telescope. The main aim of the observation is to check the behavior of SiO maser intensity ratios including lines other than the 0 and 2 lines.
2 Observations and Results
The observing targets were selected from Nakashima & Deguchi(2003a, b) and the Nobeyama SiO maser source catalog (Gorny et al. in preparation) in terms of the IRAS colors and flux densities. The targets are distributed roughly in the right ascension range between and , because the cold SiO maser sources found by [Nakashima & Deguchi(2003b)] are distributed roughly in this range. We selected the observing targets basically in order of the brightness at m, but we also paid attention to the source distribution in the IRAS two-color diagram so that the observing targets continuously cover the entire color range.
SiO line observations with the Nobeyama 45m telescope were made in two separated periods: May 11–19, 2004 and February 15–19, 2006. In the first period we observed, in total, 38 objects. The observed SiO transitions in the first period were 0 1, 2, 3 and 1 1, 2. We also observed in the 29SiO 0 0 and 1 0 lines. In addition, we observed 27 objects in the H2O maser line at 22 GHz (52,3) as a backup observation under rainy/heavy cloudy condition. In the second period we observed, in total, 53 objects. The observed transitions in the second period were SiO 0 0, 1, 2, 3, 4, 29SiO 0 0 and 30SiO 0 0. The technical details of the observations will be presented in our future paper (Nakashima & Deguchi, in preparation).
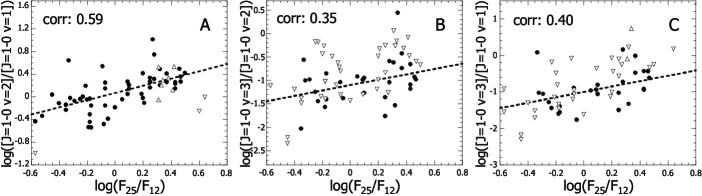
In this paper, we focus on the properties of the SiO 0 , 2 and 3 lines, in which we detected an enough number of objects for statistical analysis. Figure 1 shows the relations between infrared colors and intensity ratios among the SiO maser lines. The line intensities used to calculate the intensity ratios are velocity-integrated intensities. In the panel A of Figure 1 we can clearly confirm the positive correlation between the color and the intensity ratio of the SiO 0 to lines as reported by [Nakashima & Deguchi(2003b)]. Interestingly, the intensity ratios of the 0 to lines and of the 0 to lines seem to also correlate with the color (see, panels B and C) even though the correlation coefficients are slightly smaller than that of panel A.
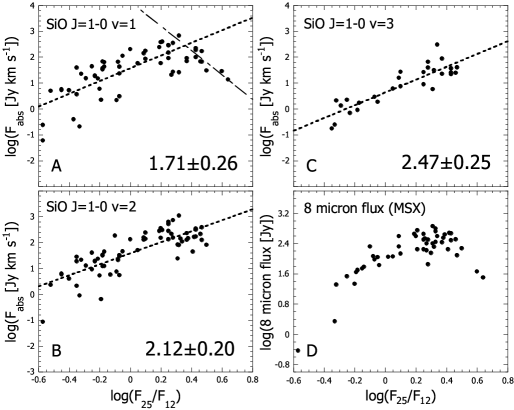
Figure 2 shows the relations between infrared colors and absolute intensities of the SiO maser lines. The intensity of the SiO maser lines is standardized at the distance of 1 kpc using the luminosity distances. The panels A, B and C of Figure 2 show the relations between the color and the absolute intensity of the SiO 0 , 2 and 3 lines. A notable feature seen in these panels is that the SiO maser absolute intensities undoubtedly correlate with the color. Another clear feature is that the higher the vibrational transitions, the steeper the inclination of the dashed lines representing the results of least-square-fitting of a first order polynomial. This tendency is consistent with the correlation seen in Figure 1. In the panel A in Figure 2, the values of the absolute intensity of SiO maser emission seem to maximize at , and the values tend to decrease with increase of the color in the red region above . The color of 0.5 corresponds the boundary between distributions of AGB and post-AGB stars in the color. In fact, the panel A in Figure 1 (and Figure 8 in [Nakashima & Deguchi(2003b), Nakashima & Deguchi 2003b]) shows a sudden change of the feature at . No such change is seen in the panels B and C in Figure 2, simply because the SiO 0 and 3 lines have not been detected above in the present observations.
A possible reason for the correlation seen in panels A, B and C in Figure 2 is that the energy input to the SiO maser region increases with the infrared colors. To confirm this possibility, in panel D in Figure 2 we plotted the 8m flux densities as a function of the infrared colors. The values of the 8m flux densities were taken from the MSX point source catalog. If we rely on the radiative scheme the 8m flux should well represent the energy input to the SiO maser region, because the m corresponds to the SiO transition ([Deguchi & Iguchi(1976), e.g., Deguchi & Iguchi 1976]). In panel D in Figure 2 the 8m flux densities are standardized at the distance of 1kpc using the luminosity distances. The distribution of the data points seen in panel D is, in fact, strikingly similar with those seen in panels A, B and C, supporting that the 8m flux tightly correlates with the SiO maser intensity as suggested by [Bujarrabal et al.(1987)].
3 Discussion
In this section we discuss the possible explanation for the correlation between infrared colors and SiO maser intensity ratios among the , 2 and 3 lines at 43 GHz. One possible explanation is to introduce the overlap line of H2O ( ), which has been first suggested by [Olofsson et al.(1981)] to explain the anomalous, weak intensity of the SiO 1 line in oxygen-rich (O-rich) stars. This H2O line overlaps with the SiO transition with a velocity difference of 1 km s-1. With this line overlap, the level is overpopulated, and the weakness of the SiO 1 line is explained by this overpopulation. The overpopulation at the level is also consistent with the strong intensity of the 0 line. Thus, the correlation between the infrared colors and the intensity ratio of the SiO 0 to lines may be explained if this overlap line of H2O becomes stronger with increase of the infrared colors. One problem in this interpretation is that the intensity ratios of the SiO 0 to lines cannot be explained only by the H2O line. However [Cho et al.(2007)] recently reported an interesting detection of the SiO 1 line toward an S-type star, Cyg. They also confirmed that the SiO 1 line is weak in O-rich stars. The S-type stars have almost same amount of oxygen and carbon atoms in their envelopes, and consequently they have few H2O molecules in the envelopes. These results potentially suggest that another overlap line of H2O affects on the population distribution of SiO in O-rich stars, and [Cho et al.(2007)] have suggested that the H2O line overlapping with the SiO line (with a velocity difference of about 1.5 km s-1) acts on the population distribution of SiO. Thus, if both H2O and lines becomes stronger with increase of infrared colors, all correlations between infrared colors and the SiO maser intensity ratios among the 0 , 2 and 3 lines might be explained. The line intensity of the H2O line is usually weaker than that of the line. This fact also seems to be consistent with the relatively weak intensity of the SiO 0 line.
However, there are some other problems on the explanation with the overlap line of H2O. First, we have to explain how the H2O infrared lines overlapping with the SiO lines become stronger with increase of infrared colors. The relative abundance of H2O molecules possibly increases with infrared colors, but this is not conclusive. Second, the correlation between infrared colors and the intensity ratios of the SiO 0 to lines might be explained without the overlap line of H2O. In the envelopes of very cold objects, strong 8m emission comes from every direction to the SiO masing region, causing ineffective pumping through the SiO transition. On the other hand, 4m emission corresponding to the SiO transition is more effectively pump the SiO population instead of the 8m. These processes might explain the correlation seen in Figure 3 ([Doel et al.(1995), e.g., Doel et al. 1995]). Third, a recent theoretical calculation predicted that if we introduce the overlap line of H2O the spatial distribution of the maser spots cannot be theoretically reproduced ([Soria-Ruiz et al.(2004), Soria-Ruiz et al. 2004]). Thus, this problem will be remain controversial for some more time.
4 Summary
In this research we observed 75 known SiO maser sources quasi-simultaneously in the SiO 0, , 1, 2, 3 and 4 lines, SiO 1 and 2, 29SiO 0 and 1 , and 30SiO 0 lines. We also observed the targets in the H2O 61,652,3 line under rainy/heavy cloudy condition. The sample continuously covers a very wide dust-temperature range from 150 K to 2000 K. The correlation between infrared colors and the intensity ratio of the SiO 0 to lines is confirmed as reported by [Nakashima & Deguchi(2003b)]. The intensity rations of SiO 0 to &2 lines possibly correlate with infrared colors. The overlap lines of H2O might explain the correlations between the infrared colors and the SiO maser intensity ratios among the 0 , 2 and 3 lines, although there are alternative ways to interpret the phenomena.
Acknowledgements.
The present research has been supported by the Academia Sinica Institute of Astronomy & Astrophysics in Taiwan.References
- [Bujarrabal(1994)] Bujarrabal, V. 1994, A&A 285, 953
- [Bujarrabal et al.(1987)] Bujarrabal, V., Planesas, P., & del Romero, A. 1987, A&A 175, 164
- [Cho et al.(2007)] Cho, S.-H., Lee, C. W., & Park, Y.-S. 2007, ApJ 657, 482
- [Deguchi & Iguchi(1976)] Deguchi, S., & Iguchi, T. 1976, PASJ 28, 307
- [Doel et al.(1995)] Doel, R. C., et al. 1995, A&A 302, 797
- [Nakashima & Deguchi(2003a)] Nakashima, J., & Deguchi, S. 2003a, PASJ 55, 203
- [Nakashima & Deguchi(2003b)] Nakashima, J., & Deguchi, S. 2003b, PASJ 55, 229
- [Nyman et al.(1993)] Nyman, L.-Å., Hall, P. J., & Le Bertre, T. 1993, A&A 280, 551
- [Olofsson et al.(1981)] Olofsson, H., Rydbeck, O. E. H., Lane, A. P., & Predmore, C. R. 1981, ApJ 247, L81
- [Olofsson et al.(1985)] Olofsson, H., Rydbeck, O. E. H., & Nyman, L.-A. A&A 150, 169
- [Soria-Ruiz et al.(2004)] Soria-Ruiz, R., et al. 2004, A&A 426, 131
ElitzurIn our recent work, infrared intensity and colors are uniquely determined by the optical depth of the dust shell. SiO maser intensity is also correlated to the optical depth. Therefore, what you are finding is somehow related to the effect of the activity of the photosphere such as the variation of mass loss rates.
NakashimaThanks for useful comments. (We took account of Elitzur’s comments in the text.)