Scaling distributions for and produced in Au+Au collisions at RHIC
Abstract
With the experimental data from STAR and PHENIX on the centrality dependence of the spectra of protons and anti-protons produced at mid-rapidity in Au+Au collisions at 200 GeV, we show that for protons and anti-protons there exists a scaling distribution independent of the colliding centrality. The scaling functions can also describe data from BRAHMS for both proton and anti-proton spectra at and 3.2. The scaling behaviors are shown to be incompatible with the usual string fragmentation scenario for particle production.
pacs:
25.75.Dw,13.85.NiI Introduction
One of the most important quantities in investigating properties of the medium produced in high energy collisions is the particle distribution for different species of final state particles. RHIC experiments have found a lot of novel phenomena from the particle spectra, such as the unexpectedly large ratio at p_pi , the constituent quark number scaling of the elliptic flows flow , and strong nuclear suppression of the pion spectrum in central Au+Au collisions supp , etc. From the spectrum one can learn a lot on the dynamics for particle production.
In many studies, searching for a scaling behavior of some quantities vs suitable variables is useful for unveiling potential universal dynamics. A typical example is the proposal of the parton model from the -scaling of the structure functions in deep-inelastic scatterings xscal . Quite recently, a scaling behavior hy1 of the pion spectrum at mid-rapidity in Au+Au collisions at RHIC was found, which related spectra with different collision centralities. In yang1 the scaling behavior was extended to non-central region, up to for both Au+Au and d+Au collisions. The same scaling function can be used to describe pion spectra for up to a few GeV from different colliding systems at different rapidities and centralities. The shape of pion spectrum in those collisions is determined by only one parameter , the mean transverse momentum of the particle. It is very interesting to ask whether similar scaling behaviors can be found for spectra of other particles produced in Au+Au collisions at RHIC. In this paper, the scaling property of the spectra for protons and anti-protons is investigated and compared with that for pions.
The organization of this paper is as follows. In Sec. II we will address the procedures for searching the scaling behaviors. Then in Sec. III the scaling properties of the spectra for protons and anti-protons produced in Au+Au collisions at RHIC at will be studied. We discuss mainly the centrality scaling of the spectra at mid-rapidity and extend the discussion to very forward region with rapidity and 3.2 briefly. Sec. IV is for discussions on the relation between the scaling behaviors and the string fragmentation scenario.
II Method for searching the scaling behavior of the spectrum
As done in hy1 ; yang1 , the scaling behavior of a set of spectra at different centralities can be searched in a few steps. First, we define a scaled variable
| (1) |
and the scaled spectrum
| (2) |
with and free parameters. As a convention, we choose for the most central collisions. With this choice is nothing but the distribution for the most central collisions. For the spectra with other centralities, we try to coalesce all data points to one curve by choosing proper parameters and . If this can be achieved, a scaling behavior is found. The detailed expression of the scaling function depends, of course, on the choice of and for the most central collisions. This arbitrary can be overcome by introducing another scaling variable
| (3) |
and the normalized scaling function
| (4) |
Here is defined as
| (5) |
By definition, . This scaled transverse momentum distribution is in essence similar to the KNO-scaling kno on multiplicity distribution.
III Scaling behaviors of proton and anti-proton distributions
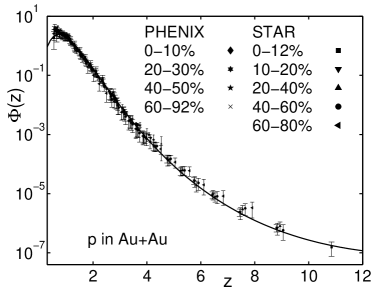
Now we focus on the spectra of protons and anti-protons produced at mid-rapidity in Au+Au collisions at . STAR and PHENIX Collaborations at RHIC published spectra for protons and anti-protons at mid-rapidity for a set of colliding centralities exp ; star . STAR data have a coverage larger than PHENIX ones. As shown in Fig. 1, all data points for proton spectra at different centralities can be put to the same curve with suitably chosen and , by the procedure explained in last section. The parameters are shown in Table I. Except a few points for very peripheral collisions (centralities 60-92% for PHENIX data and 60-80% for STAR data), all points agree well with the curve in about six orders of magnitude. The larger deviation of data at centralities 60-92% for PHENIX and 60-80% for STAR from the scaling curve may be due to the larger centrality coverage, because the size of colliding system changes dramatically in those centrality bins. For simplicity we define , and the curve can be parameterized as
| (6) |
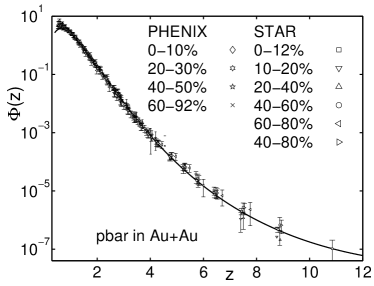
Similarly, one can put all data points for anti-proton spectra at different centralities to a curve with other sets of parameters and which are given also in TABLE I. The agreement is good, as can be seen from Fig. 2, with only a few points in small region for peripheral collisions departing a little from the curve. For anti-proton the scaling function is
| (7) |
with defined above.
| STAR | ||||
| centrality | ||||
| 0-12% | 1 | 1 | 1 | 1 |
| 10-20% | 0.997 | 1.203 | 1.005 | 1.417 |
| 20-40% | 0.986 | 2.009 | 0.991 | 2.305 |
| 40-60% | 0.973 | 4.432 | 0.993 | 5.414 |
| 60-80% | 0.941 | 13.591 | 0.959 | 16.686 |
| 40-80% | 0.986 | 8.126 | ||
| PHENIX | ||||
| centrality | ||||
| 0-10% | 1.042 | 1.226 | 1.068 | 2.404 |
| 20-30% | 1.026 | 2.532 | 1.045 | 4.901 |
| 40-50% | 1.031 | 6.253 | 1.013 | 11.754 |
| 60-92% | 0.934 | 39.056 | 0.935 | 69.31 |
| BRAHMS | ||||
| centrality | ||||
| 0.930 | 0.921 | |||
| 1.079 | 0.754 | 1.153 | 6.985 | |
To see how good is the agreement between the fitted curves in Figs. 1 and 2 and the experimental data, one can calculate a ratio
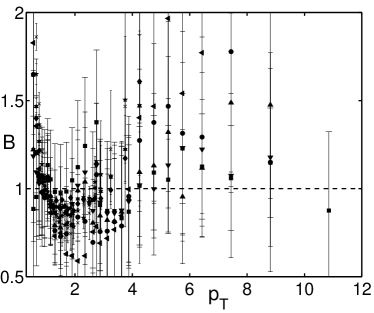
and show as a function of in linear scale for all the data sets, as shown in Fig. 3 for the case of proton. From the figure one can see that almost all the points have values of within 0.7 to 1.3, which means that the scaling is true within an accuracy of 30%. This is quite a good fit, considering the fact that the data cover about 6 orders of magnitude. For anti-protons, the agreement is better than for protons.
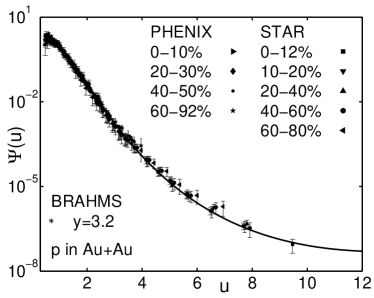
Now one can see that the transverse momentum distributions for protons and anti-protons satisfy a scaling law. For large (thus large ) the scaling functions in Eqs. (6) and (7) behave as powers of , though the expressions are not in powers of or . The scaling functions in Eqs. (6) and (7) depend on the choices of and for the case with centrality 0-12% for STAR data. With the variable defined in Eq. (3) this dependence can be circumvented. ’s for protons and anti-protons are 1.14 and 1.08, respectively, with integration over in the range from 0 to 12, roughly corresponding to the range measured by STAR. The normalized scaling functions for protons and anti-protons can be obtained easily from Eqs. (6) and (7) and are shown in Figs. 4 and 5, respectively together with scaled data points as in Figs. 1 and 2. A simple parameterization for the two normalized scaling functions in Figs. 4 and 5 can be given as follows
with .
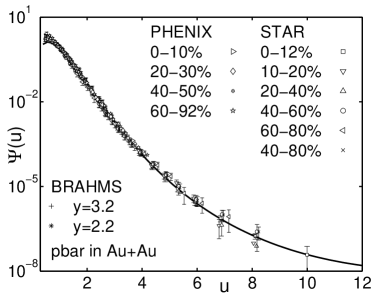
As in the case for pion distributions, one can also investigate the distributions of protons and anti-protons in non-central rapidity regions in Au+Au collisions. The only data set we can find is from BRAHMS brahms at rapidity and 3.2 with centrality 0-10%. It is found that the BRAHMS data can also be put to the same scaling curves, as shown in Figs. 4 and 5. The values of corresponding parameters and are also given in TABLE I. Thus the scaling distributions found in this paper may be valid in both central and very forward regions for protons and anti-protons produced in Au+Au collisions at RHIC at =200 GeV.
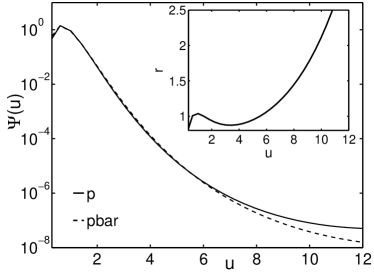
Now one can ask for the difference between the scaling functions for protons and anti-protons. After normalization to 1 the difference between the scaling distributions for protons and anti-protons is shown in Fig. 6. In log scale the difference between the two scaling functions is invisible at low . To show the difference clearly a ratio is plotted in the inset of Fig. 6 as a function of . The increase of with is in agreement qualitatively with data shown in star where it is shown that decreases with monotonically. The difference in the two scaling functions can be understood physically. In Au+Au collisions there are much more quarks than and in the initial state. In the central region in the state just before hadronization, more and quarks can be found because of the nuclear stopping effect in the interactions. As a consequence, more protons can be formed from the almost thermalized quark medium than anti-protons in the small regime. Experimental data show that in low region the yield of anti-proton is about 80% that of protons in central Au+Au collisions at RHIC. This difference contributes to the net baryon density in the central region in Au+Au collisions at RHIC. On the other hand, in the large region, protons and anti-protons are formed mainly from fragmentation of hard partons produced in the QCD interactions with large momentum transfer. As shown in fries , the gluon yield from hard processes is about five times that of and quarks. The fragmentation from a gluon to and is the same. The amount of quarks from hard processes is about 10 times that of when the hard parton’s transverse momentum is high enough. It is well-known that the fragmentation function for a gluon to or is much smaller than that for a or ( or ) to () because of the dominant valence quark contribution to the latter process. As a result, the ratio of yields of proton over anti-proton at large is even more than that at small . After normalizing the distributions to the scaling functions the yield ratio of proton over anti-proton increases approximately linearly with when is large. It should be mentioned that no such difference for and , because they all are composed of a quark and an antiquark.
The scaling behaviors of the distribution functions for protons and anti-protons can be tested experimentally from studying the ratio of moments of the momentum distribution, for . From the determined normalized distributions, the ratio can be calculated by integrating over in the range from 0 to 12, as mentioned above, and the results are tabulated in TABLE II. The values of the ratio are independent of the parameters and in the fitting process but only on the functional form of the scaling distributions. If the scaling behaviors of particle distributions are true, such ratios should be constants independent of the colliding centralities and rapidities. For comparison, the corresponding values of the ratio for pions produced in the same interactions, calculated in yang1 , are also given in TABLE II. Because of very small difference in the scaling distributions for protons and anti-protons at small , the ratio for protons increases with at about the same rate as for anti-proton for small . For large , the ratio for becomes larger than that for because of the big difference in the scaling functions for and at large . Because of the very strong suppression of high transverse momentum proton production relative to that of pions, the ratio for pions increases with much more rapidly than for and .
| 2 | 1.194 | 1.215 | 1.65 |
|---|---|---|---|
| 3 | 1.717 | 1.775 | 4.08 |
| 4 | 2.978 | 3.064 | 14.4 |
| 5 | 6.415 | 6.417 | 64.73 |
| 6 | 19.045 | 17.253 | 373.82 |
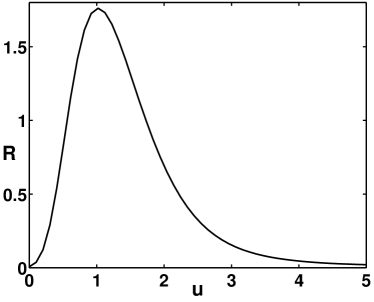
Another important question is about the difference between the scaling functions for protons in this paper and for pions in hy1 ; yang1 . Experiments at RHIC have shown that the ratio of proton yield over that of pion increases with up to 1 in the region GeV and saturates in large region. This behavior should be seen from the scaling functions for these two species of particles. For the purpose of comparing the scaling distributions we define a ratio
| (8) |
and plot the ratio as a function of in Fig. 7. The ratio increases with , when is small, reaches a maximum at about 1 and then decreases. Finally it decreases slowly to about 0.1 for very large . The highest value of is about 1.6, while the experimentally observed over ratio is about 1 at . The reason for this difference is two-fold. One is the normalization difference in defining and the experimental ratio. Another lies in the different mean transverse momenta ’s for pions and protons with which the scaling variable is defined and used in getting the ratio .
The existence of difference in the scaling distributions for different species of particles produced in high energy collisions is not surprising, because the distributions reflect the particle production dynamics which may be different for different particles. In the quark recombination models hy ; gr ; fr pions are formed by combining a quark and an anti-quark while protons by three quarks. Because different numbers of (anti)quarks participate in forming the particles, their scaling distributions must be different. In this sense, our investigation results urge more studies on particle production mechanisms.
IV Discussions
From above investigation we have found scaling distributions for protons and anti-protons produced in Au+Au collisions at RHIC in both mid-rapidity and forward region. The difference between those two scaling distributions is quite small, but they differ a lot from that for pions and the ratio exhibits a nontrivial behavior.
Investigations in hy1 ; yang1 and in this paper have shown that particle distributions can be put to the same curve by linear transformation on . Though we have not yet a uniform picture for the particle productions in high energy nuclear collisions, the scaling behaviors can, in some sense, be compared to that from the string fragmentation picture string . In that picture if there are strings, they may overlap in an area of and the average area for a string is then . It is shown that the momentum distributions can be related to the case in collisions also by a linear variable change . Viewed from that picture, our fitted gives the degree of string overlap. The average area for a string in most central Au+Au collisions is about 70 percent of that in peripheral ones from the values of obtained from fitting the spectra of proton. If string fragmentation is really the production mechanism for all species of particles in the collisions, one can expect that the overlap degree obtained is the same from the changes of spectrum of any particle. In the language in this work, values of are expected the same for pions, protons and other particles in the string fragmentation picture for particle production. Our results show the opposite. Comparing the values of from hy1 and this work, one can see that for pion spectrum is larger for more peripheral collisions but smaller for proton and anti-proton spectra. Our results indicate that other particle production mechanisms may also provide ways to the scaling distributions. Obviously more detailed studies, both theoretically and experimentally, are needed.
Acknowledgements.
This work was supported in part by the National Natural Science Foundation of China under Grant Nos. 10635020 and 10475032, by the Ministry of Education of China under Grant No. 306022 and project IRT0624.References
- (1) S.S. Adler et al., PHENIX Collaboration, Phys. Rev. C 69, 034909 (2004).
- (2) D. Molnár and S.A. Voloshin, Phys. Rev. Lett. 91, 092301 (2003); P.Sorensen,STAR Collaboration, J.Phys. G30, S217 (2004).
- (3) See, for example, S.S.Adler,PHENIX Collaboration, Phys. Rev. Lett. 91, 072301 (2003).
- (4) J.D. Bjorken and E.A. Paschos, Phys. Rev. 185, 1975 (1969).
- (5) R.C. Hwa and C.B. Yang, Phys. Rev. Lett. 90, 212301 (2003).
- (6) L.L. Zhu and C.B. Yang, Phys. ReV. C 75, 044904 (2007).
- (7) Z. Koba, H.B. Nielsen and P. Olesen, Nucl. Phys. B 40, 317 (1972).
- (8) S.S. Adler et al., PHENIX Collaboration, Phys. Rev. Lett. 91, 172301 (2003).
- (9) B.I. Abelev et al., STAR Collaboration, Phys. Rev. Lett. 97, 152301 (2006).
- (10) R. Karabowicz for the BRAHMS Collaboration, talk at Quark Matter 2005, Budapest, Hungary, Nucl. Phys. A 774, 447 (2006); I. Arsene et al., BRAHMS collaboration, nucl-ex/0610021.
- (11) D.K. Srivastava, C. Gale and R.J. Fries, Phys. Rev. C 67, 034903 (2003).
- (12) R.C. Hwa, and C.B. Yang, Phys. Rev. C 67, 034902 (2003).
- (13) V. Greco, C.M. Ko, and P. Lévai, Phys. Rev. Lett. 90, 202302 (2003); Phys. Rev. C 68, 034904 (2003).
- (14) R.J. Fries, B. Müller, C. Nonaka and S.A. Bass, Phys. Rev. Lett. 90, 202303 (2003); Phys. Rev. C 68, 044902 (2003).
- (15) M.A. Braun, F. del Moral, and C. Pajares, Nucl. Phys. A 715, 791 (2003).